
It's time to keep an eye on TLT

Key points
- T-bonds have been in a bear market for over four years
- Longer-term models remain unfavorable
- However, speculators and short-term traders might presently be looking for an opportunity to play the long side
A devastating bear market for long-term treasuries
The chart below displays price action for iShares 20+ Year Treasury Bond ETF (ticker TLT) in recent years. Since the peak during the Covid-19 panic in March 2020, TLT has plummeted. It attempted to push back above its 200-day moving average on several occasions, only to fail.
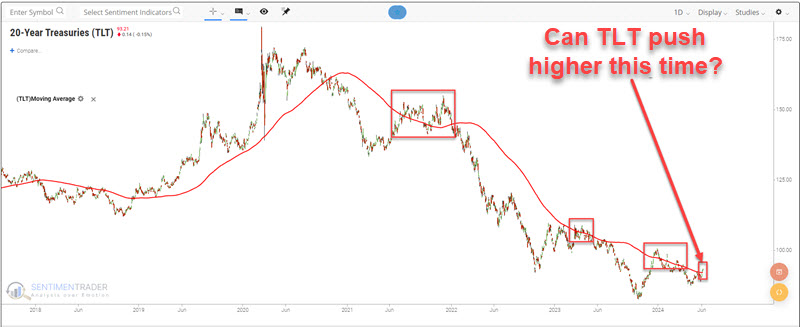
At the far right-hand side of the chart above, we see TLT attempting once again to reverse the trend. Will it be successful this time? The truth is that one can make a compelling argument either way. On the one hand, various longer-term indicators and models related to long-term treasury bonds remain steadfastly unfavorable (see here, here, and here). On that basis, it may not be the ideal time to make a long-term buy=and-hold investment in t-bonds.
On the other hand, for speculators and shorter-term traders, an opportunity may be in the offing, based on the constructive recent price action shown above and the fact that TLT is entering arguably its most favorable seasonal time of year.
A period of typical seasonal strength is about to begin
The chart below displays the annual seasonal trend for TLT. Note that this ETF will soon enter a significantly favorable seasonal period that extends from TDY #110 through TDY #167. For 2024, this period began at the close on 2024-06-07 through 2024-08-29.
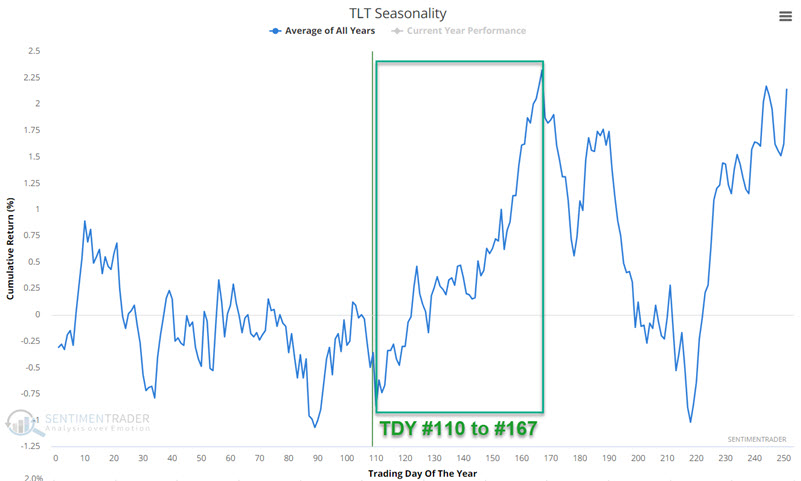
As always, important caveats apply. The adage that seasonality is "climate, not weather" is 100% applicable. Likewise, an annual seasonal trend chart such as the one above is merely an average of past performance and is not a roadmap of what will happen during any given year. Also note the two other words of short-term caution covered later in this piece.
The chart below displays the hypothetical growth of $1 achieved by holding a long position in TLT only during the end of TDY #110 through the end of TDY #167 every year since 2003.
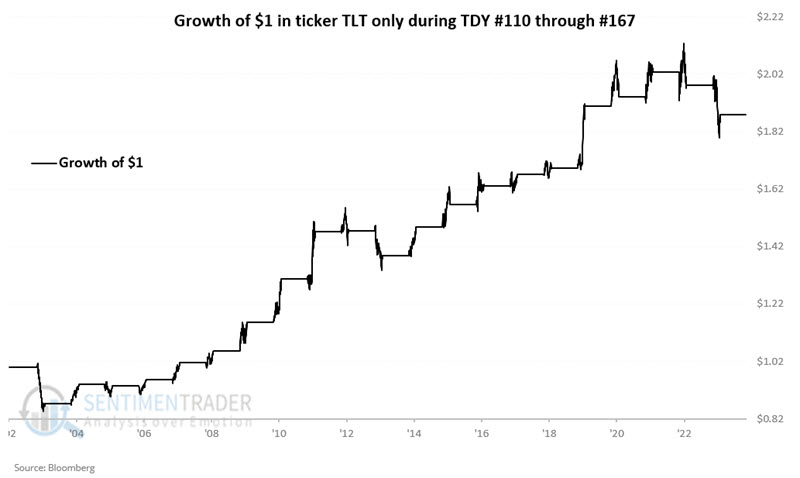
The chart above demonstrates the long-term upside bias during this period. It is worth noting that this period has witnessed a decline in each of the last two years. Likewise, as with any seasonal trend, price strength is not guaranteed during this period in any given year.
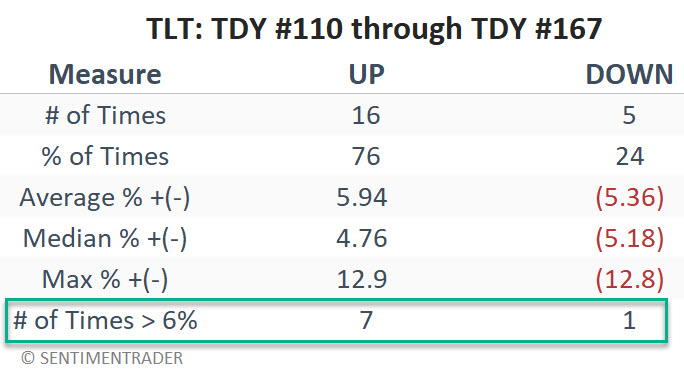
The table below summarizes TLT's performance during this seasonal period.
Two words of caution
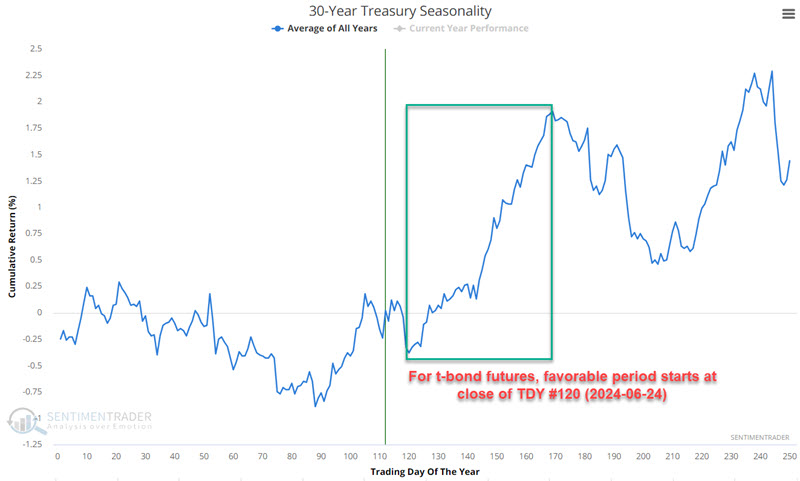
On a short-term basis, ticker TLT is slightly technically overbought, with the 4-day RSI recently reaching 82. Likewise, for 30-year treasury bond futures - which have a longer history than TLT - the favorable cycle does not begin until TDY #120 (i.e., 2024-06-24). The bottom line: a slightly better buying opportunity may emerge if TLT cools off in the short term.
What the research tells us…
Long-term treasury bonds tend to show strength during most of the summer months. But there is absolutely no guarantee on a year-to-year basis that this tendency will play out as expected, and traders are never encouraged to blindly risk money based solely on a previous seasonal tendency. Likewise, on a short-term basis, ticker TLT is slightly technically overbought , so a slightly better buying opportunity may emerge if TLT cools off in the short term. The bottom line is that aggressive traders should carefully consider a potential opportunity to play the long side of TLT and/or TLT call options.