Products
SentimenTrader Trading Tools
‍
Backtest Engine
My Trading Toolkit
Correlation Analysis
Seasonality
Indicators & Data API
‍
Proprietary Indicators & Charts
Market Data API
Strategies & Scanner
‍
50+ Trading Strategies
Smart Stock Scanner
Research Reports
‍
Research Solutions
Reports Library
Free Resources
Simple Backtest Calculator
Simple Seasonality Calculator
The Kelly Criterion Calculator
Sentiment Geo Map
Public Research Reports
Education
Sentiment Indicators
Technical Indicators
Pricing
Company
About
In the News
Testimonials
Client Success Stories
Contact
Log inLoginSign up
< BACK TO ALL REPORTS

It's Been More Than 90 Days Since Small Cap Stocks Did This

Jason Goepfert
2021-07-27
The S&P 500 has set a record high but the Russell 2000 hasn't done so for more than 90 days.

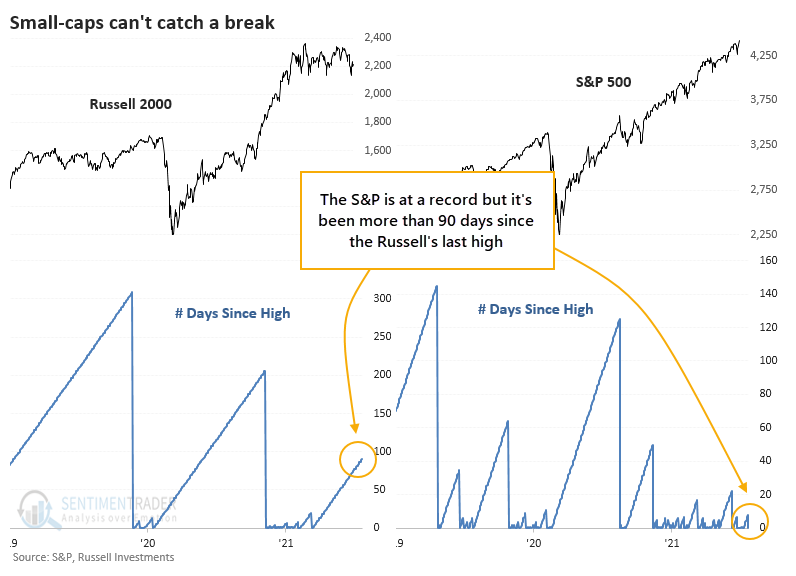
It was a historically persistent and consistent rally for the S&P 500 in the first half of 2021, and things aren't changing much. After a blip on Monday, the index is right back to a record high.

For smaller stocks, it's been much more of a struggle. The Russell 2000 hasn't set a new high for more than 90 days now.

S&P 500 versus Russell 2000

This is part of the reason why some breadth metrics have been struggling. Divergences like that do tend to precede trouble, but clearly, that's having no impact yet and hasn't for this entire year.

If we focus on the interplay of the two indexes and look for times when the S&P set a new high with the Russell not having done so for at least 90 days, it wasn't a bad sign at all.

Over the next six months, the S&P showed a positive return after 20 out of 21 signals, and the sole loser was erased in subsequent months. Over the next 6-12 months, the risk vs. reward was impressively skewed to the upside.


What else we're looking at

  • Full returns in the S&P 500, Russell 2000, and their ratio after lags in the Russell.
  • An update on absolute and relative trends in sector, industry, and country ETFs
  • 3 reasons to keep a close eye on copper

Stat box

As recently as June 7, 100% of developed market indexes were above their 50-day moving averages. Currently, fewer than 70% of indexes are above their averages overseas markets diverge from the steady drumbeat of new highs among U.S. indexes.

Etcetera

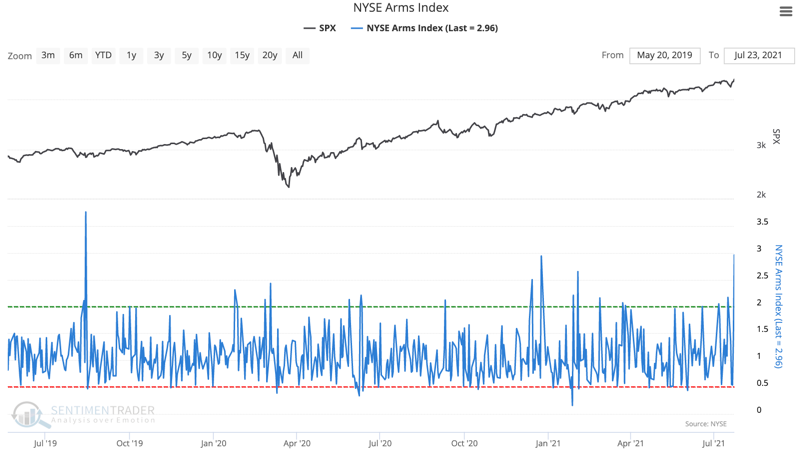
Cracked. The NYSE Arms Index skyrocketed to its highest point since Aug. 2019. This shows that volume was overwhelmingly focused on declining securities on Friday.

nyse arms index trin

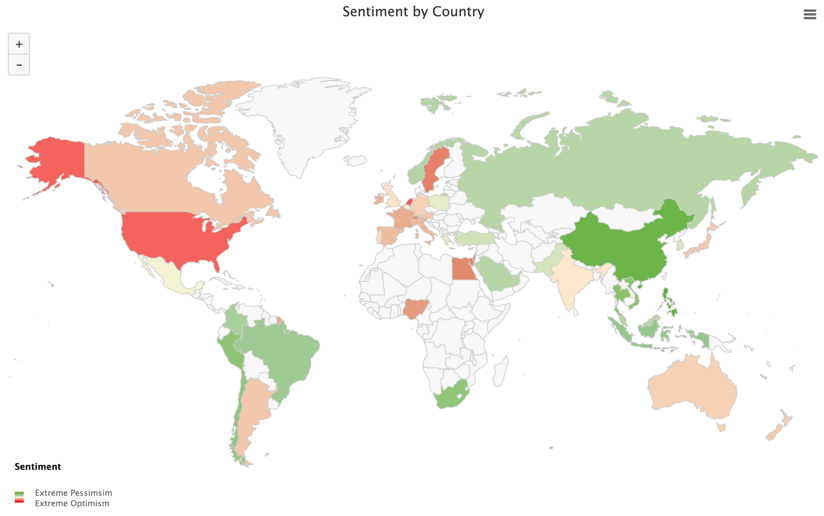
Polar opposites. The United States has the highest optimism rating according to our Optix Geomap. Conversely, China has the lowest optimism, with its 3rd-lowest Optimism Index of the past few months.

optimism index geo map sentiment world

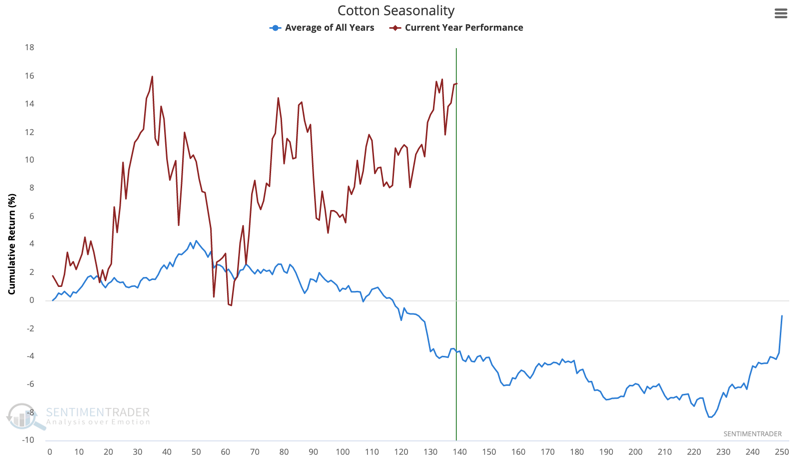
On the contrary. Cotton seasonality typically drops from May to September. This is not the case this year as cotton has rallied for the last four months.

cotton seasonality

PRODUCTS
SentimenTrader
Trading Tools
Indicators & Data API
‍
Strategies & Scanner
‍
Research Reports
FREE
RESOUrCES
Simple Backtest
Calculator
Simple Seasonality
Calculator
The Kelly Criterion
Calculator
Sentiment Geo Map
‍
Public Research Reports
‍
Education
Sentiment Indicators
‍
Technical Indicators
‍
Pricing
Bundle pricing
‍
FAQ
‍
Announcements
‍
COMPANY
‍
About
‍
In the News
‍
Testimonials
‍
Client Success Stories
CONTACT
‍
General Inquiries
‍
Media Inquiries
‍
Financial Professionals Inquiries
‍
© 2026 Sundial Capital Research Inc. All rights reserved.
Setsail Marketing
TermsPrivacyAffiliate Program
Risk Disclosure: Futures and forex trading contains substantial risk and is not for every investor. An investor could potentially lose all or more than the initial investment. Risk capital is money that can be lost without jeopardizing ones’ financial security or life style. Only risk capital should be used for trading and only those with sufficient risk capital should consider trading. Past performance is not necessarily indicative of future results.

Hypothetical Performance Disclosure: Hypothetical performance results have many inherent limitations, some of which are described below. No representation is being made that any account will or is likely to achieve profits or losses similar to those shown; in fact, there are frequently sharp differences between hypothetical performance results and the actual results subsequently achieved by any particular trading program. One of the limitations of hypothetical performance results is that they are generally prepared with the benefit of hindsight. In addition, hypothetical trading does not involve financial risk, and no hypothetical trading record can completely account for the impact of financial risk of actual trading. for example, the ability to withstand losses or to adhere to a particular trading program in spite of trading losses are material points which can also adversely affect actual trading results. There are numerous other factors related to the markets in general or to the implementation of any specific trading program which cannot be fully accounted for in the preparation of hypothetical performance results and all which can adversely affect trading results.

Testimonial Disclosure: Testimonials appearing on this website may not be representative of other clients or customers and is not a guarantee of future performance or success.