
Is Risk On/Risk Off so risk off that it's risk on?

Key points
- Our Risk On/Risk Off indicator measures the relative performance of a variety of indicators
- Typically, higher readings are good (suggesting risk-on behavior), and lower readings are bad (suggesting risk-off behavior)
- Recently, this indicator fell to an extremely low reading that strongly suggests that recent risk-off behavior is overdone
Risk On/Risk Off in general
The Sentimentrader Risk On/Risk Off indicator combines 21 of our best measures of investor mood to objectively designate overall investor behavior as "risk on" (i.e., investors are aggressively buying) or "risk off" (i.e., investors are aggressively selling).
This information can be easily accessed from our website's main menu by selecting "Spotlights" and then "Risk On/Off Composite."
The indicators included in the composite indicator appear below.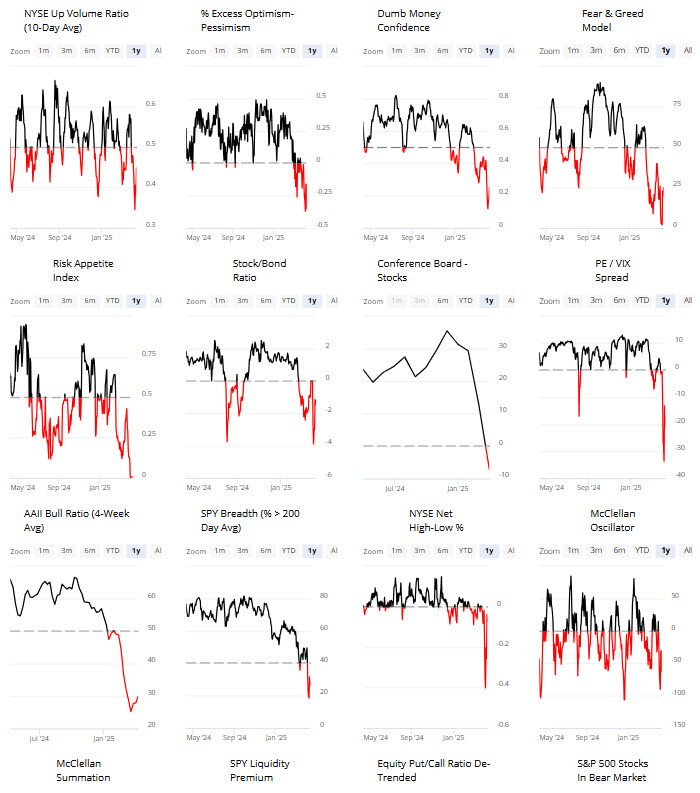
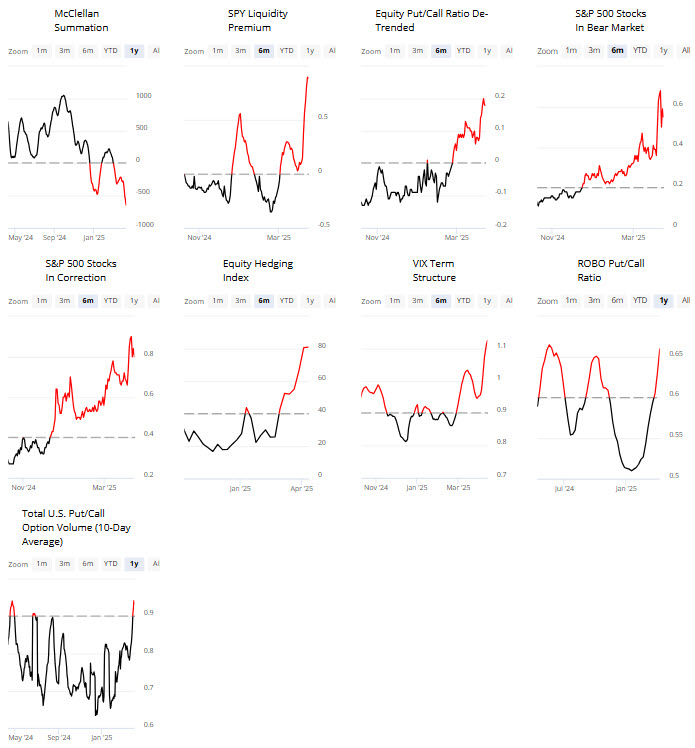
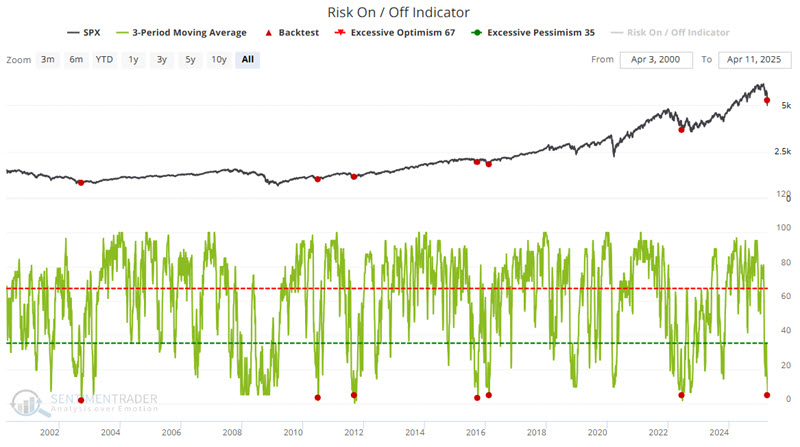
The actual Risk On/Risk Off indicator appears at the bottom of the chart below.
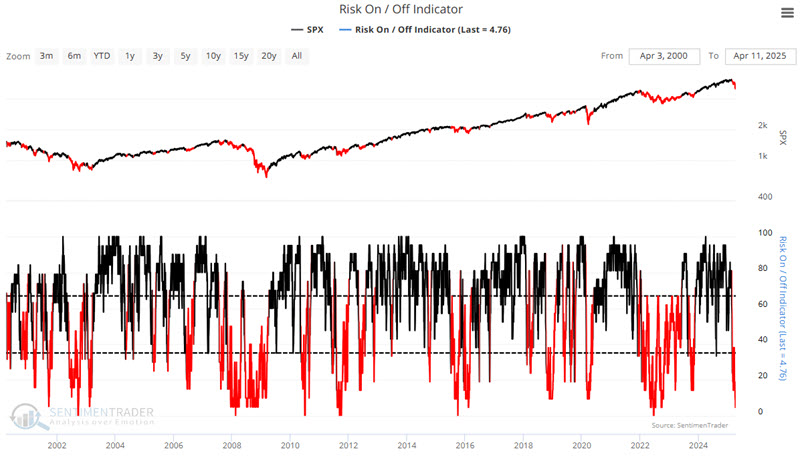
Historically, declines in the Risk On/Risk Off indicator below 35 have been associated with volatile periods in the market involving significant declines. "Playing defense" during these periods can, at times, help investors avoid some of the financial and psychological pain of riding significant drawdowns all the way to the bottom fully invested.
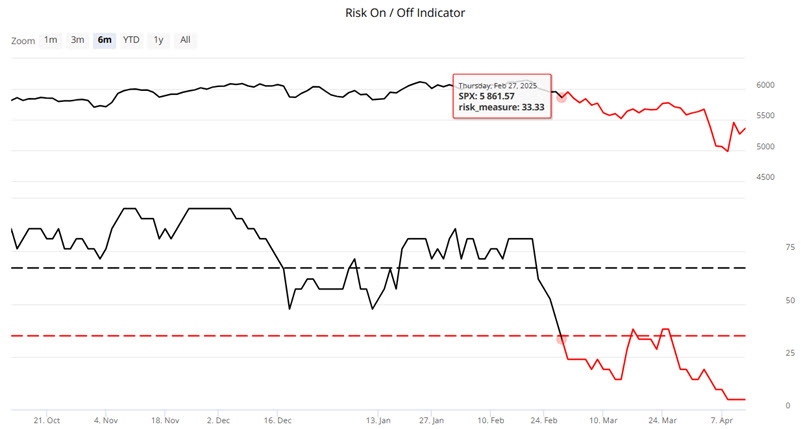
For example, the chart below shows recent indicator and market action. The indicator fell to 33.33 on 2025-02-27 when the S&P 500 was at 5,861.77. By April 8th, the index had plunged 15%.
But now this indicator has gone so far to the unfavorable extreme that it might be "so bad that it's good."
Risk On/Risk Off 3-day moving average plunges to an extreme
The green line in the chart below displays the three-day moving average of the Risk On/Risk Off indicator. The red dots highlight those dates when this three-day average closed below 5 for the first time in three months. The most recent signal occurred on 2025-04-10.
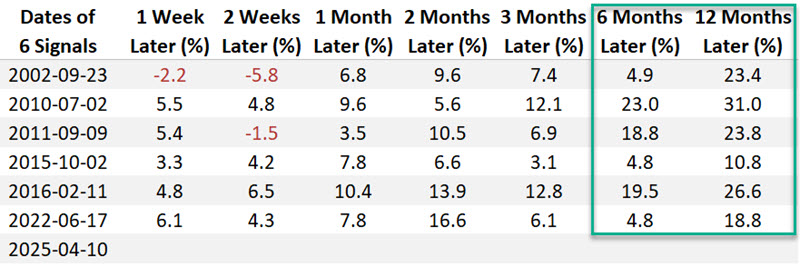
The signal on 2025-04-10 was only the seventh such signal since 2002. The table below displays the S&P 500's performance in the twelve months following each previous signal.
The table below summarizes the results in the chart and table above.
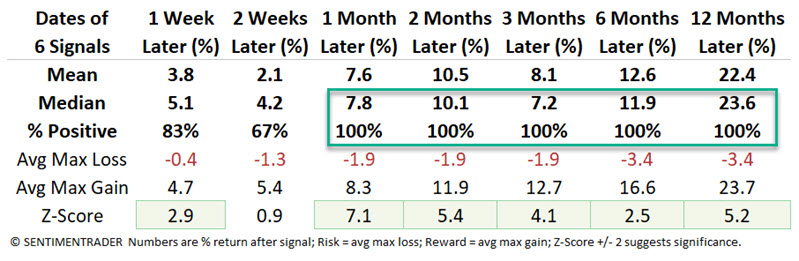
The good news is that previous performance results have been highly favorable. The bad news is that (as always) past performance is never a guarantee of future results. Still, this signal does fall firmly on the favorable side of the "weight of the evidence" ledger.
With the "past performance/no guarantee" caveat in mind, note in the table below that the worst "Max. Loss" within 12-months of a previous signal was -6.83%.
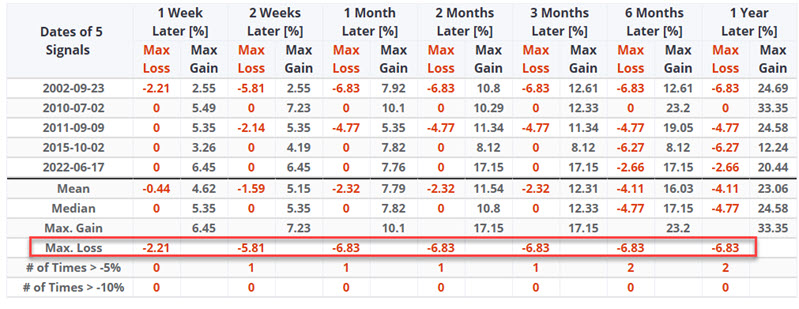
There is no reason this previous worst decline cannot be exceeded. However, as a thought experiment, note that a 6.83% decline from the April 10th S&P 500 close of 5268.05 would pull the index back down to roughly 4908. Note that the intraday low during the recent market sell-off was 4835.
The bottom line: If history remains an accurate guide (and, again, that is not guaranteed), this single iteration of our Risk On/Risk Off indicator seems to suggest we won't make a lower low. The bad news is that a retest of the recent lows cannot be ruled out - and would likely be associated with a great deal of angst among the investing public and, most certainly, the investment media.
One more hopeful note
For what it is worth, the table below summarizes the performance of the various S&P 500 sectors following the signal dates highlighted above.
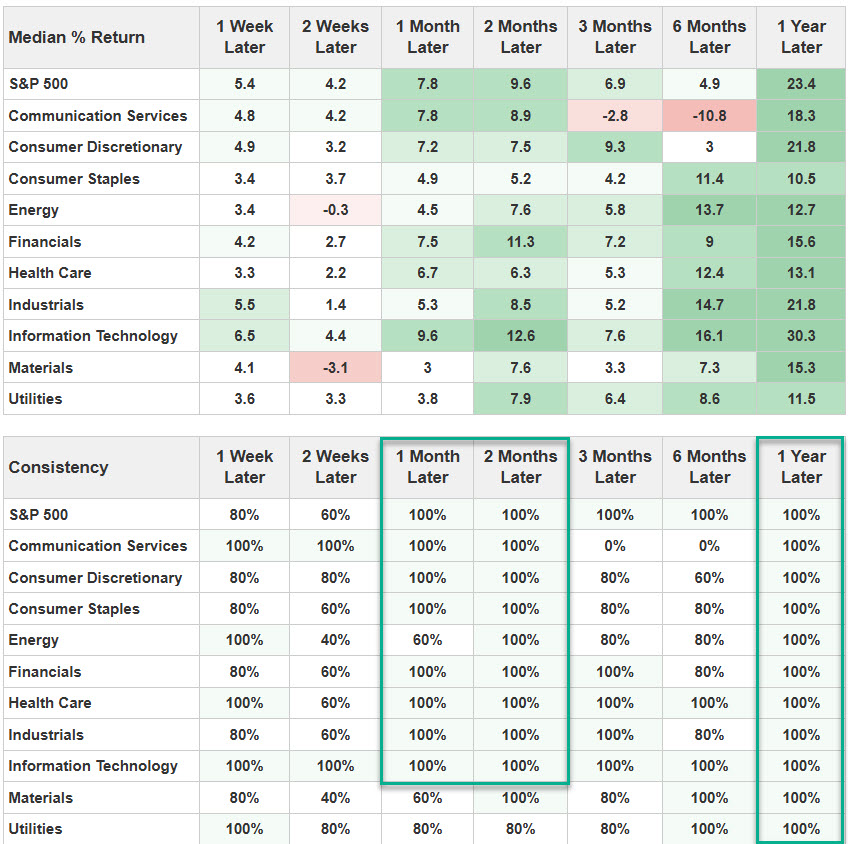
Do the numbers in the table above mean that investors who hold cash should be loading up on stocks? Not necessarily. Again, these results are based solely on an infrequent signal from a single indicator. Nevertheless, the results are compelling.
What the research tells us…
The good news is that - on a standalone basis - the signal and performance highlighted above make a compelling favorable case for stocks. The bad news is that we would never advise basing portfolio decisions on any one indicator or indicator signal. The proper message from the results above is not "All clear for stocks, and happy days are here again." The proper message is "Ignore the bearish noise, manage risk, and keep an open mind to the potential for better results moving forward - but especially manage risk."