Data &
Technology
Research
Reports
Report Solutions
Reports Library
Actionable
Strategies
Free
Resources
Simple Backtest Calculator
Simple Seasonality Calculator
The Kelly Criterion Calculator
Sentiment Geo Map
Public Research Reports
Free Webinar
Pricing
Company
About
Meet Our Team
In the News
Testimonials
Client Success Stories
Contact
Log inLoginSign up
< BACK TO ALL REPORTS

Investors Are Back in Full Risk On Mode

Jason Goepfert
2021-11-03
For the first time in well over a month, investors are back in full risk-on mode.

Investors are back in full risk-on mode.

By early October, stocks had been mired in the longest pullback in over 200 days, finally ending some long momentum streaks, and risk appetite was declining fast. For the first time since the pandemic, the Risk-On/Risk-Off Indicator fell below 50% on consecutive days.

None of those were cause for concern. Historically, buyers have returned quickly after momentum and risk-taking behavior had been so strong, for so long.

Now that stocks have rallied again, investors are back in risk-on mode, in a big way. Speculation in options has ramped up, there is little fear of a November pullback, and almost all core indicators are showing risk-seeking behavior. More than 95% of indicators showed a risk-on attitude by late last week though that's ticked down a tad since then.

Investors are in full risk-on mode

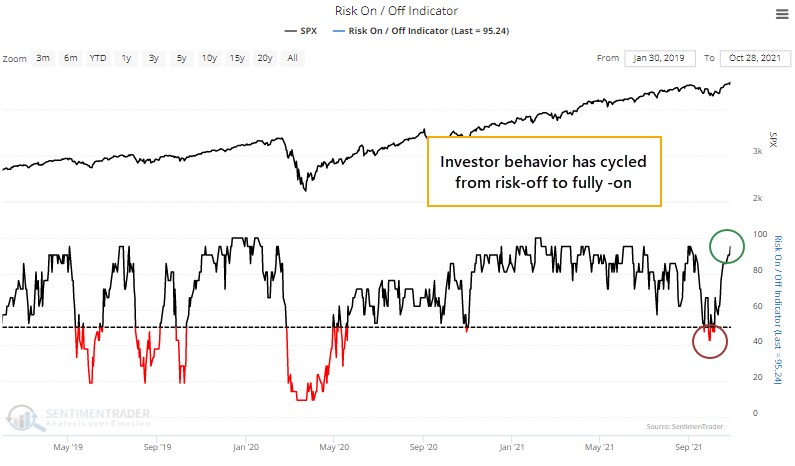
A reading of 95% is in the top 7% of all days since the year 2000, and the S&P 500's annualized return is relatively small after such high readings. It shows a bit of overheated sentiment that tends to work itself off with small gains at best in the short-term. 


What else we're looking at

  • Full returns after behavior cycles from risk-off to risk-on
  • What happens when investors are in full risk-on mode with stocks near highs
  • An update on Tesla options
  • A low-cost way to trade biotech seasonality with options
  • A detailed look at what happens when cyclical stocks hit new highs, and what it means
  • A signal from the behavior of high-beta versus quality stocks

Stat box

The Russell 2000 broke out to a record high for the first time in 161 trading days, ending its 15th-longest streak without a multi-year high since its 1979 inception.

Etcetera

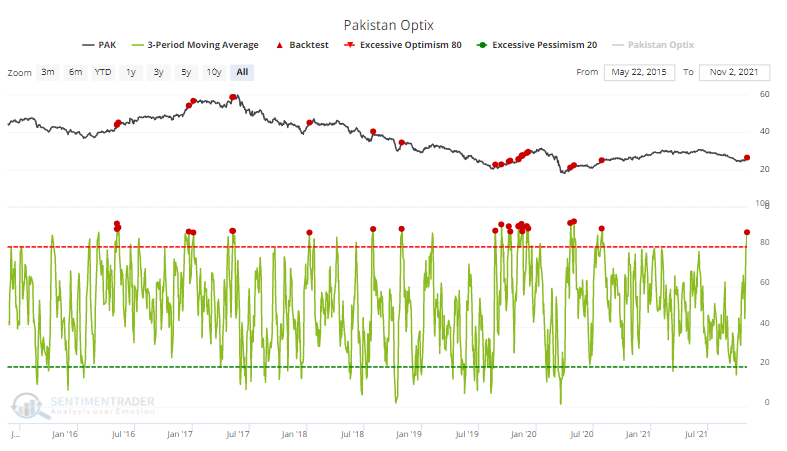
Bears go packing. Optimism on the PAK fund focused on Pakistani stocks has soared. Over the past 3 days, the Optimism Index has averaged 87%, among the top 25 days since the fund's inception.

Optimism on Pakistan has soared

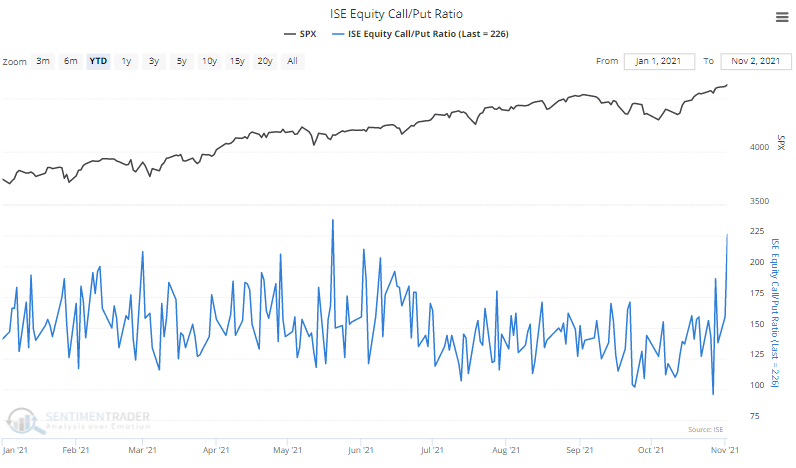
Calling all bulls. Traders on the ISE exchange bought 226 calls for every 100 puts on Tuesday. That's the 2nd-highest reading of the year, suggesting a sudden interest in betting on a further rise in stocks.

Call option buying has jumped

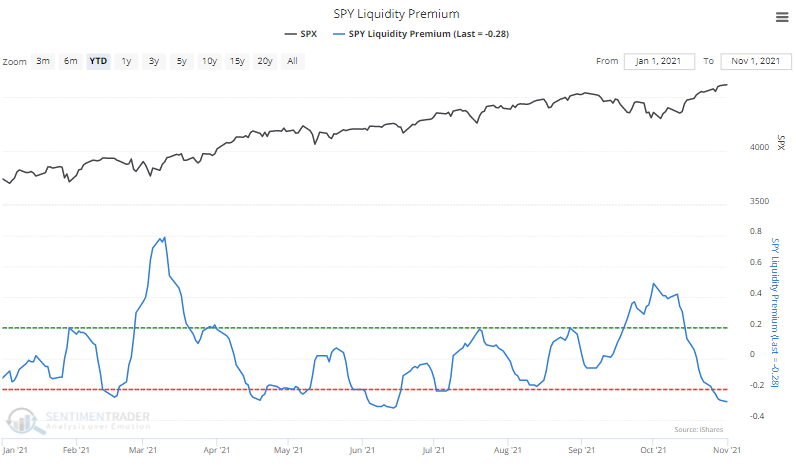
No liquidity, no problem. When traders panic, they want liquidity. When they're complacent, it's not an issue. The Liquidity Premium in SPY shows that right now, they're not worried about it.

SPY liquidity premium has plunged

DATA &
TECHnologies
IndicatorEdge
‍
BackTestEdge
‍
Other Tools
‍
DataEdge API
RESEARCH
reports
Research Solution
‍
Reports Library
‍
actionable
Strategies
Trading Strategies
‍
Smart Stock Scanner
‍
FREE
RESOUrCES
Simple Backtest
Calculator
Simple Seasonality
Calculator
The Kelly Criterion
Calculator
Sentiment Geo Map
‍
Public Research Reports
‍
Free Webinar
COMPANY
‍
About
‍
Meet our Team
‍
In the News
‍
Testimonials
‍
Client Success Stories
Pricing
Bundle pricing
‍
Announcements
‍
FAQ
© 2024 Sundial Capital Research Inc. All rights reserved.
Setsail Marketing
TermsPrivacyAffiliate Program
Risk Disclosure: Futures and forex trading contains substantial risk and is not for every investor. An investor could potentially lose all or more than the initial investment. Risk capital is money that can be lost without jeopardizing ones’ financial security or life style. Only risk capital should be used for trading and only those with sufficient risk capital should consider trading. Past performance is not necessarily indicative of future results.

Hypothetical Performance Disclosure: Hypothetical performance results have many inherent limitations, some of which are described below. No representation is being made that any account will or is likely to achieve profits or losses similar to those shown; in fact, there are frequently sharp differences between hypothetical performance results and the actual results subsequently achieved by any particular trading program. One of the limitations of hypothetical performance results is that they are generally prepared with the benefit of hindsight. In addition, hypothetical trading does not involve financial risk, and no hypothetical trading record can completely account for the impact of financial risk of actual trading. for example, the ability to withstand losses or to adhere to a particular trading program in spite of trading losses are material points which can also adversely affect actual trading results. There are numerous other factors related to the markets in general or to the implementation of any specific trading program which cannot be fully accounted for in the preparation of hypothetical performance results and all which can adversely affect trading results.

Testimonial Disclosure: Testimonials appearing on this website may not be representative of other clients or customers and is not a guarantee of future performance or success.