Data &
Technology
Research
Reports
Report Solutions
Reports Library
Actionable
Strategies
Free
Resources
Simple Backtest Calculator
Simple Seasonality Calculator
The Kelly Criterion Calculator
Sentiment Geo Map
Public Research Reports
Free Webinar
Pricing
Company
About
Meet Our Team
In the News
Testimonials
Client Success Stories
Contact
Log inLoginSign up
< BACK TO ALL REPORTS

Internal momentum has surged in defensive sectors

Jason Goepfert
2022-01-11
The McClellan Summation Index for defensive sectors is extremely high. Optimism on energy stocks is rebounding.

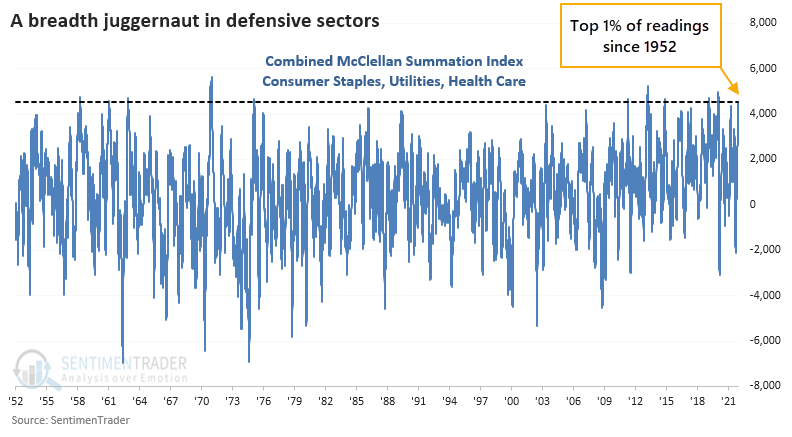
Big positive internal momentum among defensive sectors

Consumer Staples stocks have been on a roll. In December, we saw that those stocks were seeing an impressive thrust and longer-term recovery, which has tended to see further gains in the months ahead.

So far, that's been the case. The McClellan Summation Index for Staples is now well above +1000, one of its highest readings in a decade. It's not just Staples. Another core defensive sector, Utilities, is also seeing impressive internal momentum. And so is the other one, Health Care.

The Summation Index for all 3 sectors is now well above +1000, and their combined value is now in the top 1% of all days since 1952.

Defensive sector McClellan Summation Index is high

It's assumed that if investors are so hyper-focused on defensive stocks, it's a bad omen for the broader market. Not to be. While the S&P 500 didn't exactly go gangbusters after these signs of long-term internal momentum in the defensive sectors, it still showed above-average returns. 

Stat box

Over the past 5 days, an average of more than $370 million per day flowed out of the iShares iBoxx High Yield Corporate Bond ETF (HYG). That's the largest 5-day outflow since March 2021.


Energy optimism shows a positive reversal

Dean noted that a trading model that uses the Optix Index to identify when sentiment reverses from a period of pessimism issued a buy signal for the energy sector on 1/7/22. 

The model applies an 84-day range rank to the 10-day moving average of the Optimism Index for the XLE ETF. As a reminder, the range rank indicator measures the current value relative to all other values over a lookback period. A new buy signal occurs when the range rank crosses back above the 78th percentile. At the same time, the 5-day rate of change for the ETF must be positive.

Energy optimism is rebounding

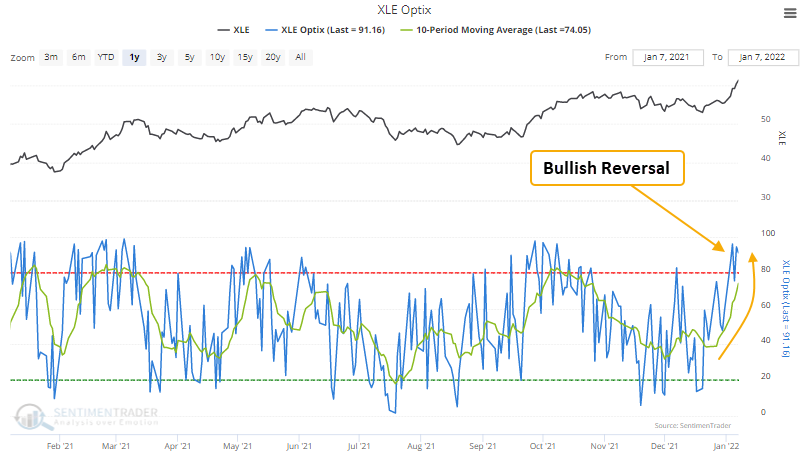
This signal has triggered 32 other times over the past 22 years. After the others, energy sector future returns, win rates, and risk/reward profiles were solid across all time frames, especially the 2-month window. The trading model performed well during the most recent energy bear market period between 2014-2020, with positive returns at some point up to 2 months later in 6 out of 7 instances.

DATA &
TECHnologies
IndicatorEdge
‍
BackTestEdge
‍
Other Tools
‍
DataEdge API
RESEARCH
reports
Research Solution
‍
Reports Library
‍
actionable
Strategies
Trading Strategies
‍
Smart Stock Scanner
‍
FREE
RESOUrCES
Simple Backtest
Calculator
Simple Seasonality
Calculator
The Kelly Criterion
Calculator
Sentiment Geo Map
‍
Public Research Reports
‍
Free Webinar
COMPANY
‍
About
‍
Meet our Team
‍
In the News
‍
Testimonials
‍
Client Success Stories
Pricing
Bundle pricing
‍
Announcements
‍
FAQ
© 2024 Sundial Capital Research Inc. All rights reserved.
Setsail Marketing
TermsPrivacyAffiliate Program
Risk Disclosure: Futures and forex trading contains substantial risk and is not for every investor. An investor could potentially lose all or more than the initial investment. Risk capital is money that can be lost without jeopardizing ones’ financial security or life style. Only risk capital should be used for trading and only those with sufficient risk capital should consider trading. Past performance is not necessarily indicative of future results.

Hypothetical Performance Disclosure: Hypothetical performance results have many inherent limitations, some of which are described below. No representation is being made that any account will or is likely to achieve profits or losses similar to those shown; in fact, there are frequently sharp differences between hypothetical performance results and the actual results subsequently achieved by any particular trading program. One of the limitations of hypothetical performance results is that they are generally prepared with the benefit of hindsight. In addition, hypothetical trading does not involve financial risk, and no hypothetical trading record can completely account for the impact of financial risk of actual trading. for example, the ability to withstand losses or to adhere to a particular trading program in spite of trading losses are material points which can also adversely affect actual trading results. There are numerous other factors related to the markets in general or to the implementation of any specific trading program which cannot be fully accounted for in the preparation of hypothetical performance results and all which can adversely affect trading results.

Testimonial Disclosure: Testimonials appearing on this website may not be representative of other clients or customers and is not a guarantee of future performance or success.