Data &
Technology
Research
Reports
Report Solutions
Reports Library
Actionable
Strategies
Free
Resources
Simple Backtest Calculator
Simple Seasonality Calculator
The Kelly Criterion Calculator
Sentiment Geo Map
Public Research Reports
Free Webinar
Pricing
Company
About
Meet Our Team
In the News
Testimonials
Client Success Stories
Contact
Log inLoginSign up
< BACK TO ALL REPORTS

Interest rates turn "golden"

Jason Goepfert
2020-12-10
The 50-day average of the 10-year Treasury yield has crossed above the 200-day average, forming a "Golden Cross."

Investors have been fearing (or hoping, depending on one's perspective) for higher interest rates for a long time. Over the past couple of months, those fears/hopes have materialized.

For the first time in nearly 2 years, the yield on 10-year Treasury notes has undergone a "Golden Cross", with its 50-day moving average crossing above its 200-day average.

10 year treasury note yield interest rates golden cross

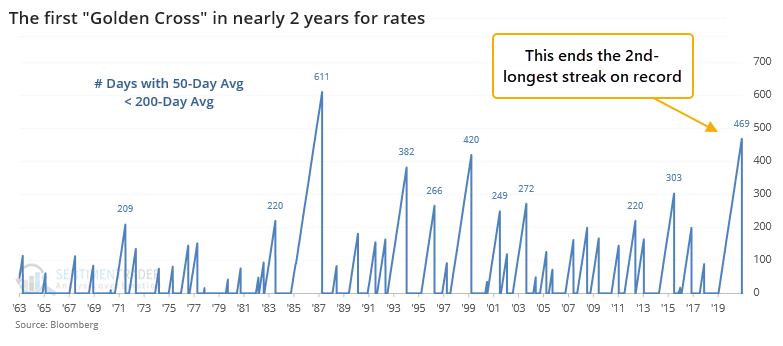
Prior to the past 20 years, the first Cross in at least 200 days tended to lead to even higher rates in the months ahead. Even after the peak in rates in the early 1980s, these signals saw the 10-year yield continue to rise. Not so much since then. 

While some are hoping for higher rates as a sign of improved economic growth, these signals have been more of a hindrance for stock returns, at least over the short- to medium-term. It was less consistent for other markets like the dollar and gold.


What else is happening

These are topics we explored in our most recent research. For immediate access with no obligation, sign up for a 30-day free trial now.

  • Full details on what happens when the 10-year yield enjoys a Golden Cross
  • Including returns on stocks, gold, and the dollar
  • The high-yield bond market has had excellent breadth with many advancing bonds
  • A lot of them are hitting new highs, too
  • Twitter sentiment toward junk bonds is getting quite positive

Stat Box

According to the Investment Company Institute, investors pulled nearly $15 billion from world equity funds, excluding the U.S., in the week ending December 2. That's the 2nd-largest one-week outflow in more than a decade, next to a slightly larger outflow near the end of 2018.

Sentiment from other perspectives

We don't necessarily agree with everything posted here - some of our work might directly contradict it - but it's often worth knowing what others are watching.

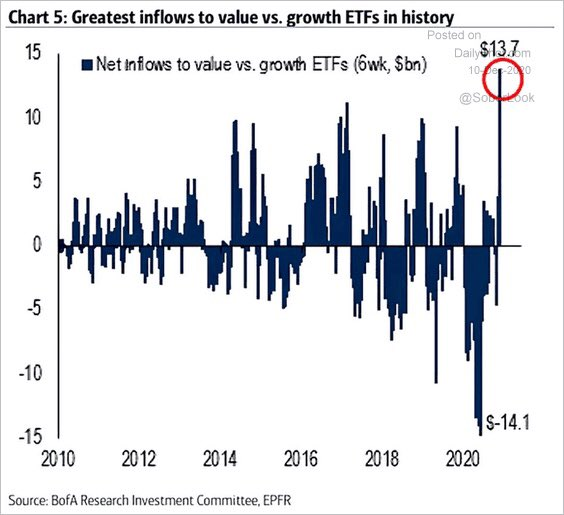
1. Over the past 6 weeks, investors have moved nearly $14 billion into ETFs focused on value stocks relative to growth stocks. That's the biggest shift ever. [BofA via Liz Ann Sonders]

value growth etf flow

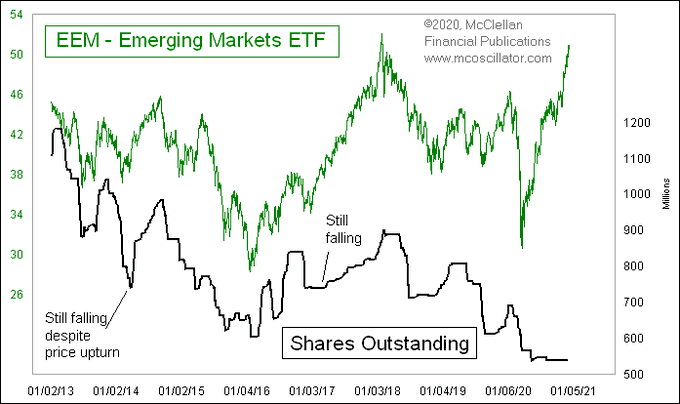
2. Where are investors NOT interested? Emerging markets, apparently. Shares outstanding in EEM have plunged and remain moribund despite rising prices. [Tom McClellan]

eem shares outstanding

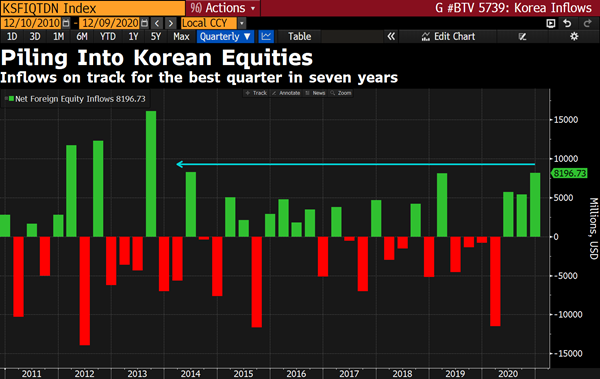
3. Despite showing meager appetite toward emerging markets, investors have flooded into funds focused on Korea, where inflows just hit a 7-year high. [Bloomberg TV]

korea etf flow


DATA &
TECHnologies
IndicatorEdge
‍
BackTestEdge
‍
Other Tools
‍
DataEdge API
RESEARCH
reports
Research Solution
‍
Reports Library
‍
actionable
Strategies
Trading Strategies
‍
Smart Stock Scanner
‍
FREE
RESOUrCES
Simple Backtest
Calculator
Simple Seasonality
Calculator
The Kelly Criterion
Calculator
Sentiment Geo Map
‍
Public Research Reports
‍
Free Webinar
COMPANY
‍
About
‍
Meet our Team
‍
In the News
‍
Testimonials
‍
Client Success Stories
Pricing
Bundle pricing
‍
Announcements
‍
FAQ
© 2024 Sundial Capital Research Inc. All rights reserved.
Setsail Marketing
TermsPrivacyAffiliate Program
Risk Disclosure: Futures and forex trading contains substantial risk and is not for every investor. An investor could potentially lose all or more than the initial investment. Risk capital is money that can be lost without jeopardizing ones’ financial security or life style. Only risk capital should be used for trading and only those with sufficient risk capital should consider trading. Past performance is not necessarily indicative of future results.

Hypothetical Performance Disclosure: Hypothetical performance results have many inherent limitations, some of which are described below. No representation is being made that any account will or is likely to achieve profits or losses similar to those shown; in fact, there are frequently sharp differences between hypothetical performance results and the actual results subsequently achieved by any particular trading program. One of the limitations of hypothetical performance results is that they are generally prepared with the benefit of hindsight. In addition, hypothetical trading does not involve financial risk, and no hypothetical trading record can completely account for the impact of financial risk of actual trading. for example, the ability to withstand losses or to adhere to a particular trading program in spite of trading losses are material points which can also adversely affect actual trading results. There are numerous other factors related to the markets in general or to the implementation of any specific trading program which cannot be fully accounted for in the preparation of hypothetical performance results and all which can adversely affect trading results.

Testimonial Disclosure: Testimonials appearing on this website may not be representative of other clients or customers and is not a guarantee of future performance or success.