Data & Technology
Research Reports
Report Solutions
Reports Library
Actionable StrategiesPricingCompanyContact
Log inLoginSign up
< BACK TO ALL REPORTS

Gold suffers its 1st real test of its long-term trend
Jason Goepfert
2020-12-01
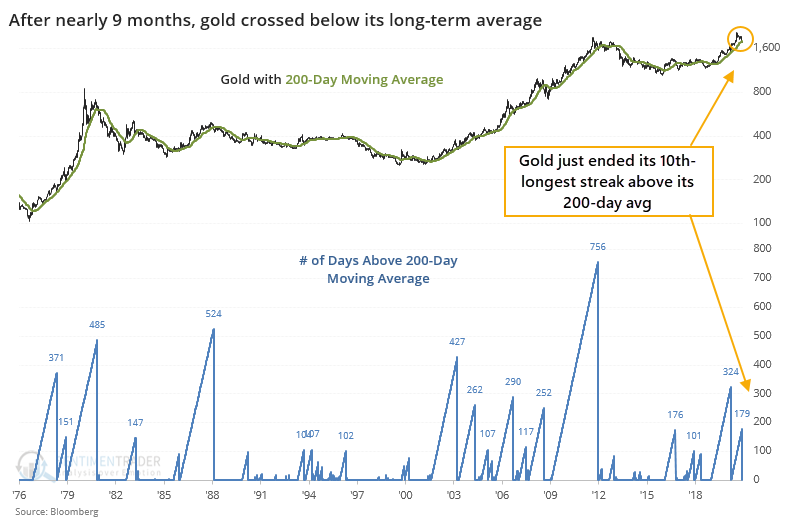
Gold has crossed below its 200-day average for the first time in nearly 9 months. It has also suffered its deepest pullback since 2016 when it had recently been at a new high. This kind of behavior has generally led to higher prices for gold, and for gold mining stocks.

After rallying for months and generating the expected bout of excitement, the mainstay precious metal has lost its luster in favor of bitcoin. For the first time in nearly 9 months, gold has crossed below its 200-day moving average.

This ends its 10th-longest streak above its long-term average.

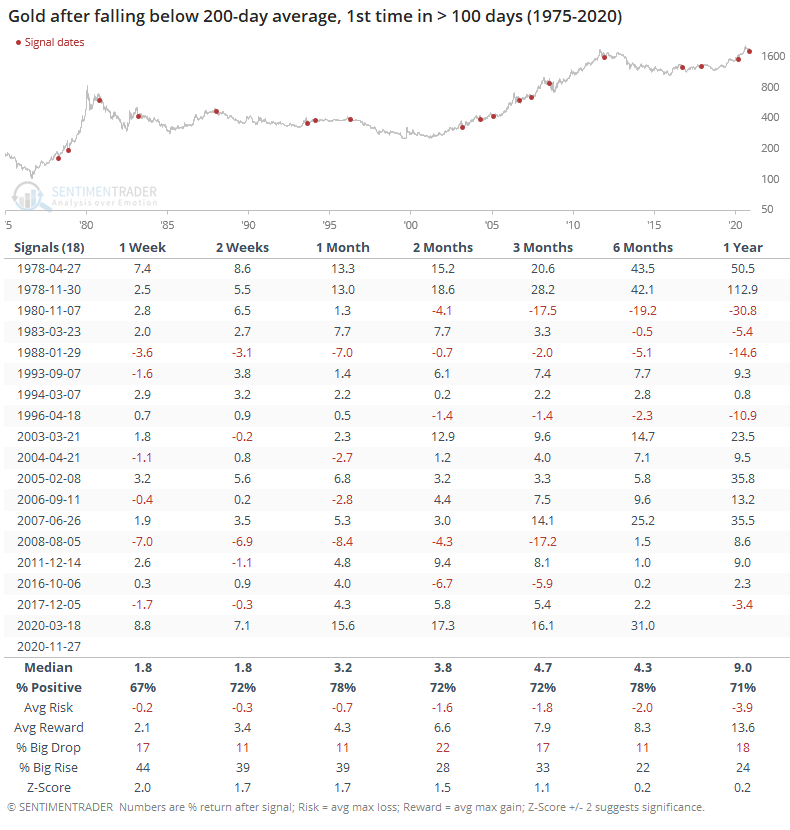
After gold ended other streaks of at least 100 days above its 200-day, it tended to resume its uptrend. Over the next month, gold rebounded 78% of the time, with a heavily positive risk/reward ratio. Returns across all time frames were consistently positive.
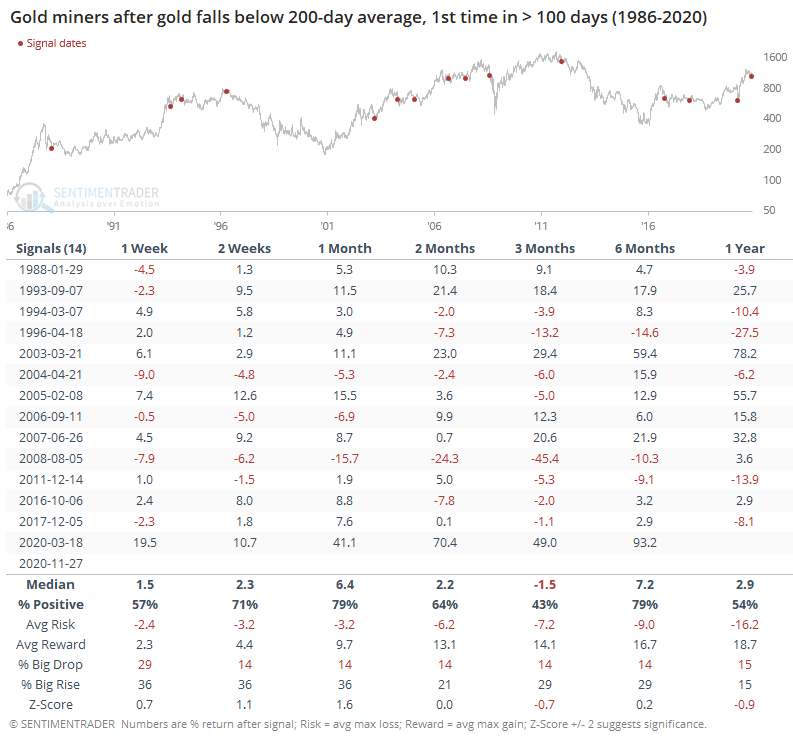
There is a positive correlation between the price of gold and the price action of gold miners. Because gold mostly rallied after these signals, miners also saw mostly positive returns, except for that odd 3-month window which was bookended by more consistently positive results. Over the next 6 months, miners gained ground after 11 out of 14 signals, though those 3 losses were large.
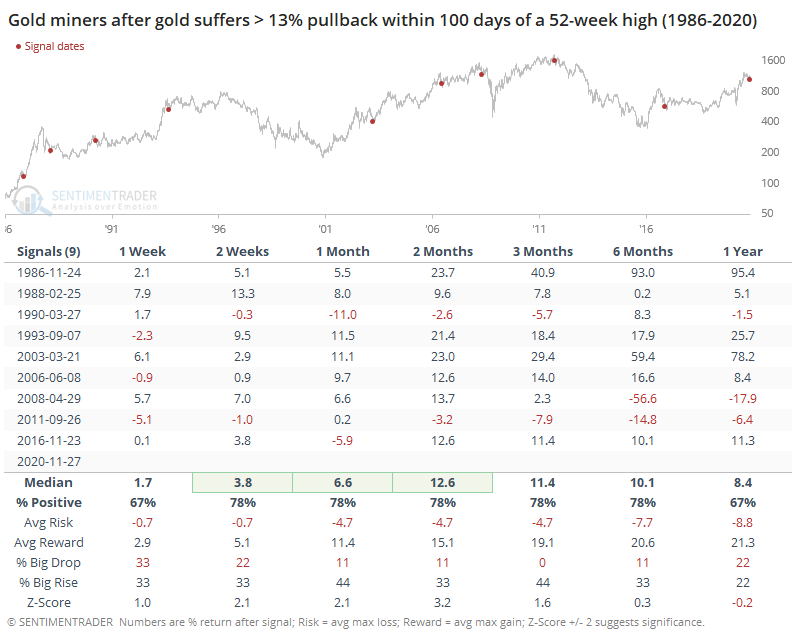
Gold has also pulled back more than 13% from a 52-week high, within 100 days of setting that high. This is its deepest pullback in this kind of a time frame since 2016.
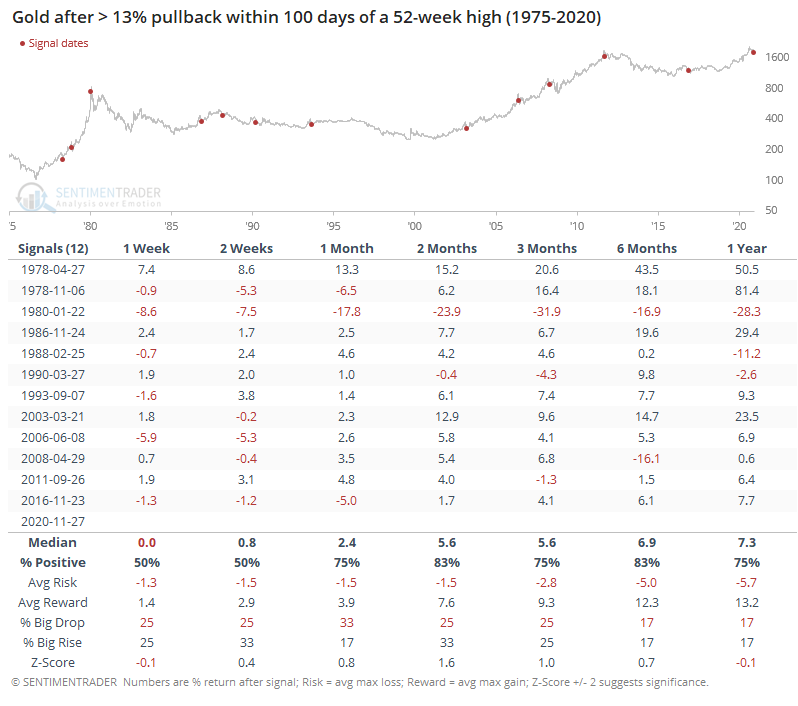
Again, gold performed well going forward. Over the next 2 months, gold gained after 10 out of 12 signals, with the only real failure being that big loss in 1980 when the loss of momentum morphed into a true bear market.

After these signals, miners performed better. Their average return over the next 2-8 weeks was at least 2 standard deviations beyond random, with a heavily skewed risk/reward ratio. Within the next 3 months, miners showed a 44% chance of enjoying a big rise, while none of the signals showed a big drop.
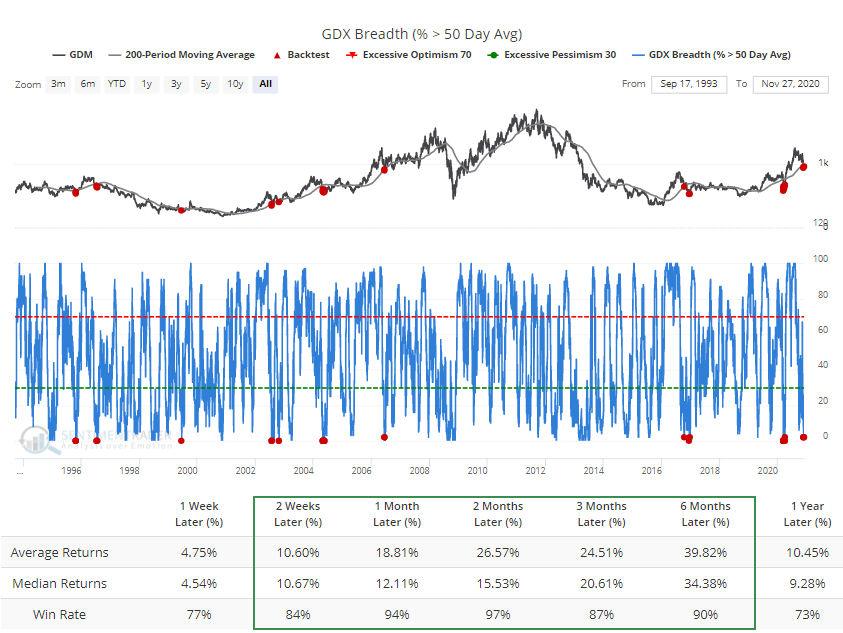
In the premium minutes yesterday, we looked at what has happened when gold mining stocks dipped within a general uptrend and fewer than 3% of miners managed to hold above their 50-day averages. The Backtest Engine shows that miners rebounded 97% of the time over the next 2 months.
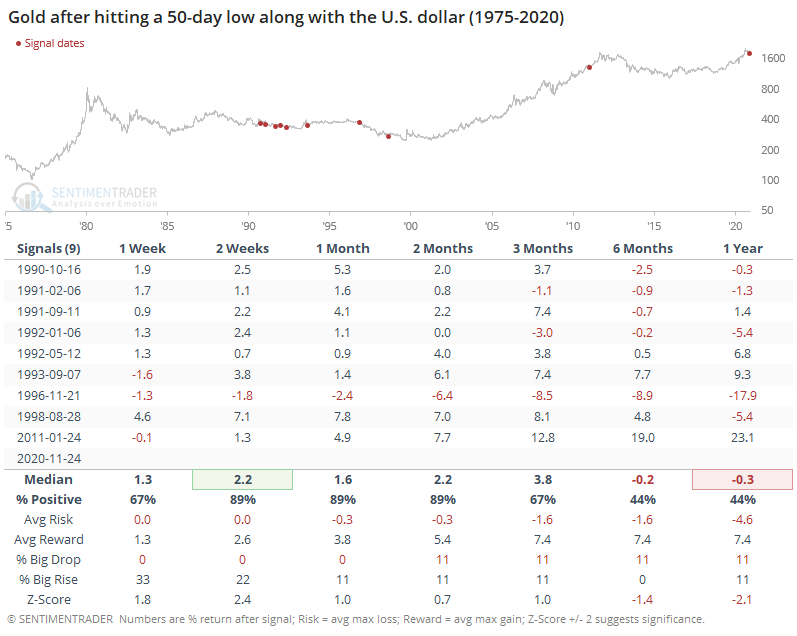
Gold has been falling even though the dollar has as well. Gold is supposed to rally when the dollar falls, suggesting that "something" is pushing gold lower that shouldn't be. When they've fallen together before, though, it wasn't necessarily a bad omen. While gold's 6-12 month returns were poor, it showed a positive return during the next 1-3 months after 8 out of the 9 precedents.
Whenever a trendy market like metals or currencies shows nascent signs of a shift in momentum, it can get scary for those positioned in the direction of the prevailing trend. When the shifts happen, they can be absolutely relentless. So far, we're not seeing too many compelling signs that this has triggered for gold. After witnessing the kind of momentum it has enjoyed since March, the first real pullback has mostly served as a temporary reset and not a change in trend. That has typically been especially beneficial to some of the stocks most closely tied to this market.

Sorry, this content is restricted to SentimenTrader members.

To read this post, please login to your account, sign up for our trading solutions or start a 30-day free trial.
LoginStart your 30-day free trial
DATA & TECH
IndicatorEdge
‍
BackTest Engine
‍
DataEdge API
REPORTS
Research Solution
‍
Reports Library
‍
Strategies
Index Trading Strategies
AI Stock Scanner
‍
PortfolioEdge
About us
Meet our Experts
‍
In the News
‍
Testimonials
Pricing
Bundle pricing
Subscribe to SentimenTrader's free newsletter
Get weekly highlights from our expert analysis, product updates, exclusive promotions, and invaluable educational content straight to your inbox. Sign up today and elevate your investing knowledge.
Thank you! Your submission has been received!
Oops! Something went wrong while submitting the form.
© 2023 Sundial Capital Research Inc. All rights reserved.
TermsPrivacy
Risk Disclosure: Futures and forex trading contains substantial risk and is not for every investor. An investor could potentially lose all or more than the initial investment. Risk capital is money that can be lost without jeopardizing ones’ financial security or life style. Only risk capital should be used for trading and only those with sufficient risk capital should consider trading. Past performance is not necessarily indicative of future results.

Hypothetical Performance Disclosure: Hypothetical performance results have many inherent limitations, some of which are described below. No representation is being made that any account will or is likely to achieve profits or losses similar to those shown; in fact, there are frequently sharp differences between hypothetical performance results and the actual results subsequently achieved by any particular trading program. One of the limitations of hypothetical performance results is that they are generally prepared with the benefit of hindsight. In addition, hypothetical trading does not involve financial risk, and no hypothetical trading record can completely account for the impact of financial risk of actual trading. for example, the ability to withstand losses or to adhere to a particular trading program in spite of trading losses are material points which can also adversely affect actual trading results. There are numerous other factors related to the markets in general or to the implementation of any specific trading program which cannot be fully accounted for in the preparation of hypothetical performance results and all which can adversely affect trading results.

Testimonial Disclosure: Testimonials appearing on this website may not be representative of other clients or customers and is not a guarantee of future performance or success.