Products
SentimenTrader Trading Tools
‍
Backtest Engine
My Trading Toolkit
Correlation Analysis
Seasonality
Market Prediction
Indicators & Data API
‍
Proprietary Indicators & Charts
Market Data API
Strategies & Scanner
‍
50+ Trading Strategies
Smart Stock Scanner
Smart Option Scanner
Research Reports
‍
Research Solutions
Reports Library
Free Resources
Simple Backtest Calculator
Simple Seasonality Calculator
The Kelly Criterion Calculator
Sentiment Geo Map
Public Research Reports
Education
Sentiment Indicators
Technical Indicators
Pricing
Company
About
In the News
Testimonials
Client Success Stories
Contact
Log inLoginSign up
< BACK TO ALL REPORTS

Fear Over Inflation Hasn't Been This High Since 1999

Jason Goepfert
2021-05-28
Over the past month, the VIX has been highly correlated with 10-year Treasury yields, suggesting inflation fears are driving volatility expectations.

Investors love to latch onto narratives. They're simple, make theoretical sense...and are often completely wrong.

Lately, the narrative has been that stocks have stalled because of fears over inflation. We saw on Wednesday that those fears are valid - when an investor is losing money on earnings after inflation, stocks have often tanked.

This happens to be one of those narratives that has some solid empirical evidence. Over the past month, about when stocks started to go into a holding pattern, the correlation in daily changes between the VIX "fear gauge" and the yield on 10-year Treasury notes skyrocketed to the highest level since 1999.

VIX and 10-year Treasury yield correlation interest rates

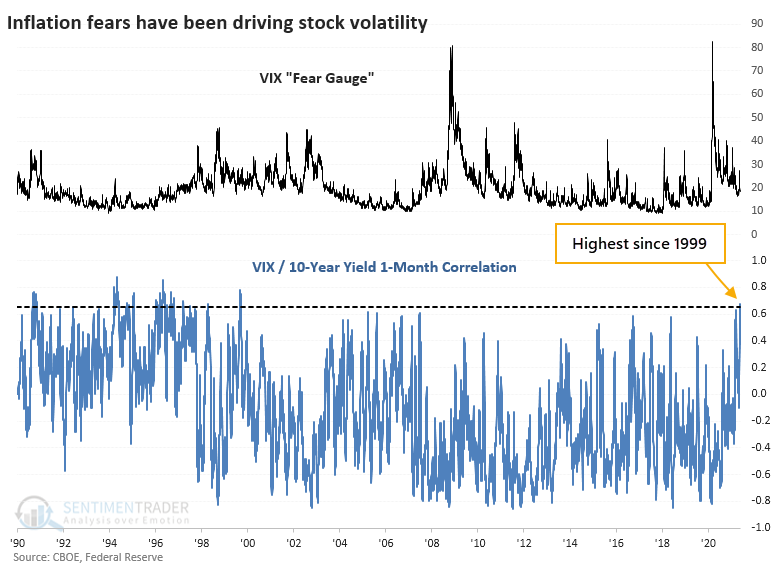
Yields drove investors' expectations for volatility throughout much of the 1990s. During that time, when the correlation got to as high a level as it's at now, the S&P showed weak short-term returns but good medium- to long-term ones.

Stat Box

Positive internal momentum has driven the McClellan Summation Index for the French CAC 40 index above +1,000. According to our Backtest Engine, this has happened 26 times in the past 20 years. Short-term future returns were weak, but 3 months later, the CAC was higher 69% of the time.


What else we're looking at

  • Full returns in the S&P 500 after high correlations between the VIX and yields
  • We also go back to the 1960s to search for similar behavior using a synthetic VIX indicator
  • These signals have been more consistent for gold than for stocks or bonds
  • Food prices are skyrocketing - what that means for stocks, sectors, and factors going forward
  • One commodity market, in particular, is setting up into June
PRODUCTS
SentimenTrader
Trading Tools
Indicators & Data API
‍
Strategies & Scanner
‍
Research Reports
FREE
RESOUrCES
Simple Backtest
Calculator
Simple Seasonality
Calculator
The Kelly Criterion
Calculator
Sentiment Geo Map
‍
Public Research Reports
‍
Education
Sentiment Indicators
‍
Technical Indicators
‍
Pricing
Bundle pricing
‍
FAQ
‍
Announcements
‍
COMPANY
‍
About
‍
In the News
‍
Testimonials
‍
Client Success Stories
CONTACT
‍
General Inquiries
‍
Media Inquiries
‍
Financial Professionals Inquiries
‍
© 2026 Sundial Capital Research Inc. All rights reserved.
Setsail Marketing
TermsPrivacyAffiliate Program
Risk Disclosure: The information and tools provided are for research and analytical purposes only and are not intended as investment advice. Market analysis involves uncertainty, and outcomes may differ from expectations. Users should conduct their own due diligence and consider their individual circumstances before making any financial decisions. Past performance is not necessarily indicative of future results.

Hypothetical Performance Disclosure: Hypothetical performance results have many inherent limitations, some of which are described below. No representation is being made that any account will or is likely to achieve profits or losses similar to those shown; in fact, there are frequently sharp differences between hypothetical performance results and the actual results subsequently achieved by any particular trading program. One of the limitations of hypothetical performance results is that they are generally prepared with the benefit of hindsight. In addition, hypothetical trading does not involve financial risk, and no hypothetical trading record can completely account for the impact of financial risk of actual trading. for example, the ability to withstand losses or to adhere to a particular trading program in spite of trading losses are material points which can also adversely affect actual trading results. There are numerous other factors related to the markets in general or to the implementation of any specific trading program which cannot be fully accounted for in the preparation of hypothetical performance results and all which can adversely affect trading results.

Testimonial Disclosure: Testimonials appearing on this website may not be representative of other clients or customers and is not a guarantee of future performance or success.