Excess upon excess as Dumb Money is smartest ever
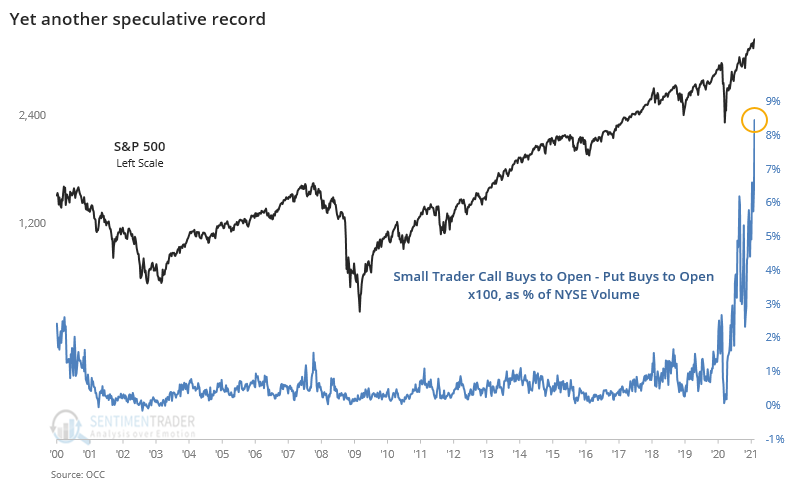
We hardly need more evidence of extremes. But some of these are so extraordinary, let's take a look anyway.
Options traders continue to get ever more aggressive. Even though this has been covered by mainstream financial media, it's still probably underplayed as a factor in the incessant rise since December. These trades have an outized impact on stock prices, and it only takes a pause in their activity to help trigger an unwind in underlying positions. As it climbs, it just piles and more snow upon a mountain that's ripe for an avalanche.
The smallest of options traders, those executing 10 or fewer contracts at a time, bought to open almost 25 million call contracts last week, versus only a little more than 6 million put options. Overall volume on the NYSE was down (more volume has been flowing into ultra-speculative penny stocks) so the net speculative purchases of these options traders spiked yet again to a new relative record.

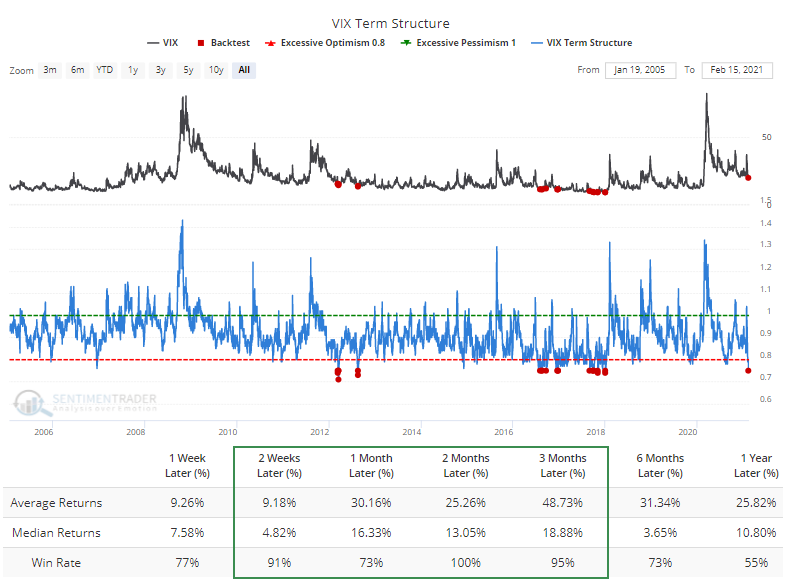
Most of this option activity is concentrated in the very near-term, with expirations within the next few weeks. This activity has helped in part to press the VIX "fear gauge" lower in the near-term, while longer-term expectations are still elevated. This has been a sign of extreme complacency in the past.
Every time the VIX Term Structure has been this low, the VIX spiked in the weeks ahead per the Backtest Engine.
All of this focus on call options has pushed volume in put options of all types (buying and selling, opening and closing transactions) relative to call options to the lowest level since 2000.
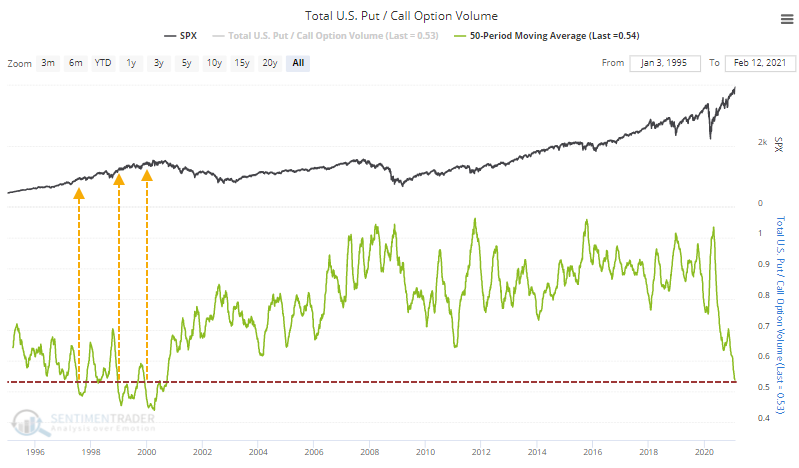
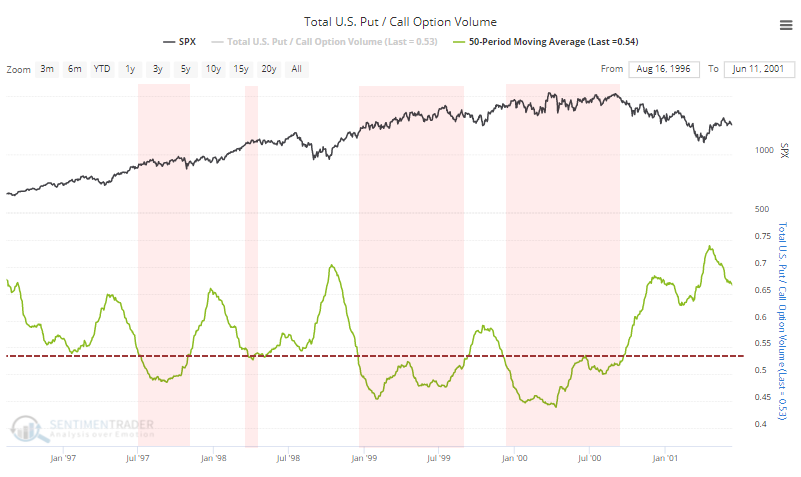
Zooming in on the dates when the ratio was as low as it is now, it wasn't an immediate sell signal, as we've discussed before. But the price behavior tended to be choppy, with gains eventually given back.
We don't often look at the positioning among Rydex mutual fund traders anymore since their asset base has dwindled in favor of ETFs, and some fund switching services have wreaked havoc on the day-to-day swings in assets in many of the funds.
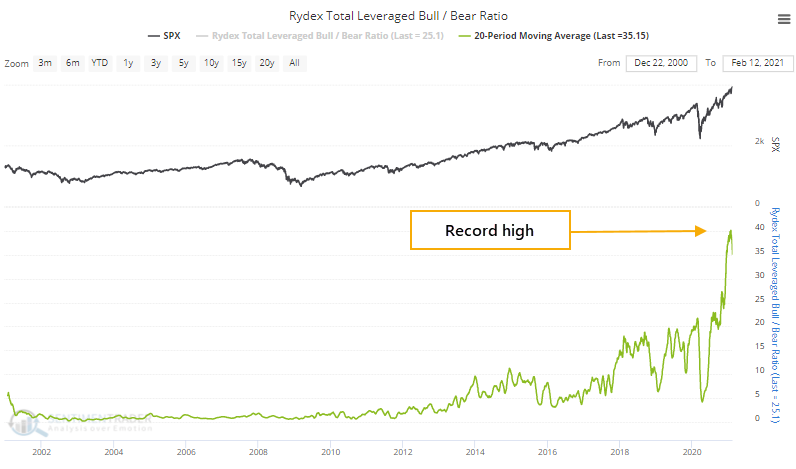
Using a moving average can help even out some of those swings, and when we look at a 20-day average of assets invested in leveraged bullish funds relative to leveraged inverse (bearish) funds, it's just now rolling over from a speculative record of more than $40 invested in a leveraged bull fund (!) for every $1 in a leveraged bear fund.
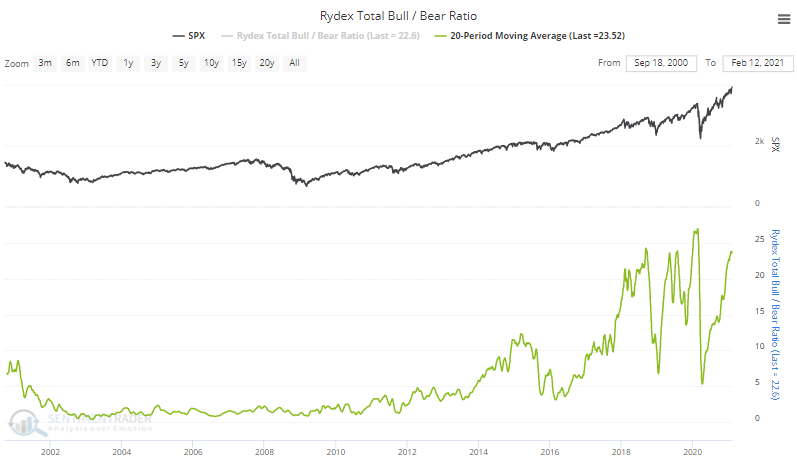
Including the plain vanilla funds that don't use leverage, the ratio of bull to bear assets is still near a record high.
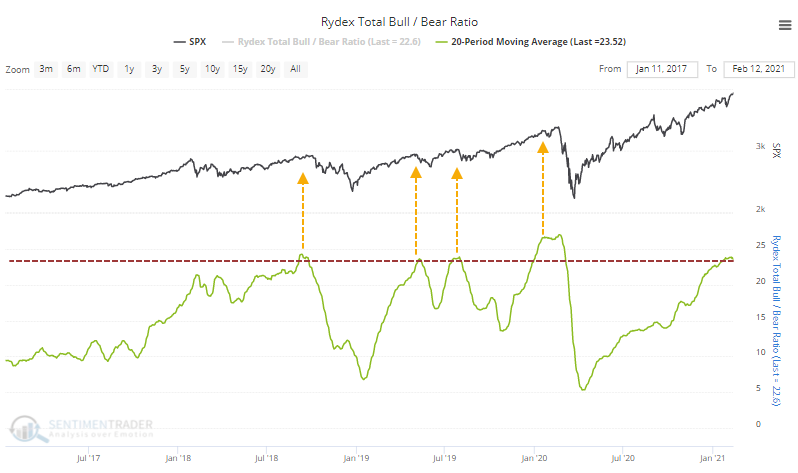
Zooming in on the recent extremes, they preceded rough stretches for stocks.
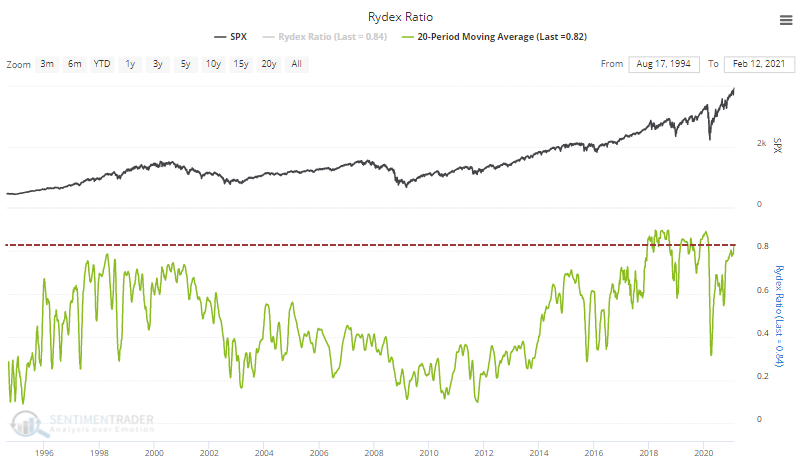
Using the more common Rydex Ratio of assets in the longest-standing S&P 500 and Nasdaq 100 funds, we can go back to 1994 and still see that the current positioning exceeds anything from 1999-2000.
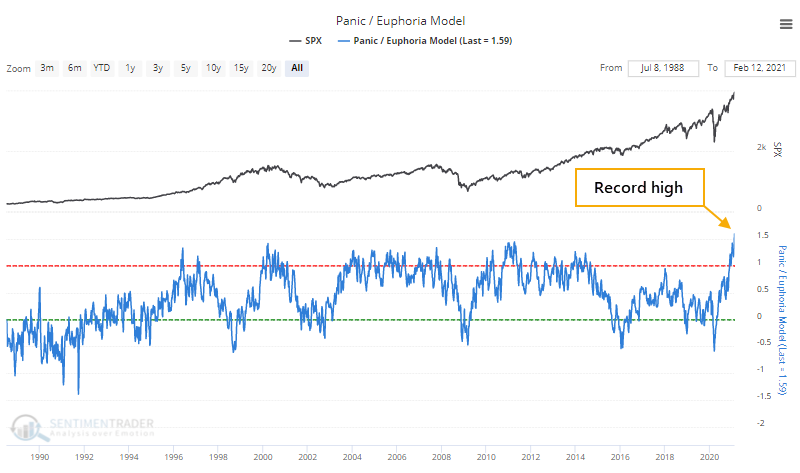
This kind of behavior has pushed the Panic / Euphoria Model above 1.5 for the first time ever. We saw a month ago what this kind of level has meant for forward returns, but we're already bucking those historical comparisons to a modest degree.
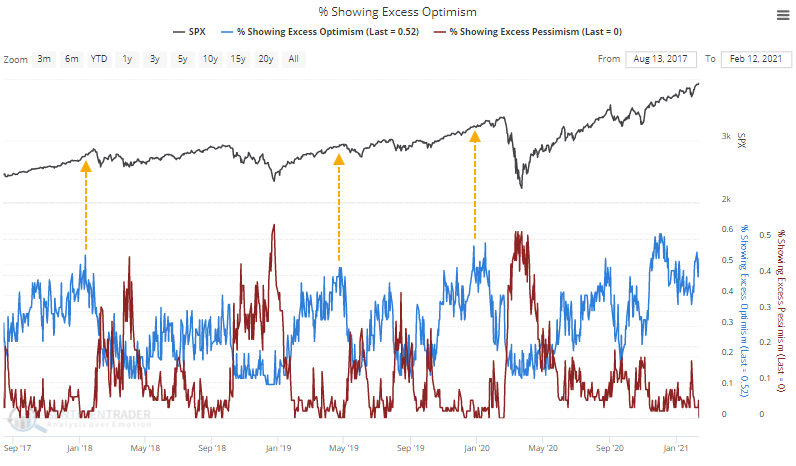
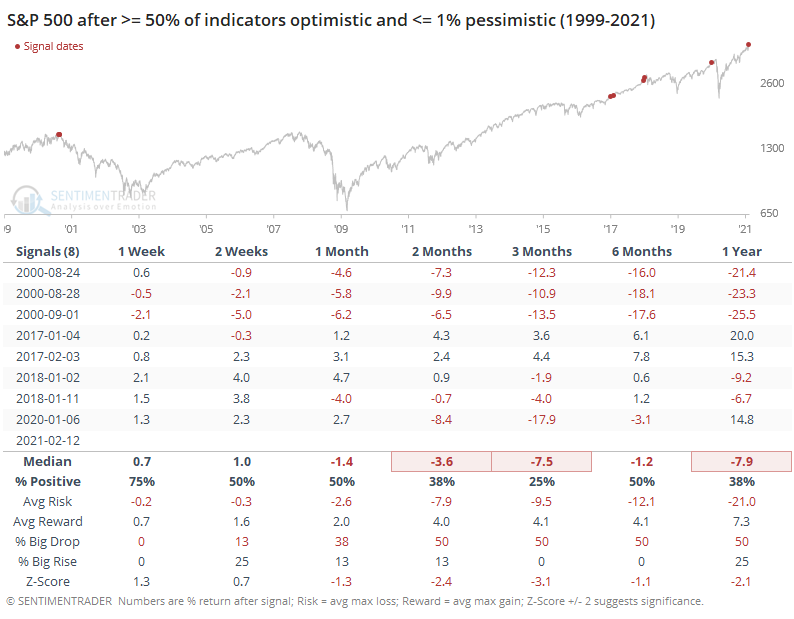
With so many indicators showing optimism, there are usually a couple of odd exceptions that suggest pessimism. It's rare for everything to agree at the same time. This is one of those rare times, though, with more than 50% of our core indicators showing an optimistic extreme and exactly 0% showing a pessimistic one.
This, too, has preceded some tough markets.
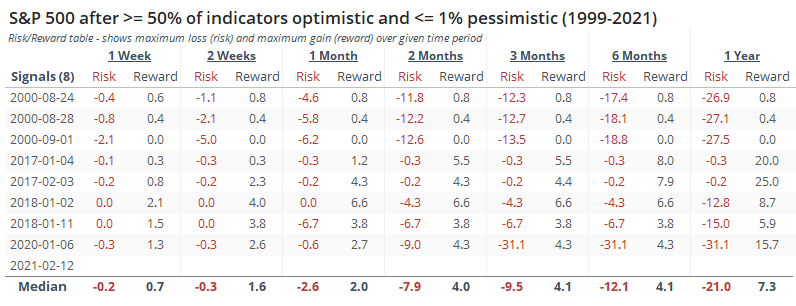
The Risk/Reward Table, which shows the biggest losses and largest gains at any point across the various time frames, shows limited upside relative to the downside, with 2017 really being the lone exception.
If all of this is getting a Chicken Little kind of a feel, there's a reason. The "dumb money" has been smart for months now. We looked at this concept last August, under similar circumstances. Options speculation was exploding, Dumb Money Confidence was excessively high, and yet markets kept going up.
We can quantify this failure of markets to respond as they should with a Brier Score calculation that's commonly used in other disciplines. A 3-month average of the Brier Score for Dumb Money Confidence shows that we just hit uncharted territory, meaning that the model has been failing to do what it usually does to a record degree.
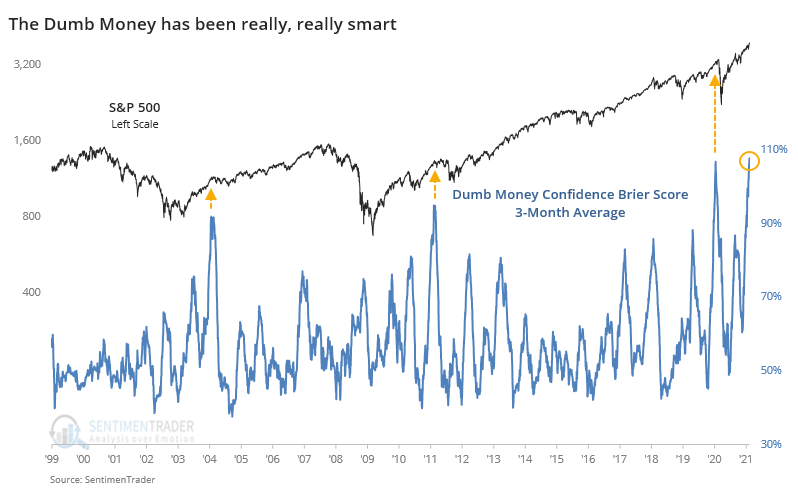
The only other time since we began calculating this model in 1999 that the dumb money had been so right for so long was mid-January 2020. The other high levels also led to a reckoning.
Maybe it's all permanently broken. Maybe the increasingly common refrain that "this time is different", "we're in a new regime," "it's a different paradigm," and "boomers just don't get his movement" will all prove correct. Maybe. But I've lived through this exact same feeling before, and the catcalls reached deafening levels before they were all silenced. If markets are efficient at one thing, it's making everyone look like fools at some point.
While there have been scattered days in the past month with odd internal metrics that showed some deterioration, overall there is still good support underneath the indexes. That doesn't mean stocks can't fall of their own weight - the internal picture was just as good a year ago before the hardest fall in history - but it does lessen the immediacy of some of the caution signs we see among euphoric sentiment readings.

