European stocks enjoy their best surge in years
Key points:
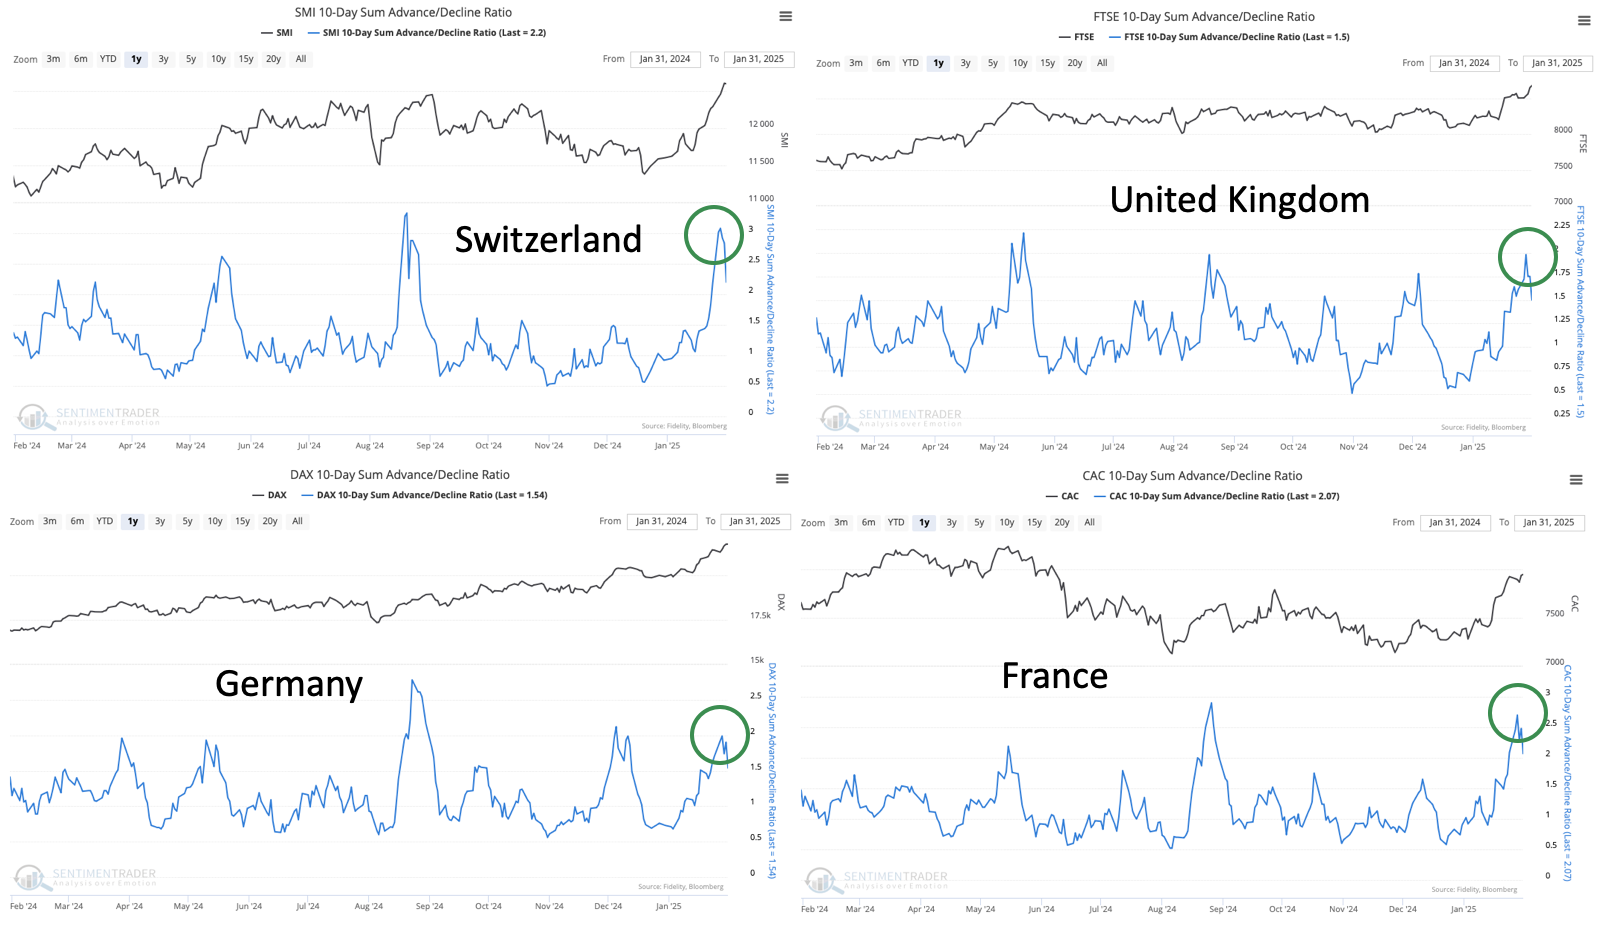
- Stocks across Switzerland, the UK, Germany, and France have surged in recent weeks
- Breadth metrics like the 10-day Advance/Decline Ratio and Members Above Their 50-day Average have spiked
- Similar behavior has preceded gains with consistency in Developed Europe over the next 1-3 months
A breadth surge in Europe
Just when fervor reached a fever pitch about "the U.S. stock market is the only place to be," it ceased to be so. In a surprisingly quiet way, many European markets handily beat U.S. markets to start the year.
Major European developed markets surged due to broad participation among stocks. One of the primary indexes that tracks these markets is the FTSE Developed Europe Index, which counts among its largest constituents the UK, Switzerland, France, and Germany. And stocks in those markets have done impressively well.
Across those four markets, the 10-day average number of advancing stocks has been twice the number of declining ones.

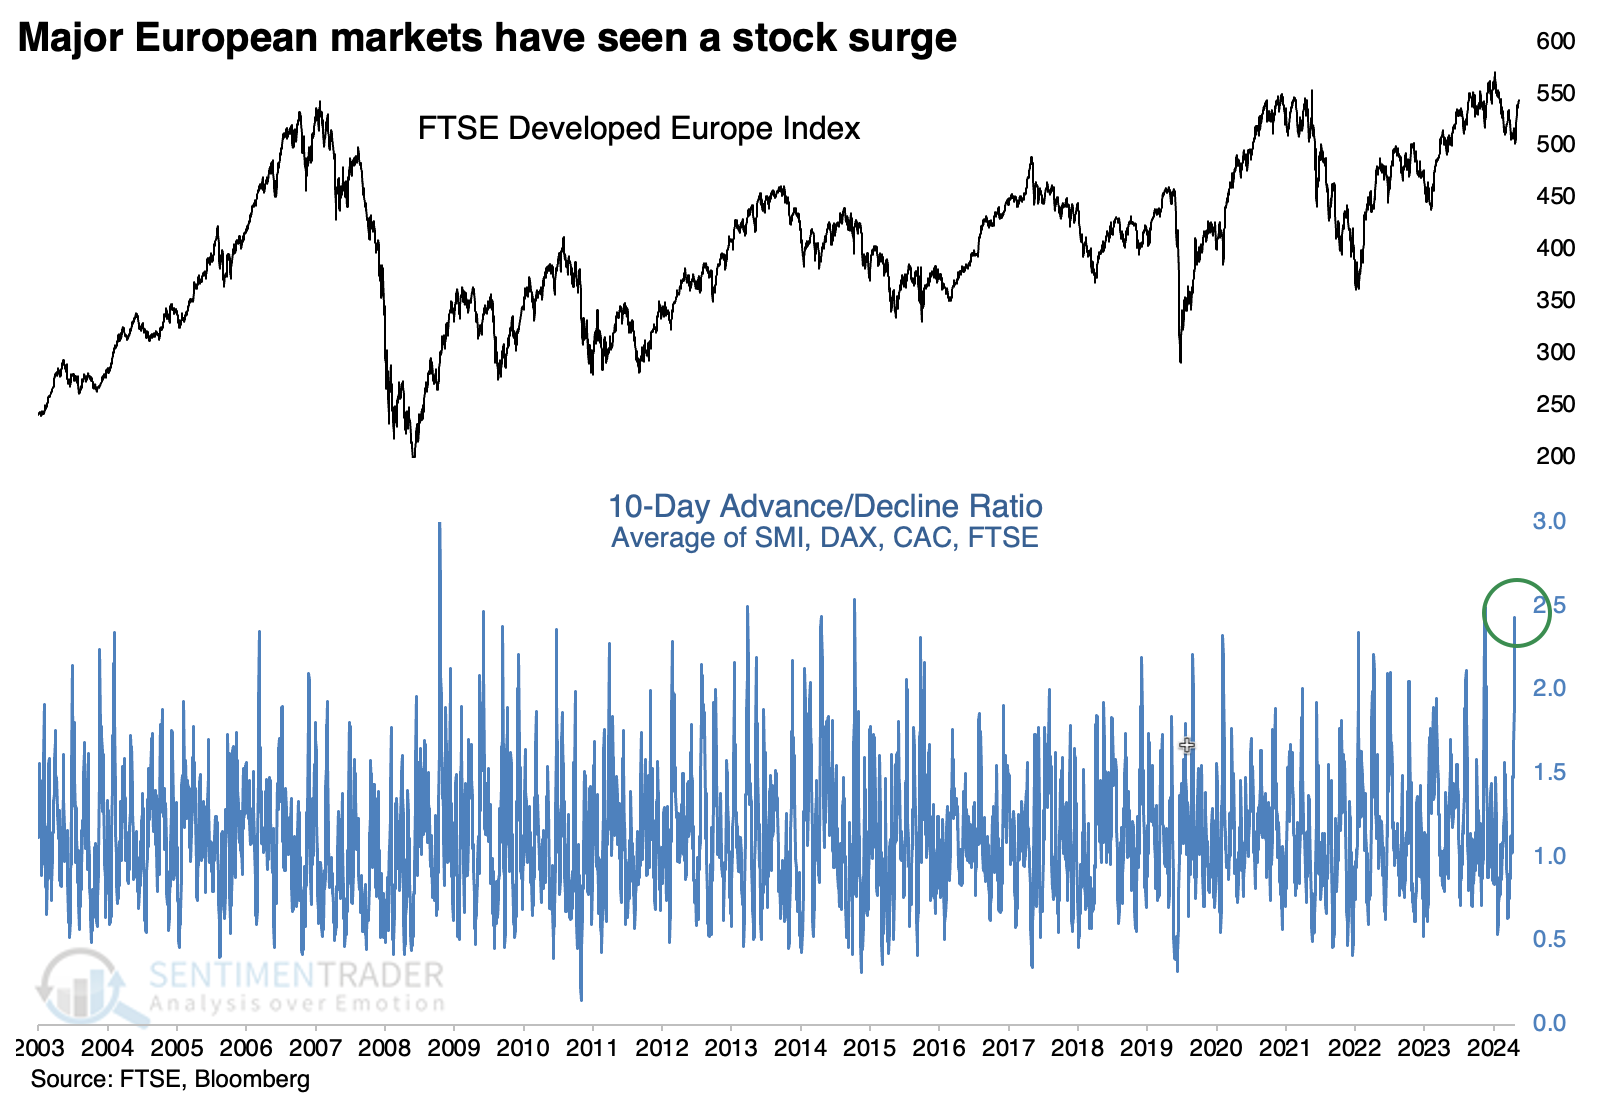
When we average the 10-day Advance/Decline Ratio across those four markets, we see below that it has nearly reached 2.5, one of the highest readings in over two decades.
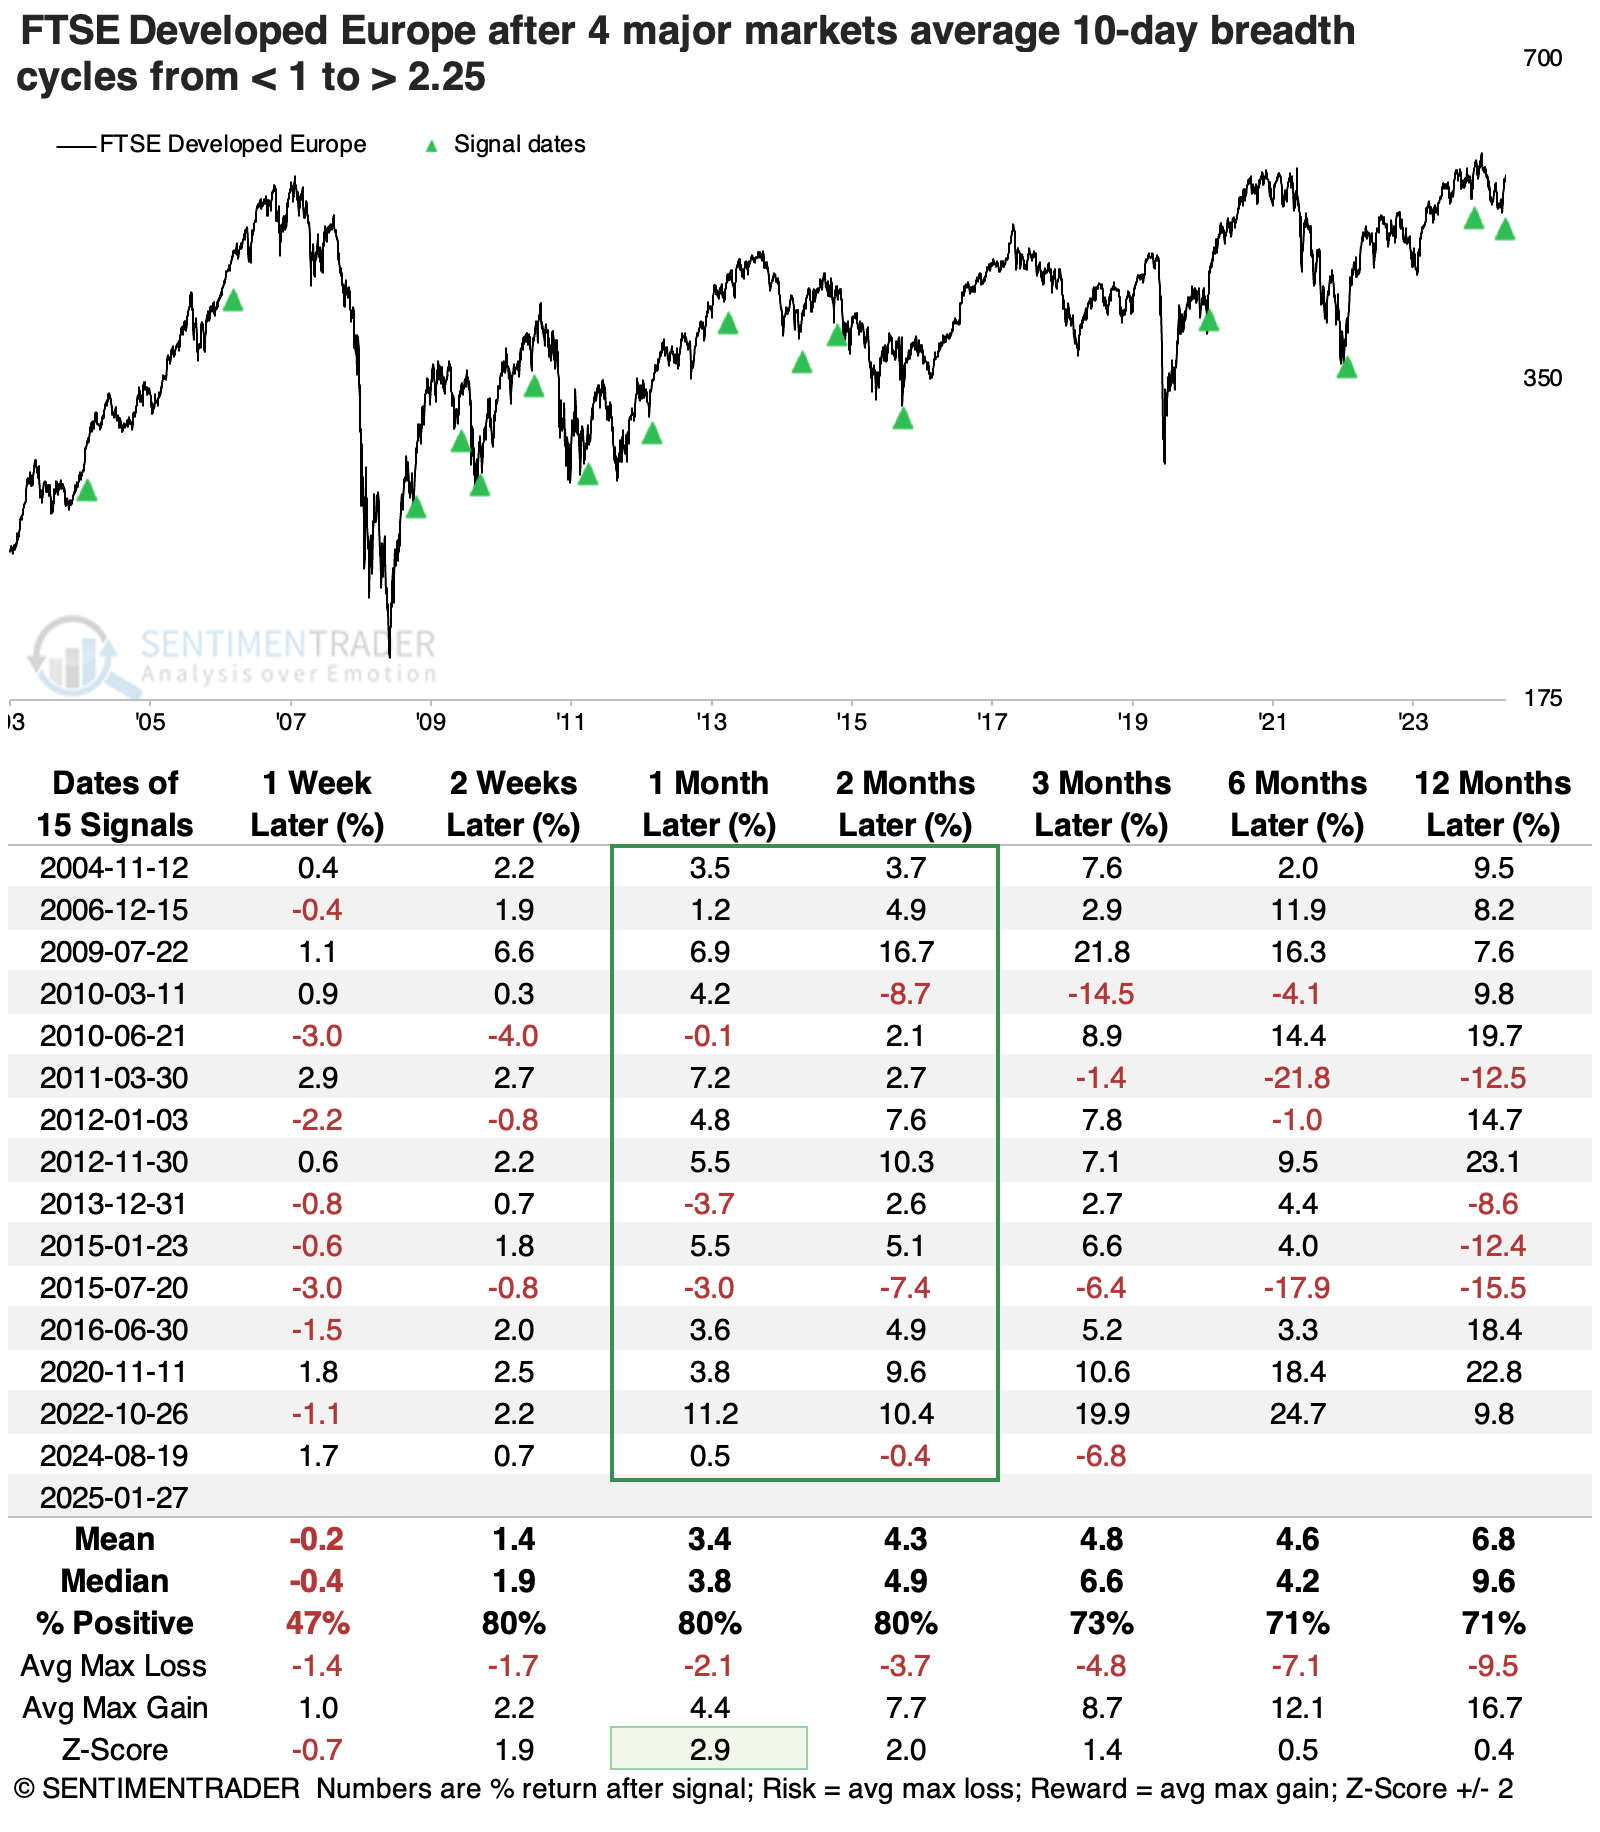
The table below shows returns in the FTSE Developed Europe Index after the 10-day A/D Ratio cycles from below 1.0 to more than 2.25. While the index is trading at the same level it was at 18 years ago, it did tend to perform well in the one to two months following these breadth surges. Out of 15 signals, 14 sported a positive return one or two months later - however, several failed longer-term.
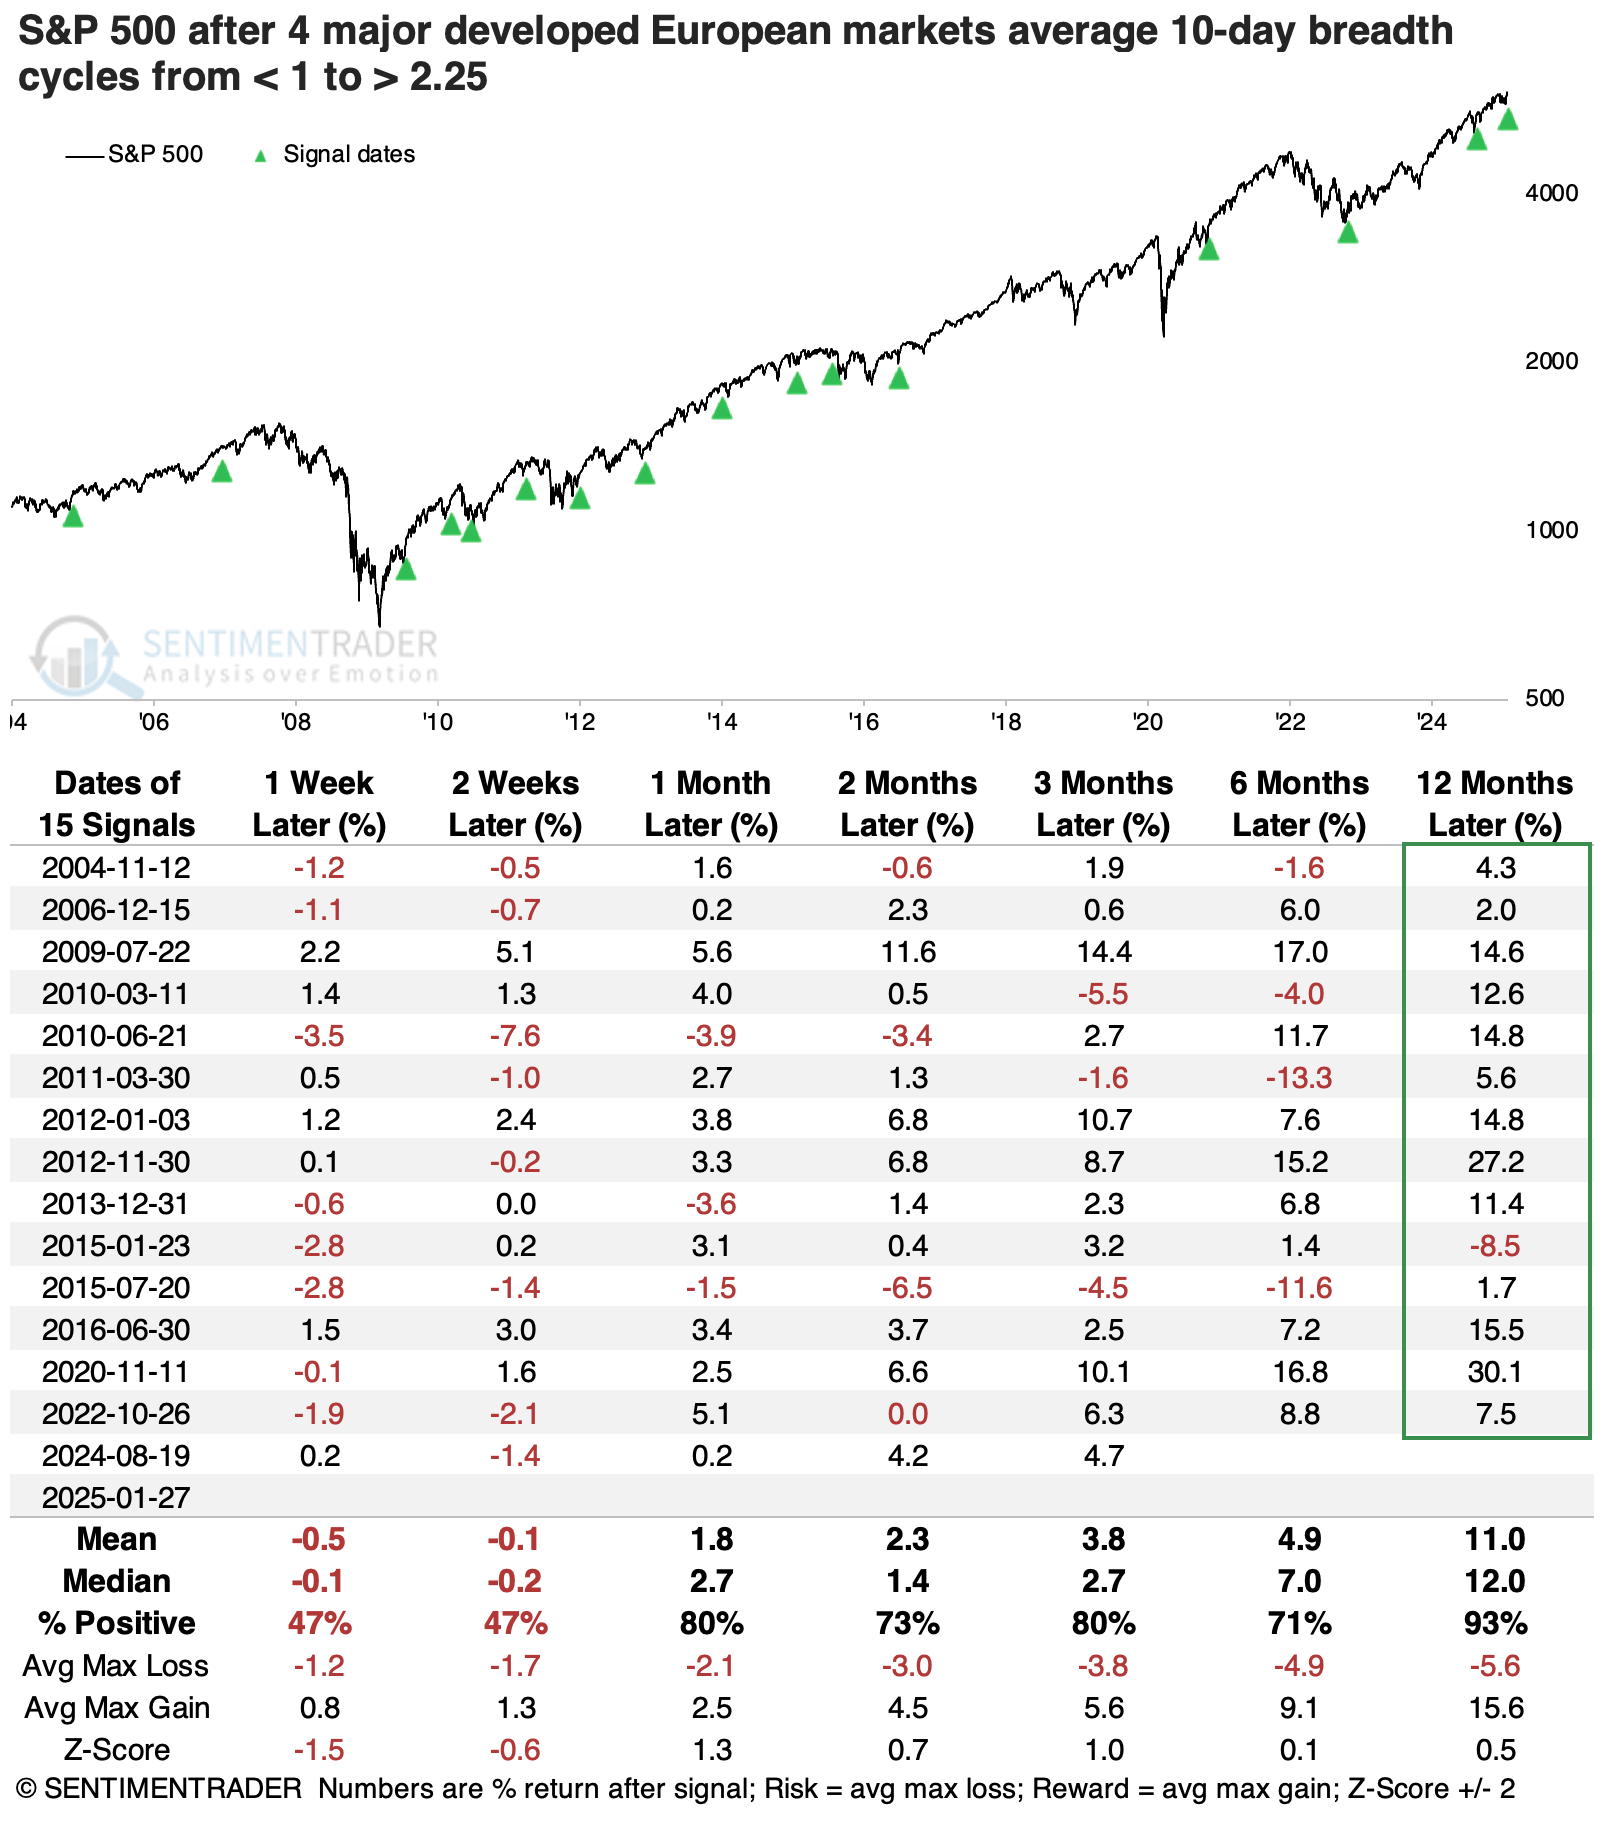
In a nod to how dominant U.S. markets have been over the past 15 years, these thrusts in European stocks were an even better sign for the S&P 500 over longer time frames.
More medium-term uptrends
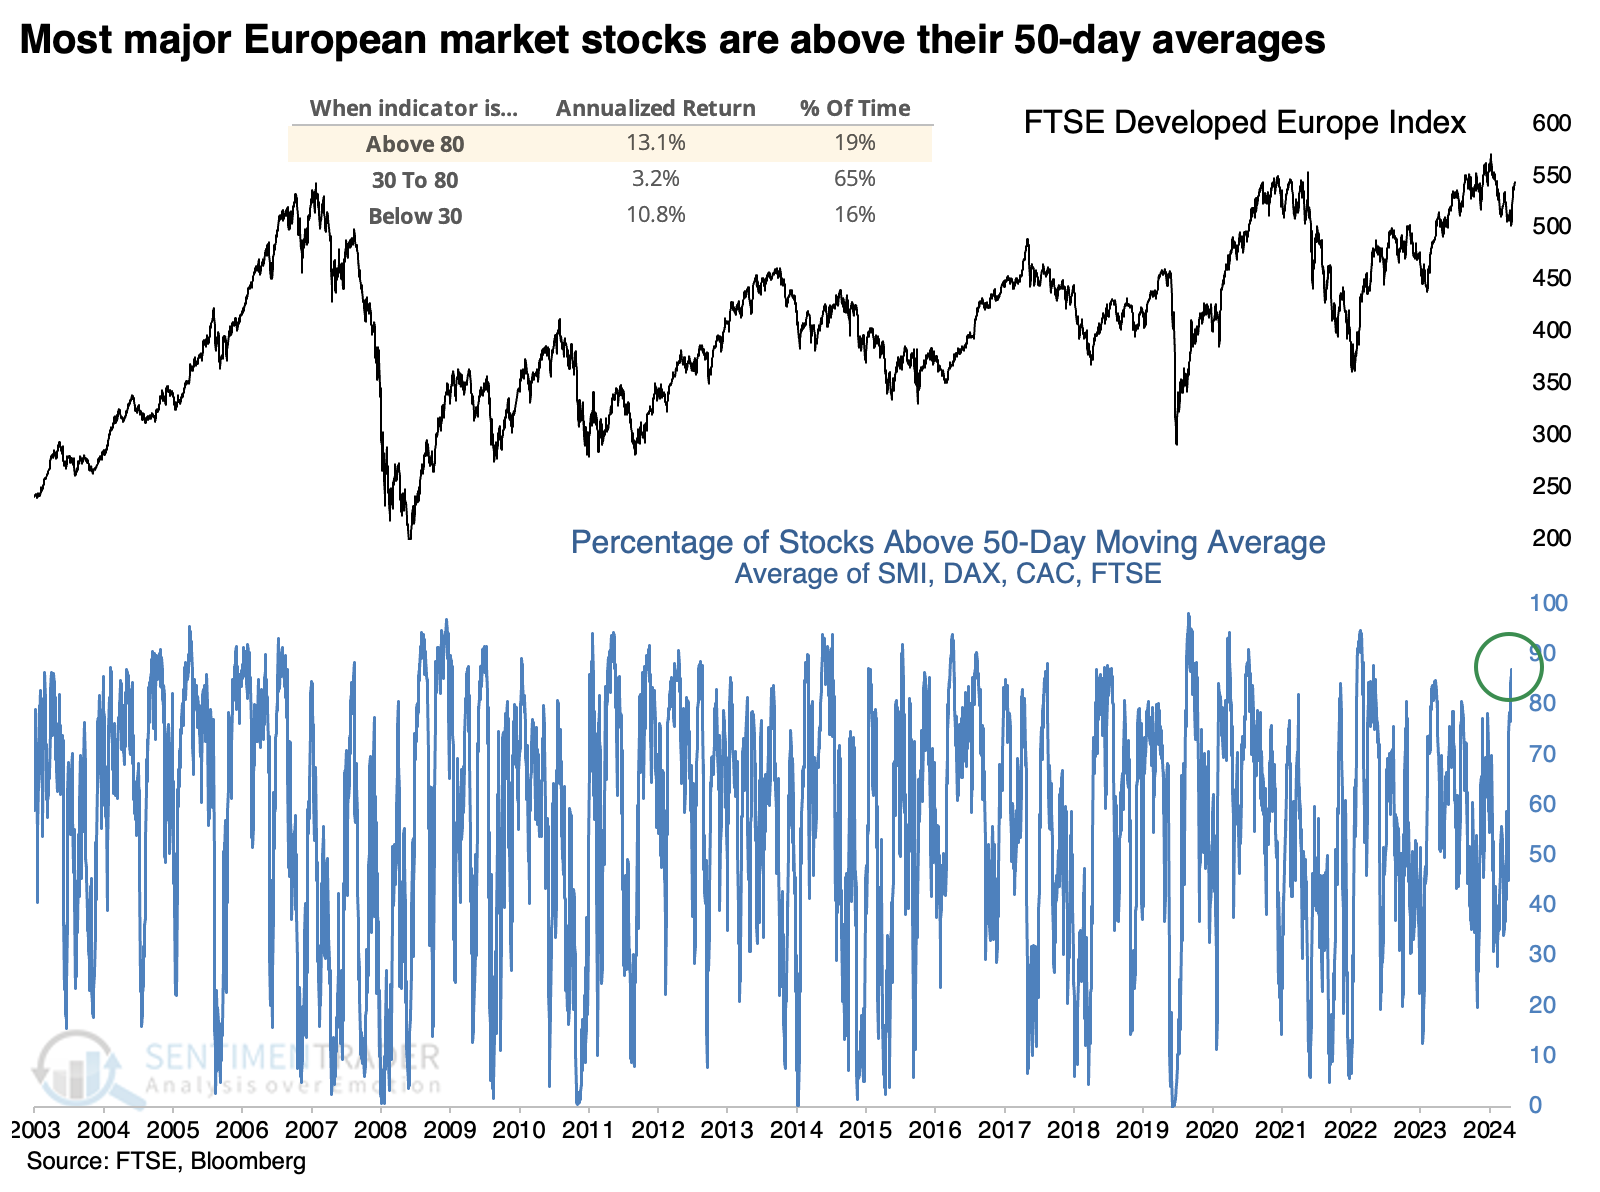
The short-term surge in stocks participating in the rally has pushed most of them above their medium-term trendlines. For the first time in years, more than 85% of stocks across the SMI, FTSE, DAX, and CAC are trading above their 50-day moving averages.
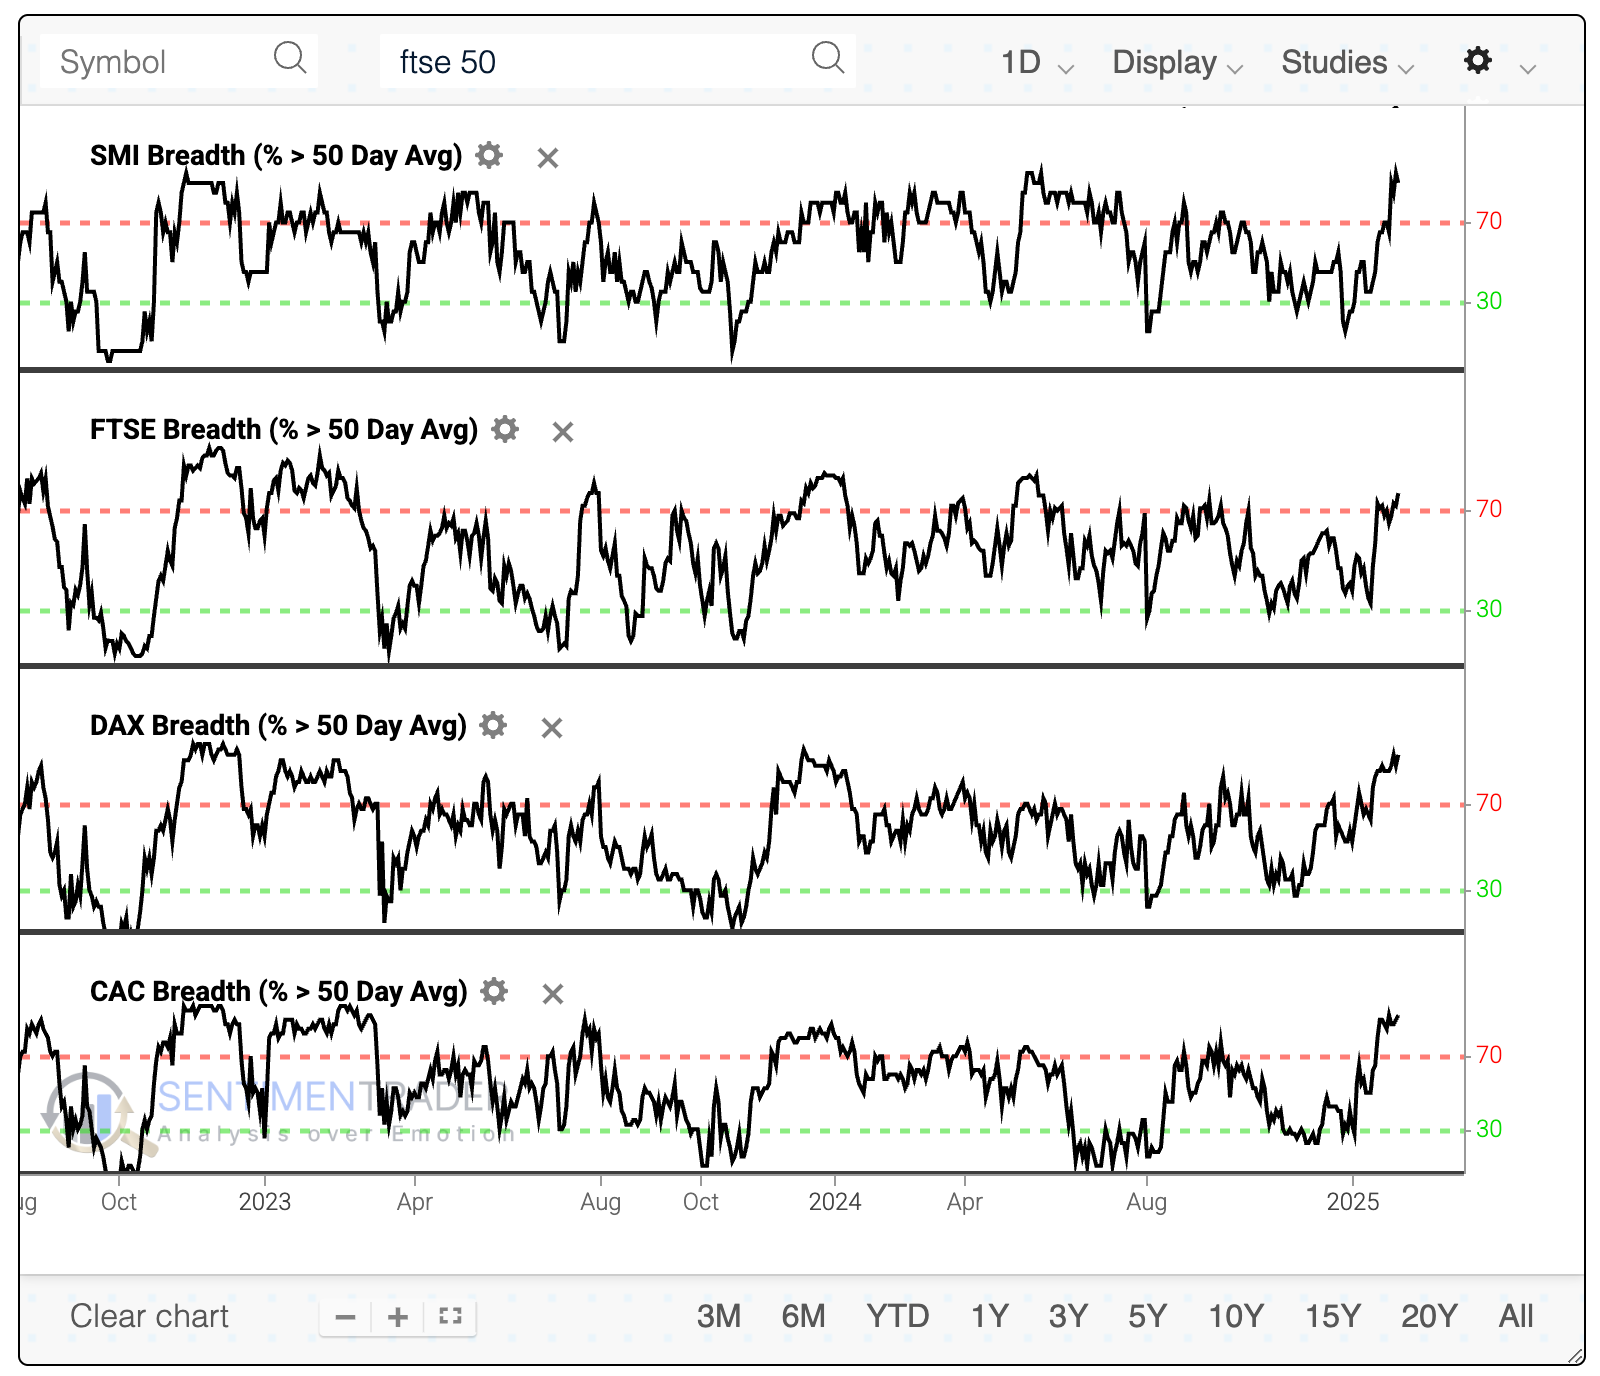
With an average of 87% of stocks above their moving average, the current reading is in the top 7% of all days since 2003. The chart below shows that European stocks have shown the best annualized return at the extremes - when there are either oversold conditions or highly positive internal momentum. They tend to suffer in the mushy middle.
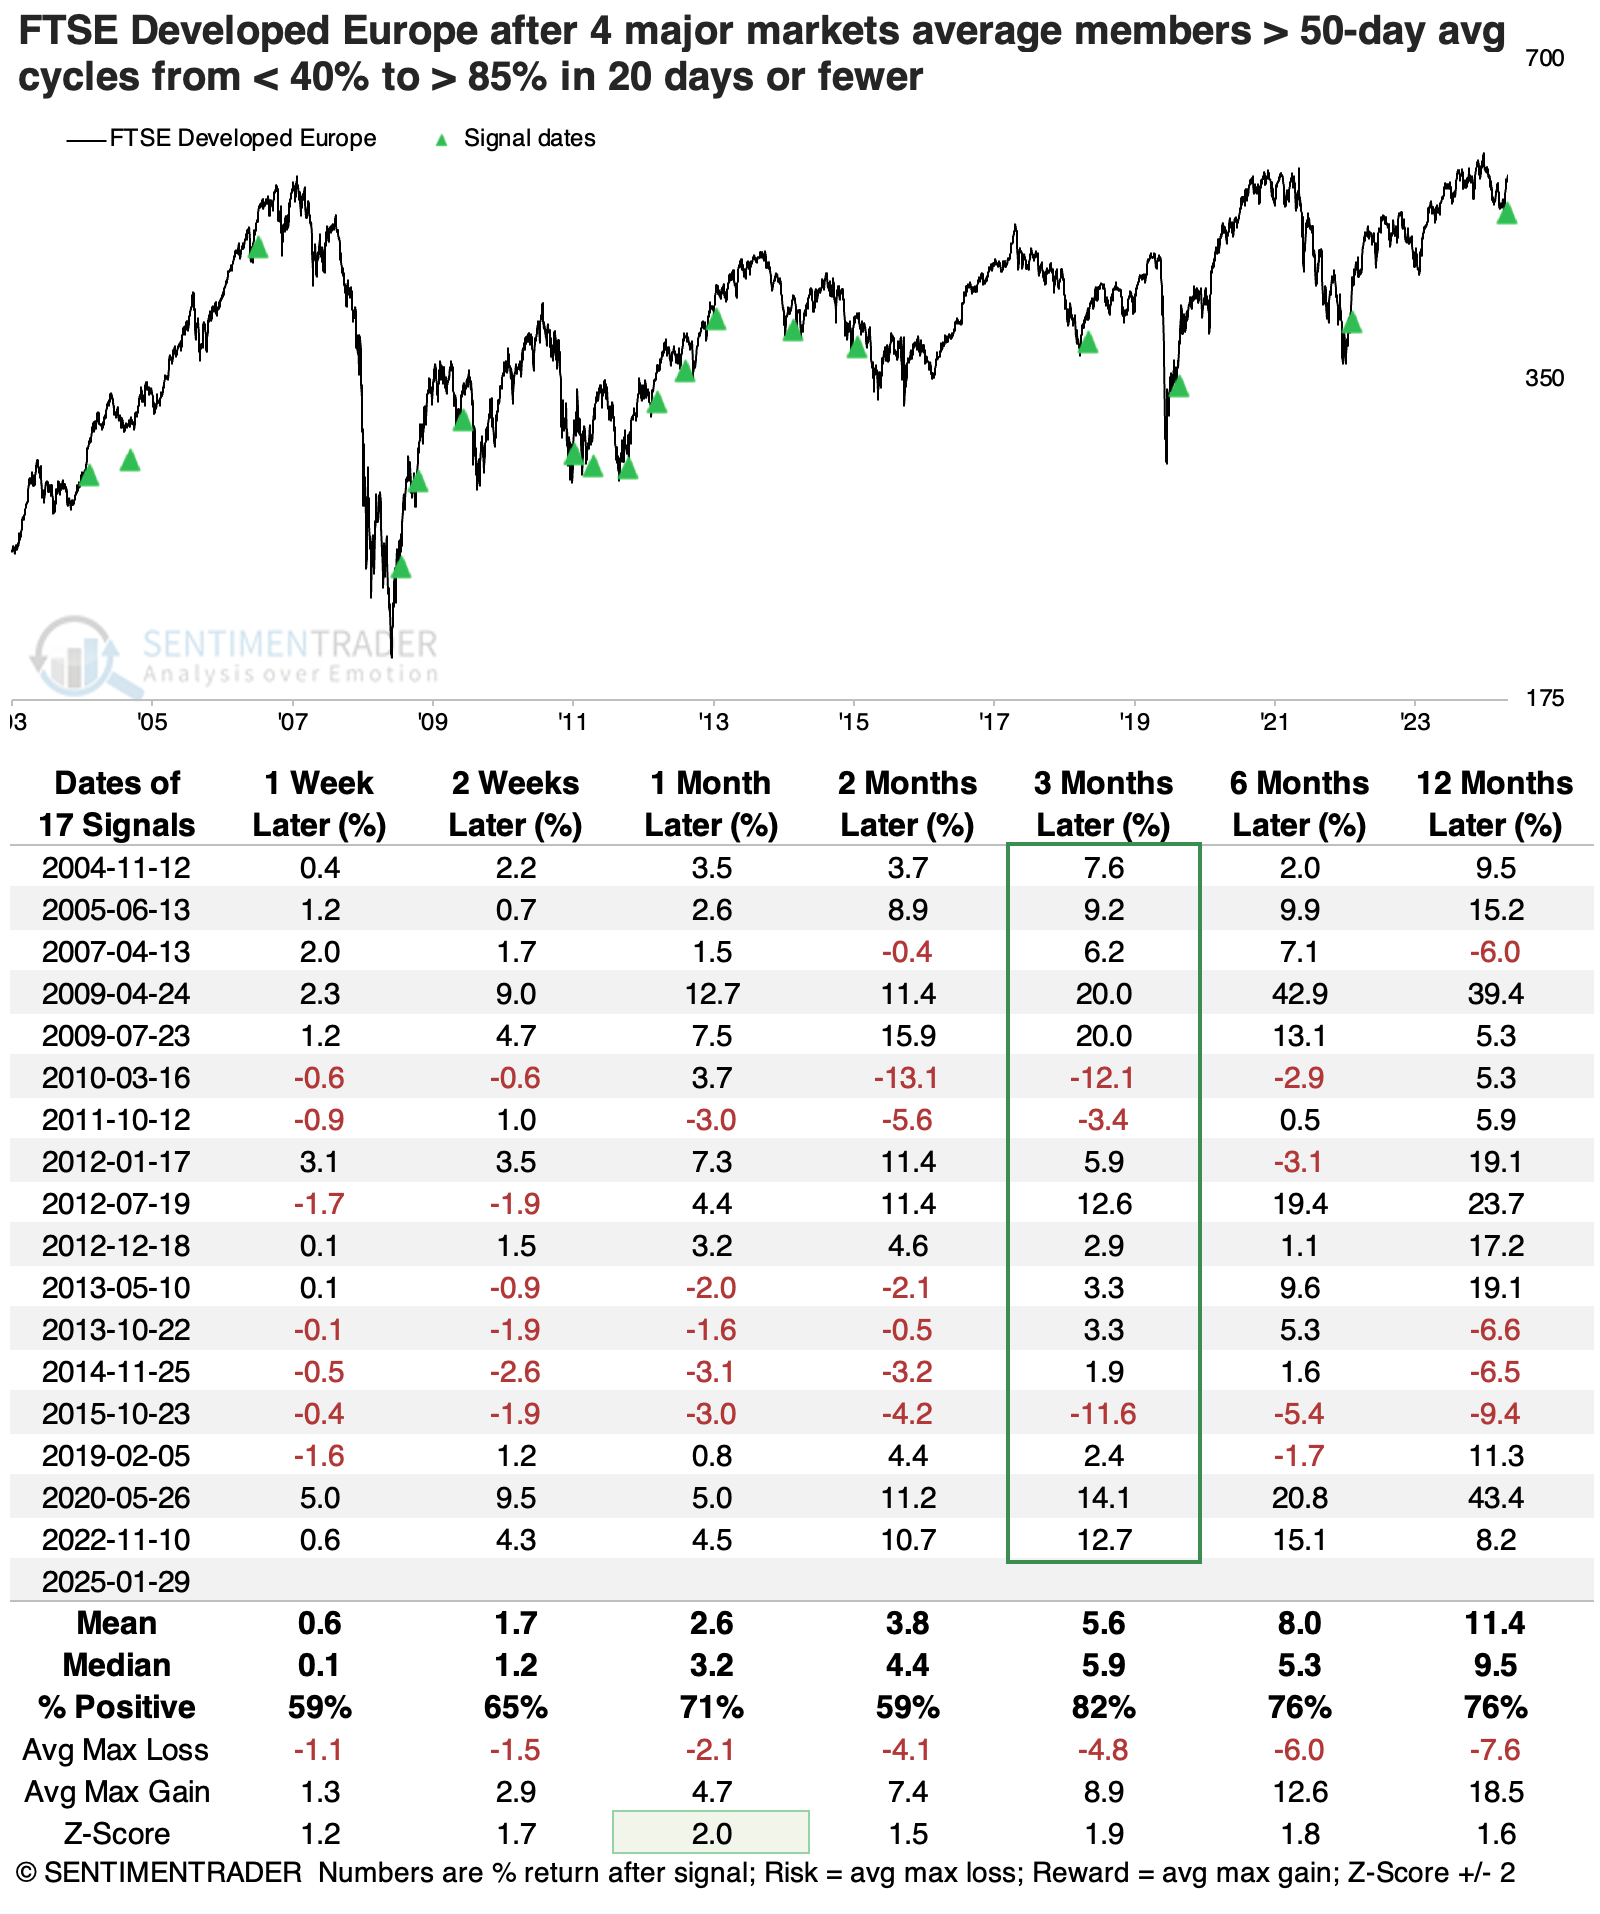
The table below shows returns in the FTSE Developed Europe Index after the average percentage of members trading above their 50-day average cycles from below 40% to above 85%. For context, the table is filtered to show the fastest surges that took a month or less to occur.
Again, the index's most consistent response was in the intermediate timeframe, with the next three months showing the best results. It's perhaps notable that there were only three losses over that time frame, and each saw an immediate loss in the week following the signals. Something to watch for in the coming days.
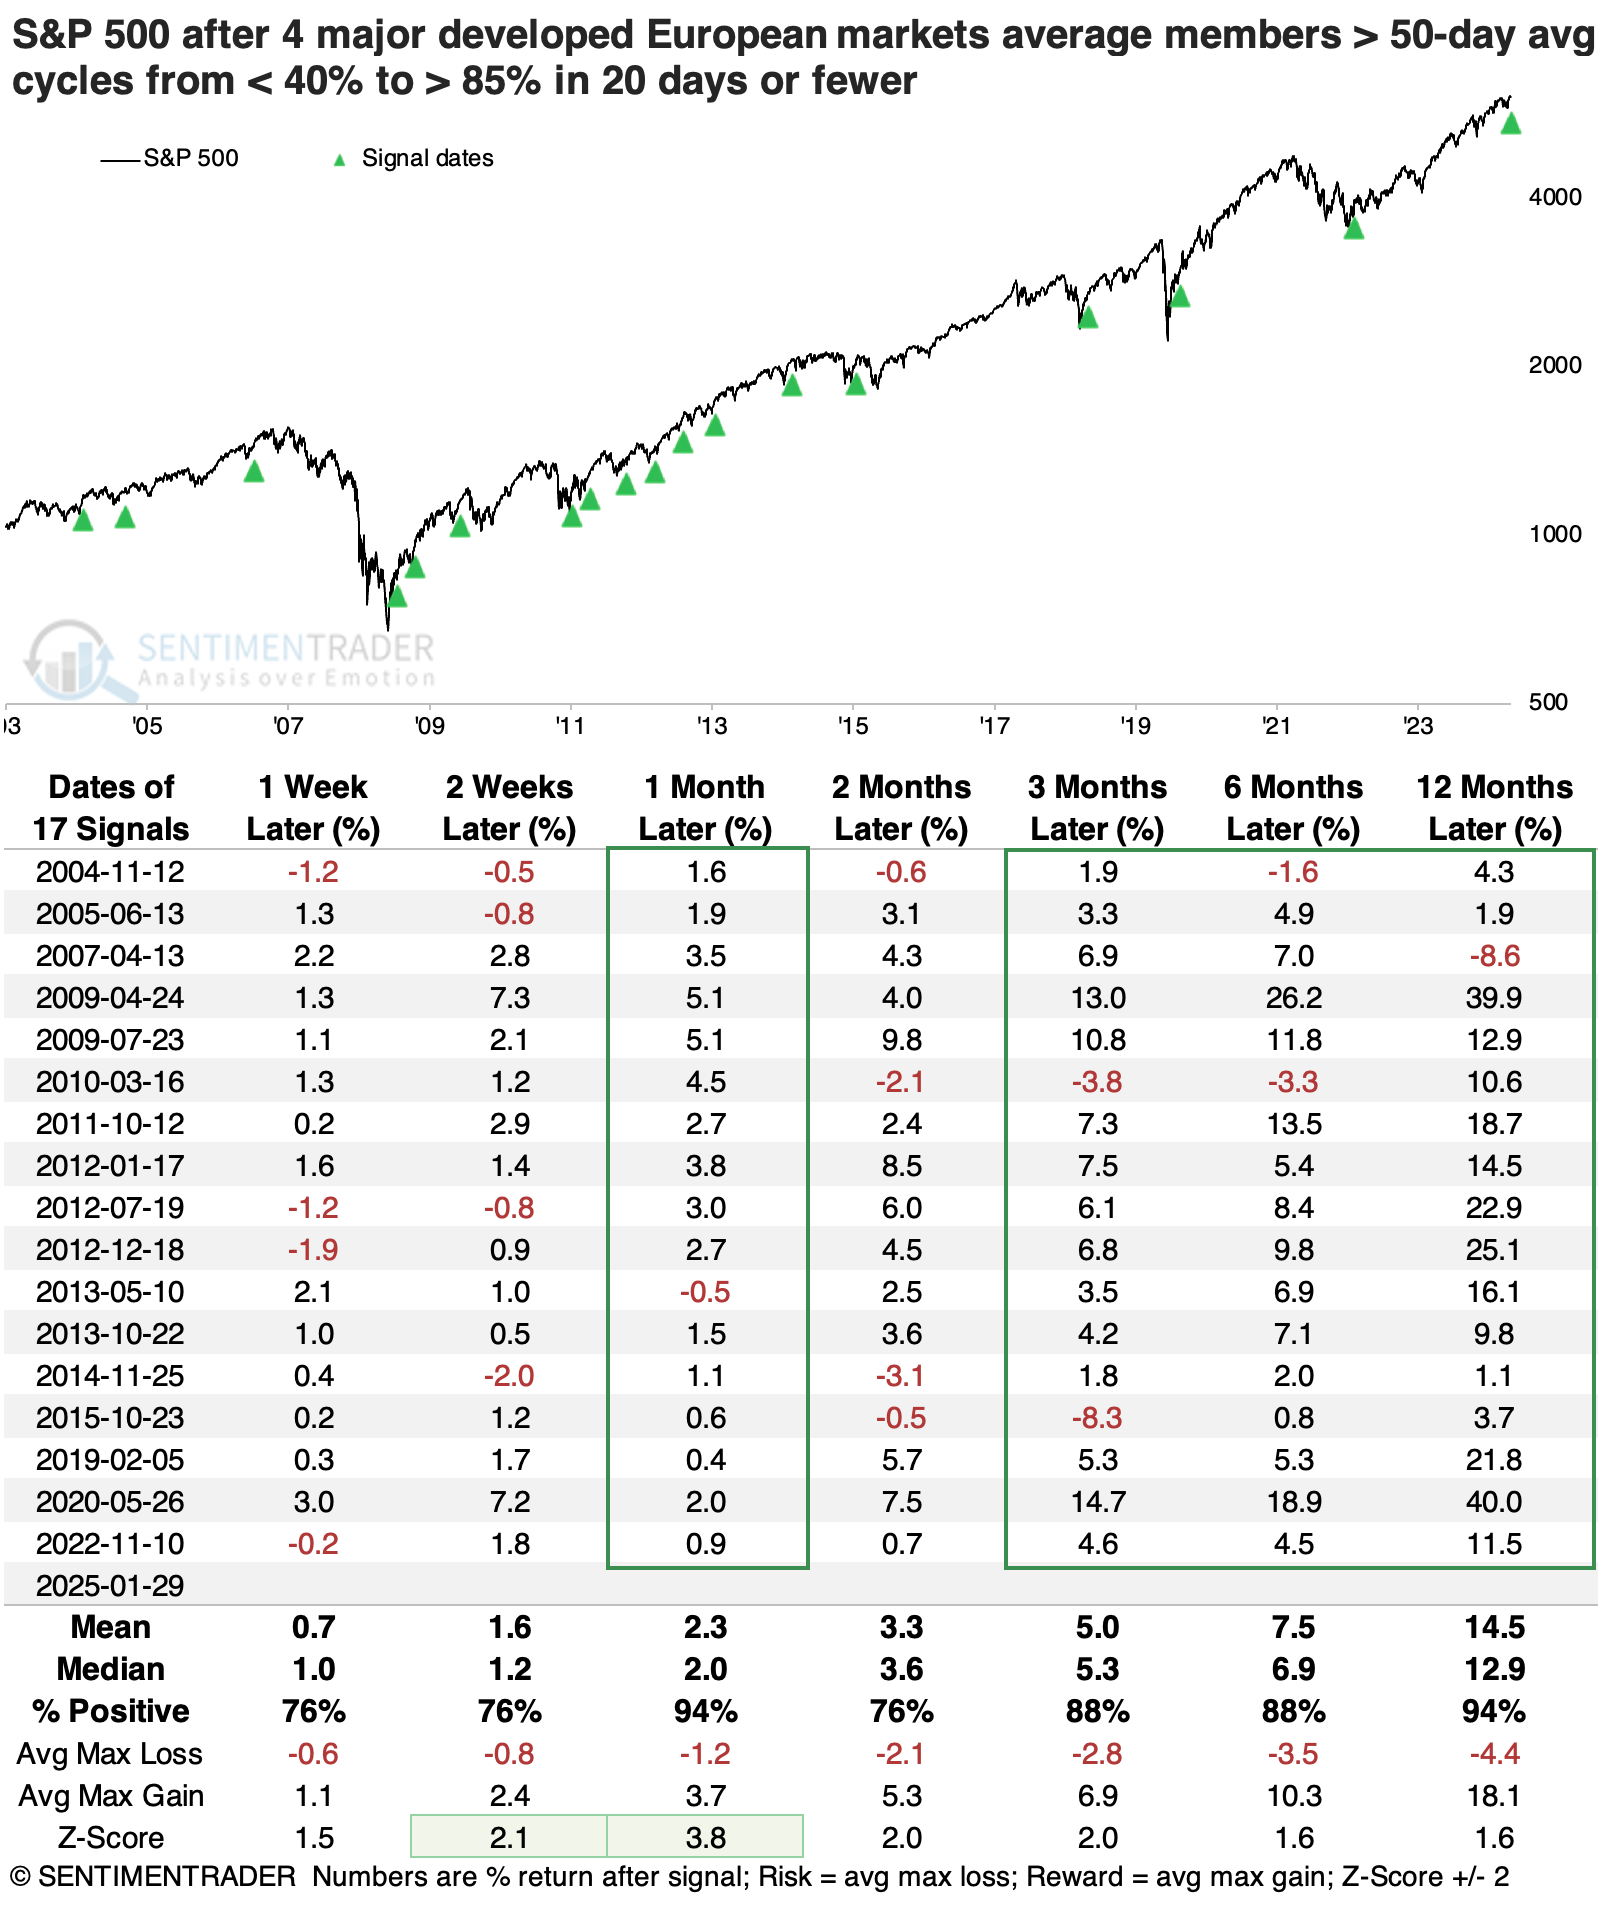
Once again, the S&P 500 proved to be an even better bet after these European stocks had done so well. A month later, the S&P sported only one loss, which was *just barely* and was immediately reversed. Its medium- to long-term returns were exceptional.
What the research tells us...
Over the years, we've seen that when buyers are interested in stocks across industries, sectors, and countries, it bodes well for everyone. The S&P 500 has been a dominant index for a long time, and it has tended to show the best returns when investors are broadly and globally interested in stocks.
At some point, it stands to reason that other markets will take up the mantle of a dominant market, but there is little sign of that yet. The year started well for overseas indices, particularly in Europe, and that was a good sign for them over the following 1-3 months. Beyond that, they have not shown a consistent ability to outshine the S&P 500, even after a remarkable surge in participation like they've enjoyed in recent weeks. If buyers show they can shrug off tariff news and short-term overbought conditions, it will bode even better for these markets.

