Data &
Technology
Research
Reports
Report Solutions
Reports Library
Actionable
Strategies
Free
Resources
Simple Backtest Calculator
Simple Seasonality Calculator
The Kelly Criterion Calculator
Sentiment Geo Map
Public Research Reports
Free Webinar
Pricing
Company
About
Meet Our Team
In the News
Testimonials
Client Success Stories
Contact
Log inLoginSign up
< BACK TO ALL REPORTS

Energy Stocks Have Suffered Like This Only a Few Times in 70 Years

Jason Goepfert
2021-08-06
For three straight weeks, every energy sector stock has been trading below its 50-day moving average, the longest stretch in years.

Energy stocks enjoyed a historic thrust off their low, following a complete give-up among investors.

For the past few weeks, they've been stuck in neutral. While many are still holding above their long-term trends, none of them have managed to close above their medium-term 50-day moving averages for three straight weeks. 

xle energy stock members above 50 day moving average

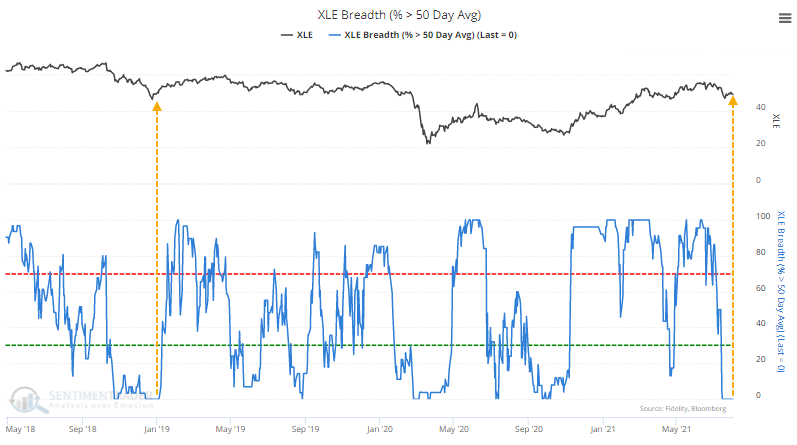
This is the longest stretch since the end of 2018. Over 70 years, this is now tied for the 4th-longest streak without a single stock in a medium-term uptrend.

Energy stocks suffered a similar bout of medium-term failure at the end of 2018, but before that, there were only three other comparable stretches since 1952.

The other four saw the sector rally over the next couple of weeks, but then it faltered a couple of times. The 2001 occurrence was the only one that ended up leading to a protracted downtrend, though the 2019 signal did eventually lead to the pandemic crash.


What else we're looking at

  • Full returns in Energy stocks following prolonged stretches with no members above their 50-day averages
  • What happened after shorter stretches within uptrends
  • It's time to pay attention to the ratio of the Price/Earnings Ratio to the VIX
  • Looking at a buy signal using Average True Range

Stat box

Thursday's new high in the S&P 500 was its 43rd of the year, the most in a calendar year since 2017. Since 1928, this is the 3rd-quickest year to record so many all-time highs, behind only 1964 and 1995.

Etcetera

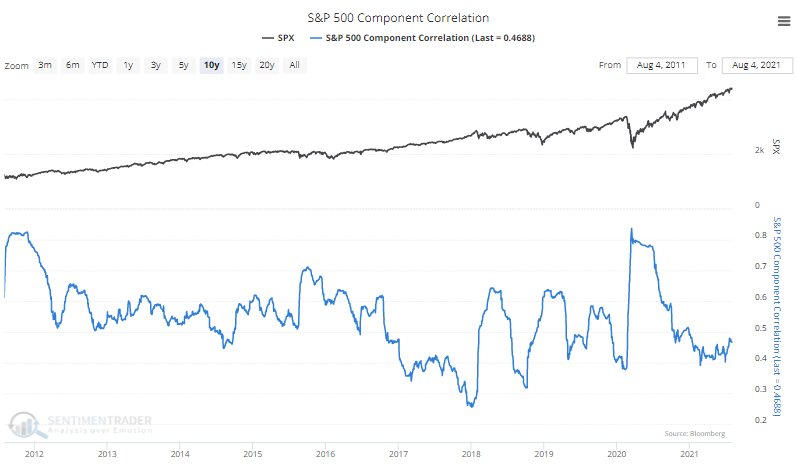
On their own. When investors panic, they buy and sell everything together. When they're complacent, they trade securities on their own merits. The current low correlation among S&P 500 stocks suggests investors are feeling pretty comfortable.

correlation among s&p 500 stocks

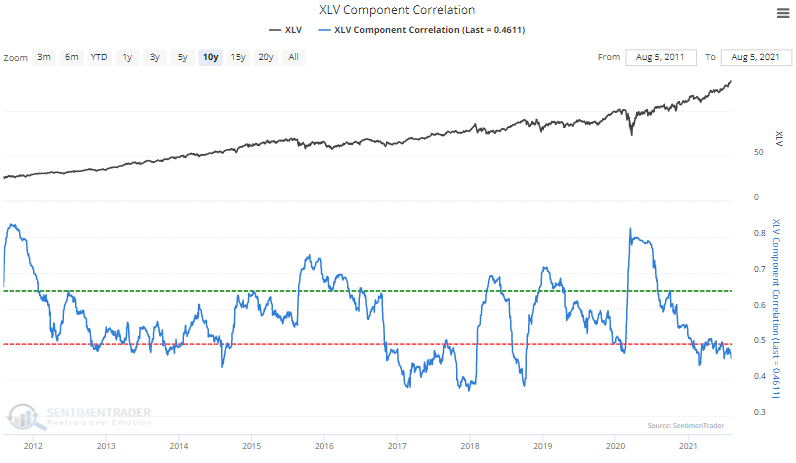
Healthy complacency? Among sectors, the lowest relative correlation among member stocks is in Health Care. After moving together during the pandemic, those stocks are moving on their own to one of the largest degrees of the past decade.

xlv health care member correlation

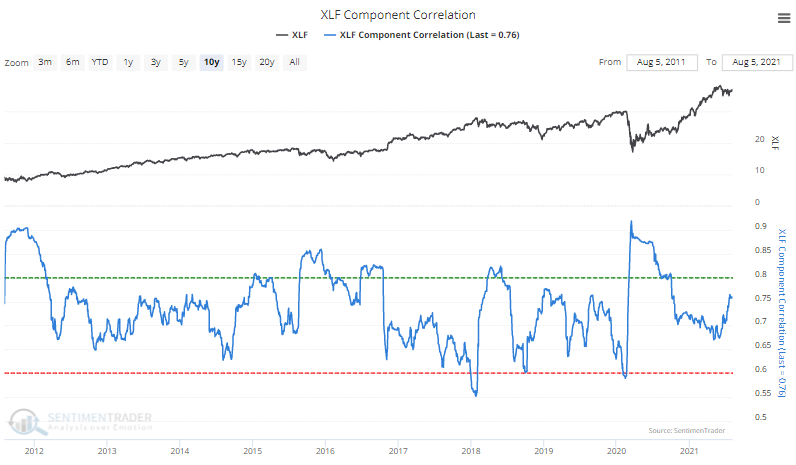
Financial fear. At the other end of the spectrum, correlations suggest there is still some concern among Financial stocks. There is a 0.75 correlation between stocks in that sector, on the upper end of the range for the past decade.

xlf financial stocks member correlation

DATA &
TECHnologies
IndicatorEdge
‍
BackTestEdge
‍
Other Tools
‍
DataEdge API
RESEARCH
reports
Research Solution
‍
Reports Library
‍
actionable
Strategies
Trading Strategies
‍
Smart Stock Scanner
‍
FREE
RESOUrCES
Simple Backtest
Calculator
Simple Seasonality
Calculator
The Kelly Criterion
Calculator
Sentiment Geo Map
‍
Public Research Reports
‍
Free Webinar
COMPANY
‍
About
‍
Meet our Team
‍
In the News
‍
Testimonials
‍
Client Success Stories
Pricing
Bundle pricing
‍
Announcements
‍
FAQ
© 2024 Sundial Capital Research Inc. All rights reserved.
Setsail Marketing
TermsPrivacyAffiliate Program
Risk Disclosure: Futures and forex trading contains substantial risk and is not for every investor. An investor could potentially lose all or more than the initial investment. Risk capital is money that can be lost without jeopardizing ones’ financial security or life style. Only risk capital should be used for trading and only those with sufficient risk capital should consider trading. Past performance is not necessarily indicative of future results.

Hypothetical Performance Disclosure: Hypothetical performance results have many inherent limitations, some of which are described below. No representation is being made that any account will or is likely to achieve profits or losses similar to those shown; in fact, there are frequently sharp differences between hypothetical performance results and the actual results subsequently achieved by any particular trading program. One of the limitations of hypothetical performance results is that they are generally prepared with the benefit of hindsight. In addition, hypothetical trading does not involve financial risk, and no hypothetical trading record can completely account for the impact of financial risk of actual trading. for example, the ability to withstand losses or to adhere to a particular trading program in spite of trading losses are material points which can also adversely affect actual trading results. There are numerous other factors related to the markets in general or to the implementation of any specific trading program which cannot be fully accounted for in the preparation of hypothetical performance results and all which can adversely affect trading results.

Testimonial Disclosure: Testimonials appearing on this website may not be representative of other clients or customers and is not a guarantee of future performance or success.