
Early sentiment signs in gold miners and natural gas

Key points
- Gold miners and natural gas have enjoyed a sharp advance recently
- A sentiment warning sign has flashed for now
- The message may be less "sell everything now" and more "don't fall in love with the trend"
The Sentimentrader Optix indicator
The Sentiment Optimism Index (Optix) for ETFs is based on data including:
- Trading activity in put options versus call options
- Future volatility expectations
- Average discount of the fund to its NAV
- Price behavior
Each measure is ranked against its historical norms to determine whether or not the current level is at an extreme, then totaled to come up with an overall score. The Optix can go from 0 (maximum pessimism) to 100 (maximum optimism), though it generally stays above 20 and below 80.
As with most contrary indicators, when sentiment becomes highly pessimistic, below 30, we become alert to a possible reversal to the upside as expectations improve from very low levels. When sentiment is very high, above 70, we become concerned about a correction as expectations may have gotten too optimistic.
Gold stocks are attempting to follow gold bullion higher...and the bulls have noticed
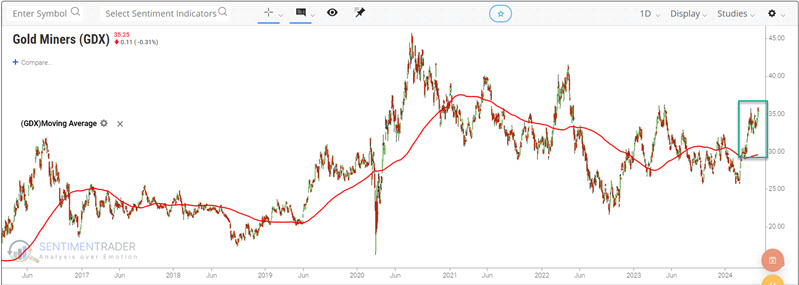
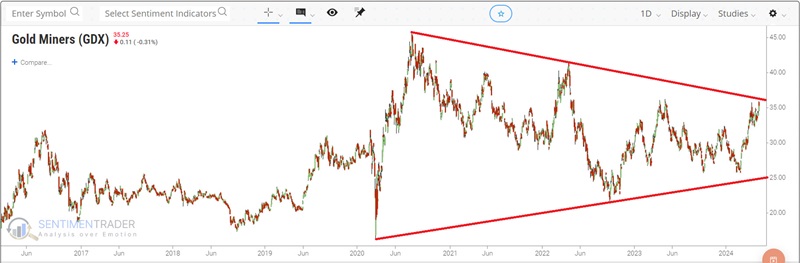
The chart below shows that the VanEck Gold Miners ETF (GDX) has also spent many years in a trading range. Recently, it has attempted to follow Gold's lead and stage a rally.
Theoretically, a breakout above the upper red line in the chart below would confirm a new uptrend in gold mining stocks.
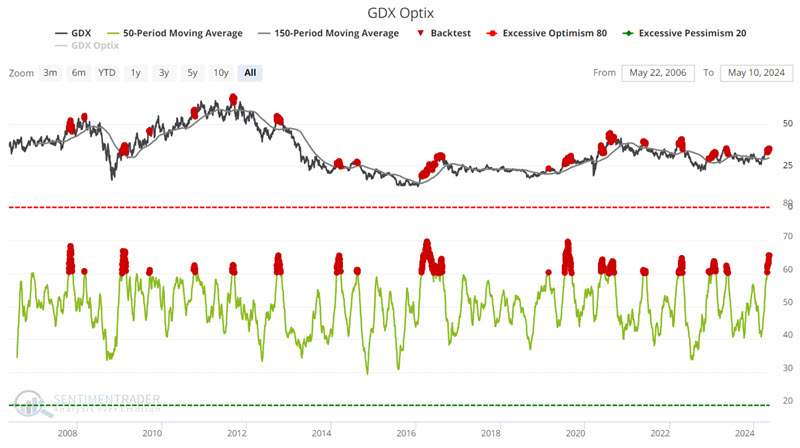
In the meantime, the recent rally has finally drawn out the gold stock bulls. The chart below highlights with a red dot all dates when the 50-day average of our GDX Optix indicator was above 60 while GDX was above its 150-day moving average.
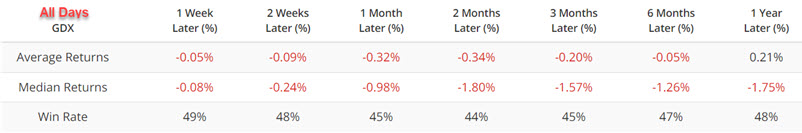
The table below summarizes GDX performance for ALL trading days since the inception of GDX trading in 2006. Note the slightly negative median returns and Win Rates below 50% for all time frames.
Compare that to the numbers in the table below, which summarize GDX performance following only the red dot days highlighted in the chart above.
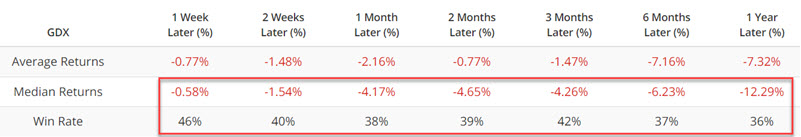
Win Rates and Median Returns are lower across the board. The latest cluster of red dots may not be a reason to panic. However, it does suggest that investors prepare for some choppiness in the months ahead and that a better buying opportunity may await those looking to enter the gold miners sector.
Natural Gas bounces off of a multiple bottom...and the bulls pile in
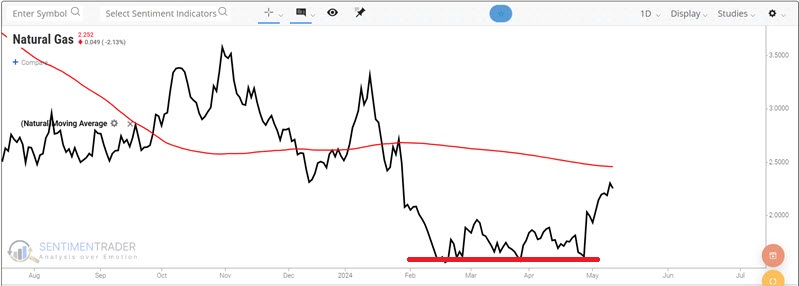
The chart below shows that natural gas futures have attempted to put in a multiple bottom in recent months and have enjoyed a sharp rally in the last week and a half. A cross above the 200-day moving average would be a positive sign that this rally has legs.
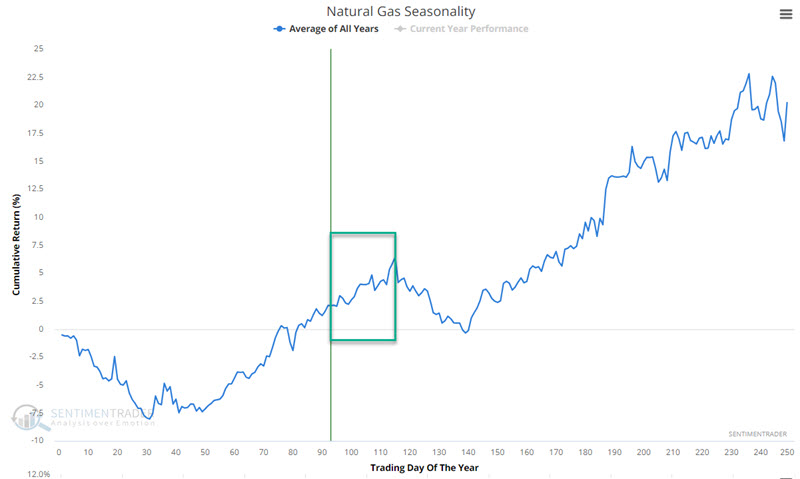
In the annual seasonal chart below, we see that natural gas still has some time left during a favorable seasonal period, which extends through 2024-06-12.
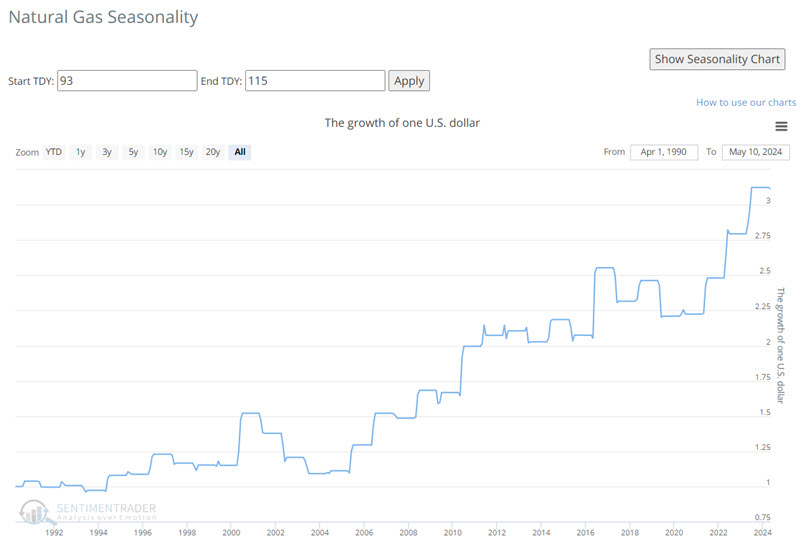
The chart below displays the hypothetical growth of $1 in natural gas (based on percentage price changes, not actual futures contract values) if held long from Trading Day of Year (TDY) #93 through TDY #115 every year. While results can vary widely from year to year, the long-term rising trend is unmistakable.
So, does the latest short natural gas rally have legs? Possibly, yes. But there is a reason to be wary. The chart below uses natural gas futures and highlights with a red dot those dates when our UNG Optix indicator (The United States Natural Gas LP ETF is ticker UNG) has crossed above 95.
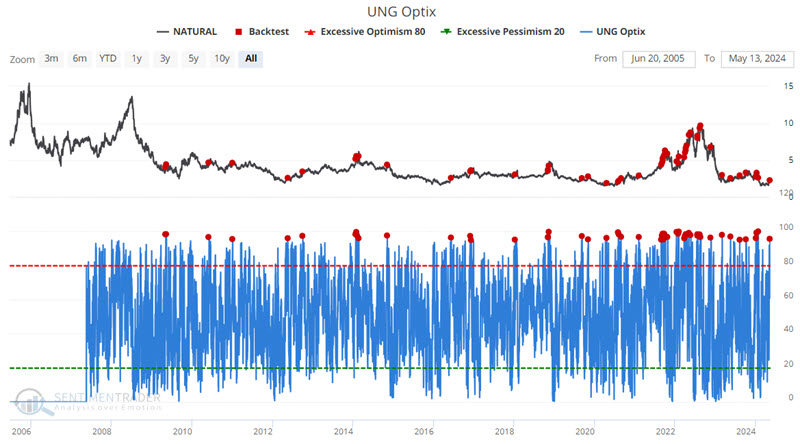
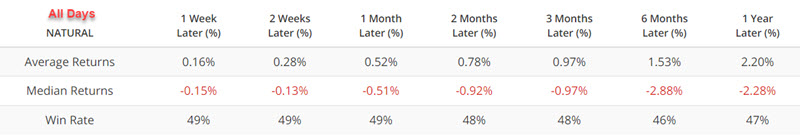
The table below summarizes the performance of natural gas futures following ALL trading days since 2005.
The table below summarizes natural gas futures performance following only those days highlighted with a red dot in the chart above.
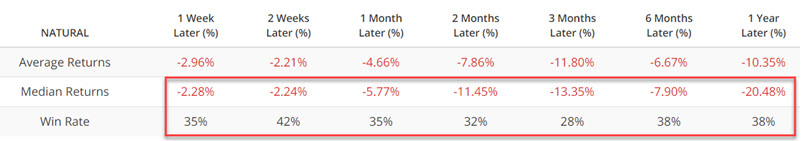
Note the significantly negative Median Returns and unfavorable Win Rates across the board - particularly over three months and one year.
Very recent price action and seasonality suggest that natural gas could continue to trend higher in the interim. But the results directly above suggest that traders be nimble, use tight trailing stops on any long positions, and look for opportunities to play the short side.
One low-cost dollar possibility might be considering options on ticker UNG (to avoid the leverage associated with futures trading and limit risk).
What the research tells us…
Gold mining stocks and natural gas are attempting to establish new longer-term uptrends. The problem is that both have a history of long-term weak performance and swift and sudden reversals. The sentiment signals highlighted above should not necessarily be considered "sell everything now" signals but more as warnings not to get complacent on the long side and to keep an eye open for new plays on the short side.