Headlines
|
|
Leverage declines as margin debt plunges again:
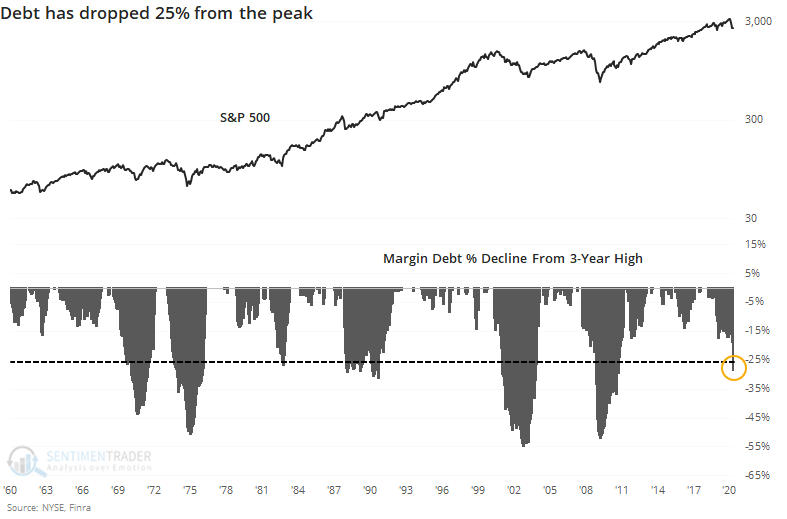
Investors pulled back on leverage in March, with margin debt declining more than 10% that month alone, one of the biggest declines for a single month in decades. Debt is now down more than 25% from its peak, which is large but not to the level of the most severe declines.
Coronavirus craters consumers' confidence:
Consumer Confidence plunged in April, with the 2nd-largest one-month decline in more than 50 years. Big drops in confidence have not been a positive sign for stocks, but this one has been so large that it's on a level with some major market bottoms.
More than half of stocks are recovering: The S&P 500 put another notch on its recovery belt on April 17 when it overtook its 50-day average. Now, more than half of the stocks in the index have finally closed above their own 50-day averages for the first time in more than 2 months. In a premium note, Troy shows that this has led to mixed shorter-term returns, but a year later the S&P was higher all 6 times since 1990. Many times, it was a rocky path, but it's a good interim step in the recovery process.
Gap and crap: Stocks jumped at the open, pushing the S&P 500 futures to a record string of opens more than 0.5% above the prior close. We saw in a premium note before the open that while not perfect, behavior like this has a strong tendency to reverse over the ensuing days. Stocks faded and the S&P closed lower for the day. There have been 7 times the futures gapped up at least 1% to at least a 30-day high then reversed to close in negative territory. Over the next 3 days, the index lost even more ground 6 of the 7 times, averaging -0.7%. By a month later, all but one were higher, though. There were 20 times it gapped up at least 0.5% to a 30-day high then reversed, with 13 of those 20 leading to more losses over the next 3 days, but a month later 14 were higher. So, reversals have had a tendency to continue short-term but not over the next month.
|
Smart / Dumb Money Confidence
|
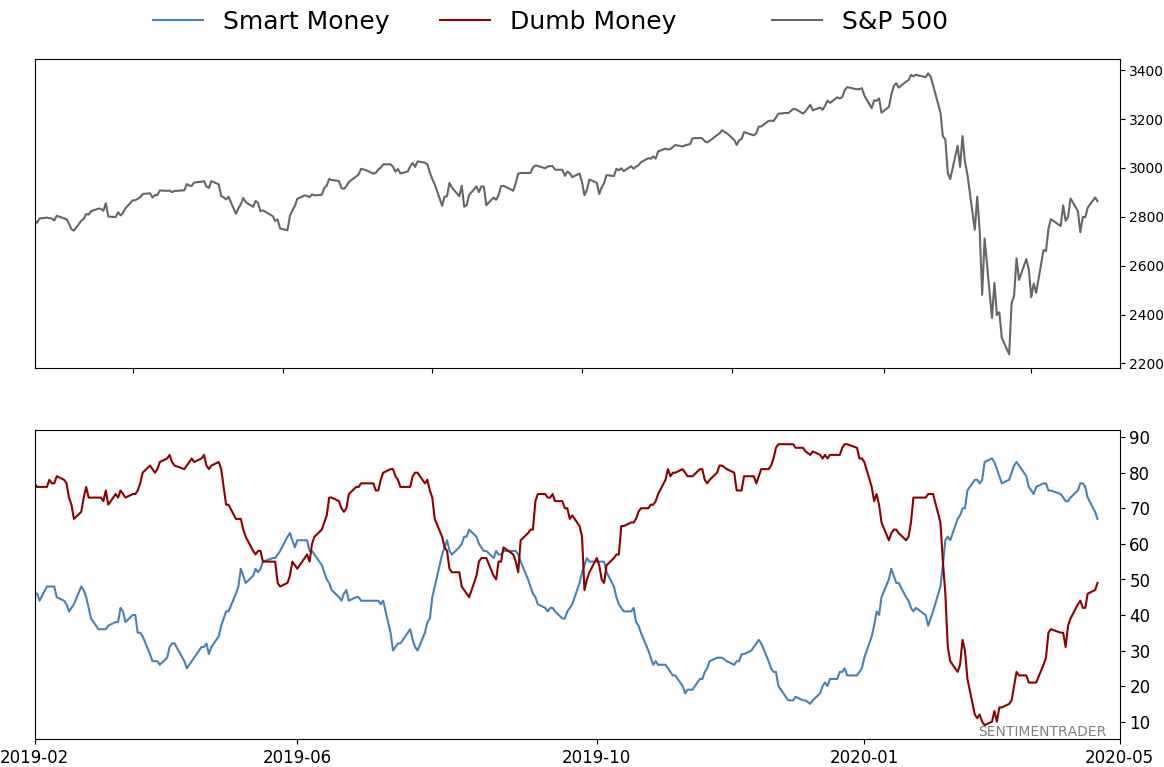
Smart Money Confidence: 67%
Dumb Money Confidence: 49%
|
|
Risk Levels
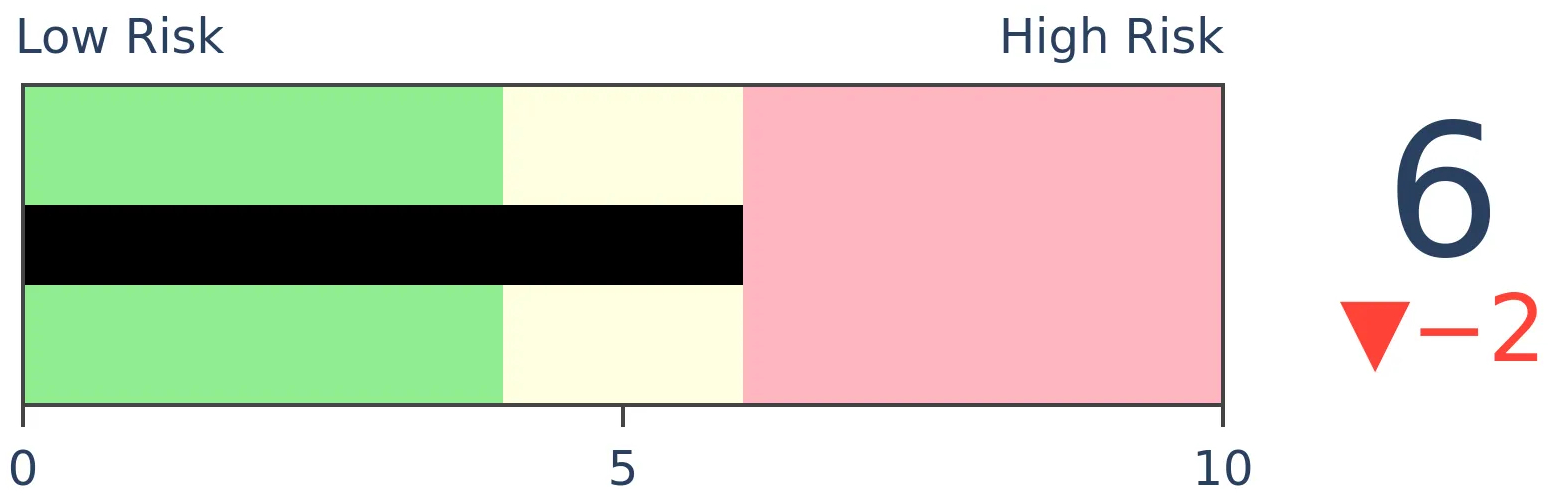
Stocks Short-Term
|
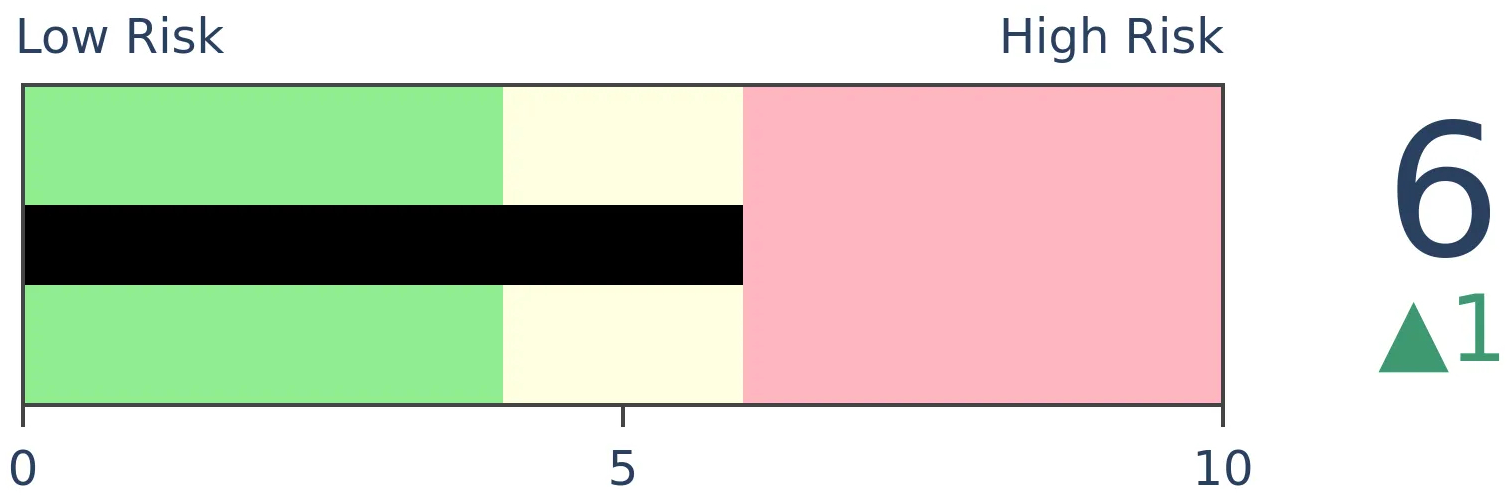
Stocks Medium-Term
|
|
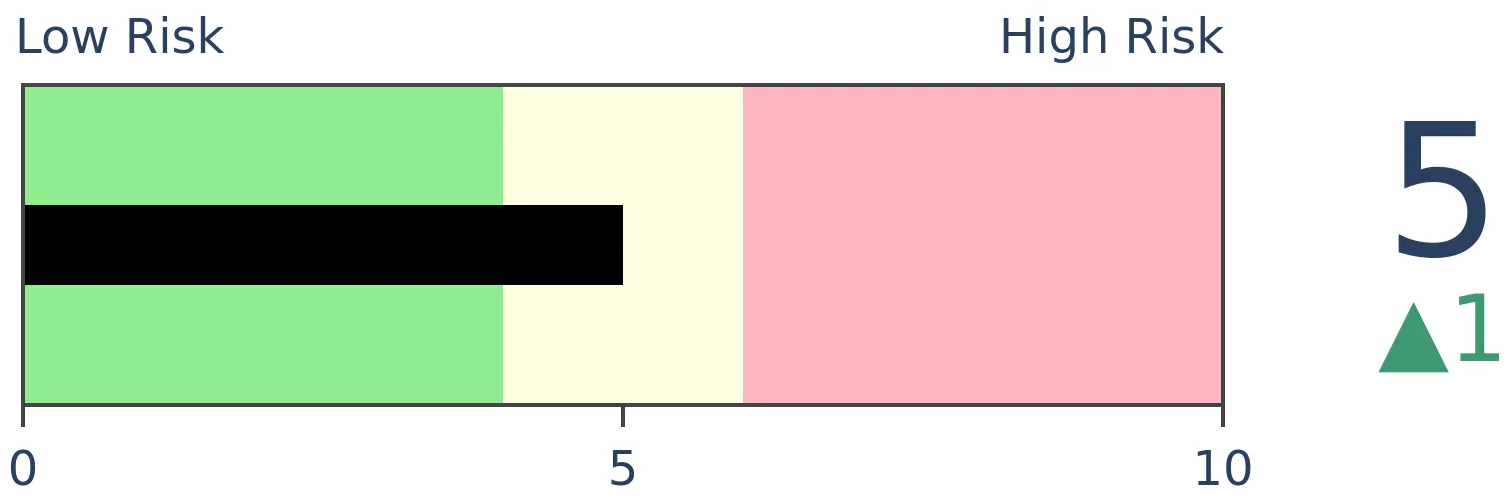
Bonds
|
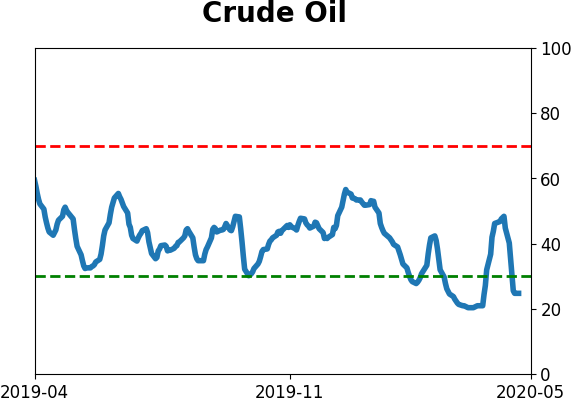
Crude Oil
|
|
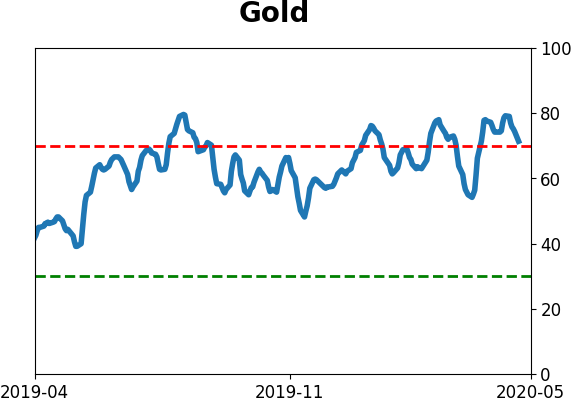
Gold
|
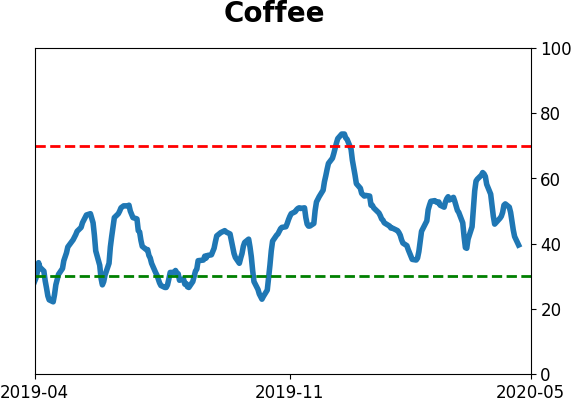
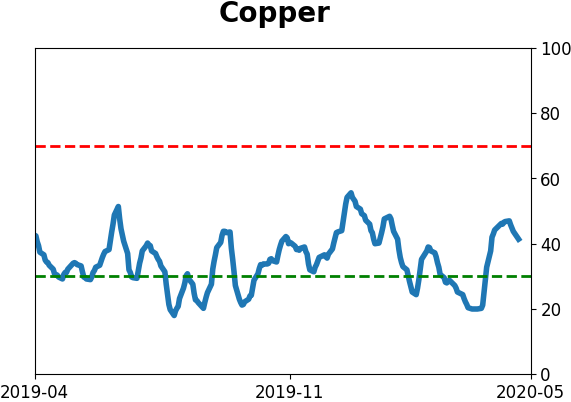
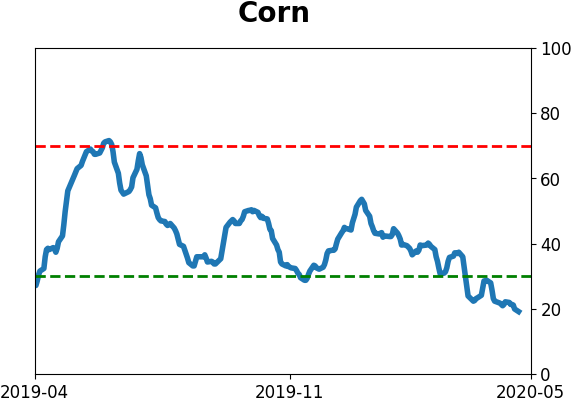
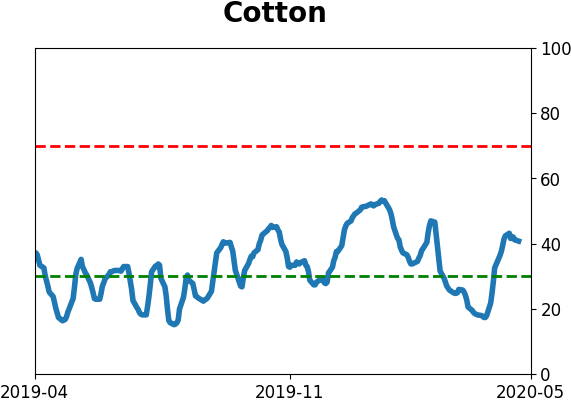
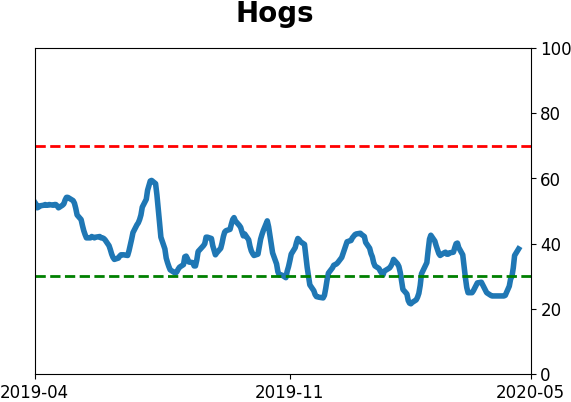
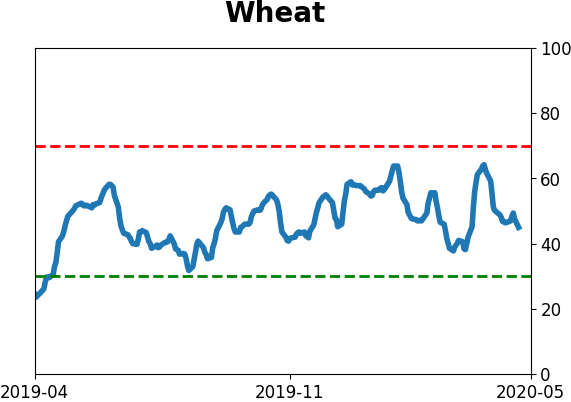
Agriculture
|
|
Research
BOTTOM LINE
Investors pulled back on leverage in March, with margin debt declining more than 10% that month alone, one of the biggest declines for a single month in decades. Debt is now down more than 25% from its peak, which is large but not to the level of the most severe declines.
FORECAST / TIMEFRAME
None
|
A market crash will usually prompt folks to pare back their leverage. Based on figures from March, the virus sparked just that behavior, as investors' debt borrowed against stock holdings plunged 10%.
That's one of the largest one-month declines in margin debt in history, especially over the past 60 years when the data became less volatile.
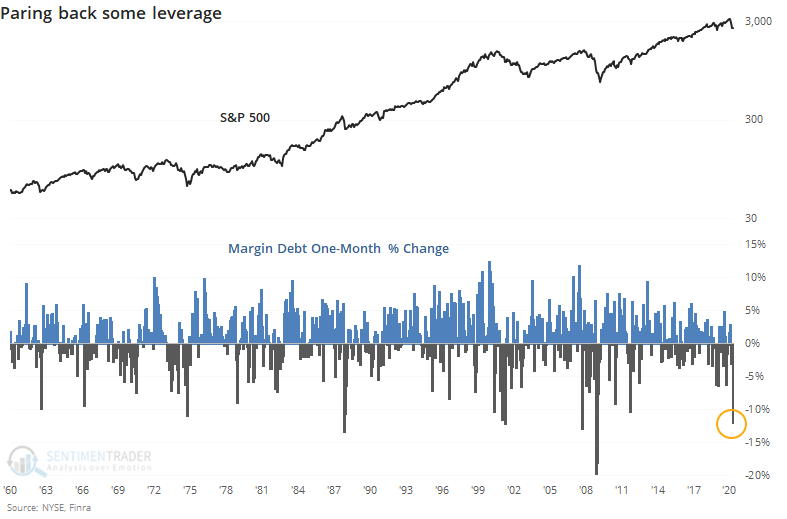
Since margin debt peaked in 2018, it has declined by more than 25%. It looks like a big decline on a chart but is only a little more than half of the decline seen during the last two protracted bear markets.
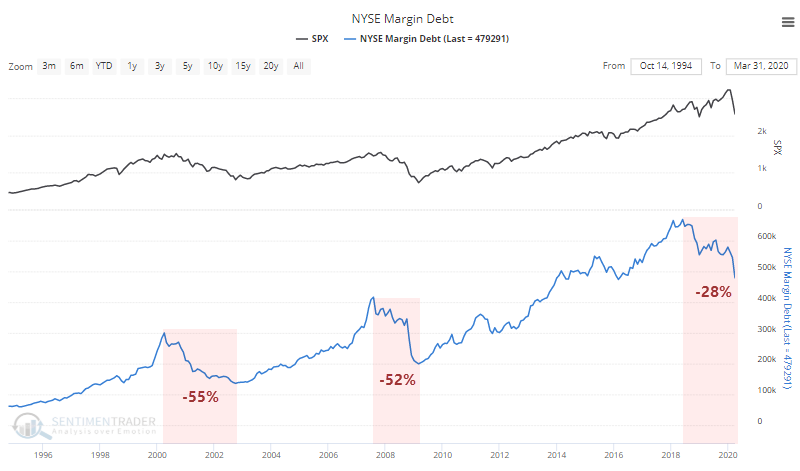
Even so, a drop of 25% from a peak is historically deep.
This has had a mixed record of being enough of a drop in leverage. The worst of the declines stopped when debt contracted by 40% - 50%, with some of the lesser market drops leading to a smaller drop in leverage.
When the drop in margin debt first hit 25%, it had a mixed record of future returns in the S&P 500. Since the figures are released with a delay, the dates in the table are as of the next month. For example, the debt decline first hit -25% in October 2008, but we wouldn't know that right away, so November 2008 is used to calculate forward returns.
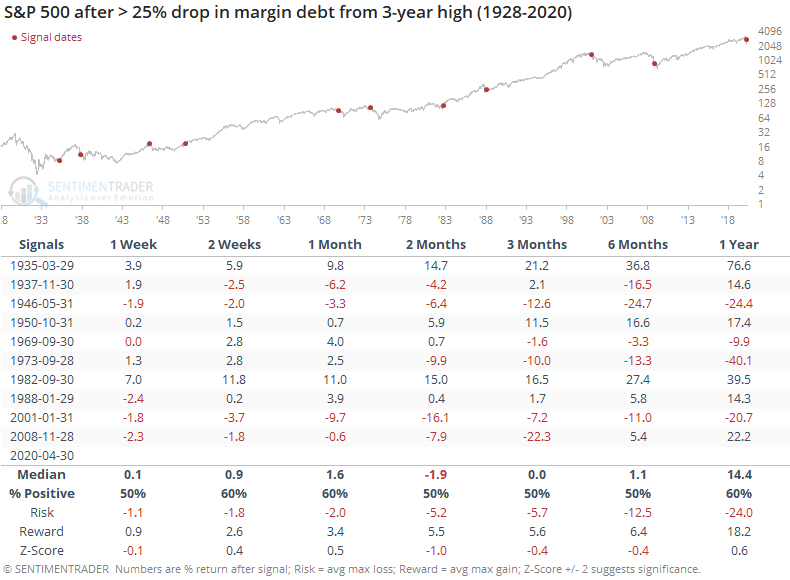
The data is less reliable the further back we go, so it makes sense to place a heavier weight on more recent signals. And in that case, returns over the next 2-3 months weren't great, especially over the next 2-3 months. The drop in 1982 was about the worst of it, so forward returns were excellent. Other than that, recent decades showed either a loss or small gain.
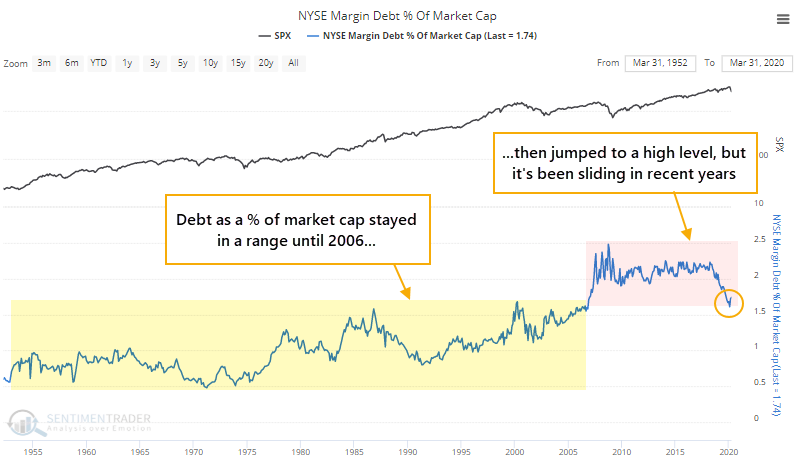
As a percentage of the total market capitalization of U.S. stocks, debt stayed in a somewhat stable range for decades, then broke out in 2006 as investors took out loans against their stock holdings to a degree never seen before. That has been dropping in recent years, and recently hit a 13-year low. It ticked up a bit in March because market cap fell more than margin debt did.
Margin debt is one of those indicators that both bulls and bears like to use when it supports their argument. The fact is that it's an inconsistent data set that mostly just tracks the market itself. The fact that it has dropped by more than 25% isn't enough to suggest a washout, and if anything it's a very slight negative for the months ahead.
BOTTOM LINE
Consumer Confidence plunged in April, with the 2nd-largest one-month decline in more than 50 years. Big drops in confidence have not been a positive sign for stocks, but this one has been so large that it's on a level with some major market bottoms.
FORECAST / TIMEFRAME
None
|
The latest release of Consumer Confidence from the Conference Board shows that attitudes flipped in a major way in April. From a near-record level, Confidence dropped more than 30 points in a single month.
That's the 2nd-largest monthly decline since 1967. The only month with a larger decline was December 1973 when OPEC doubled the price of crude oil and terrorists had commandeered a plane in Italy.
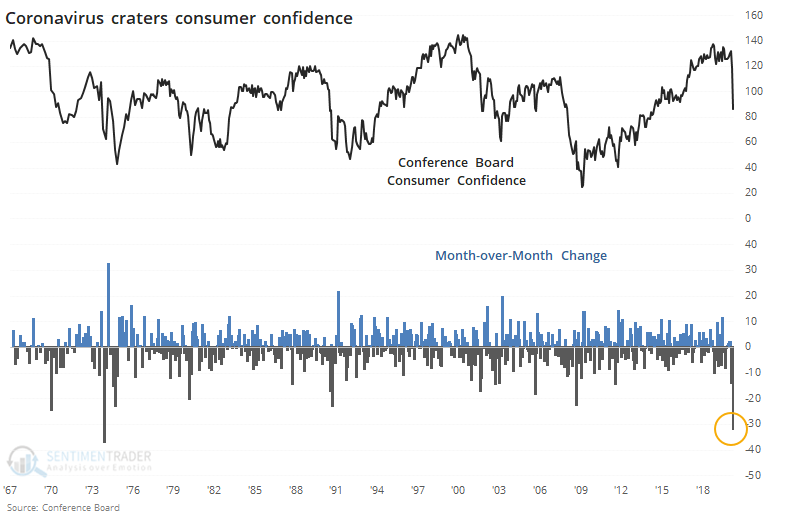
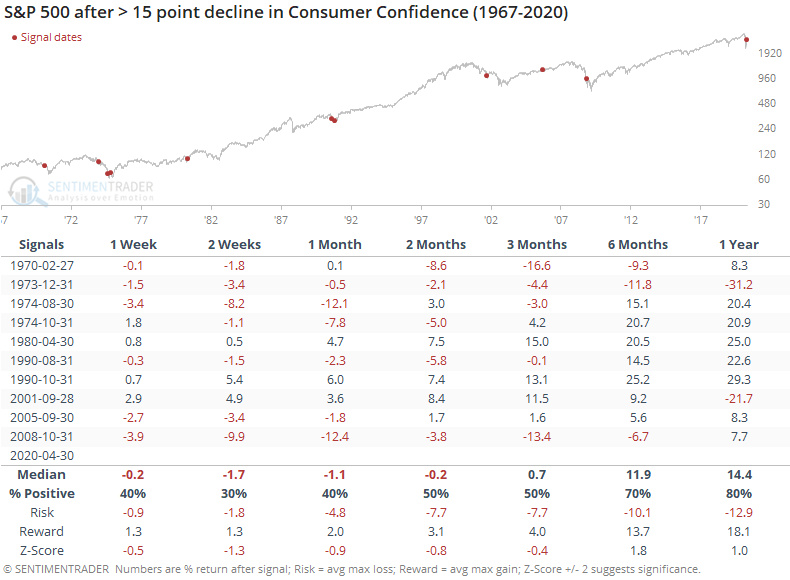
Big declines in confidence have come during rough markets, and they didn't usually turn on a dime. In the weeks following the largest monthly declines, stocks tended to fall.
What makes this change stand out is its sheer magnitude. Already, Consumer Confidence is down more than 45 points from the peak over the past year.
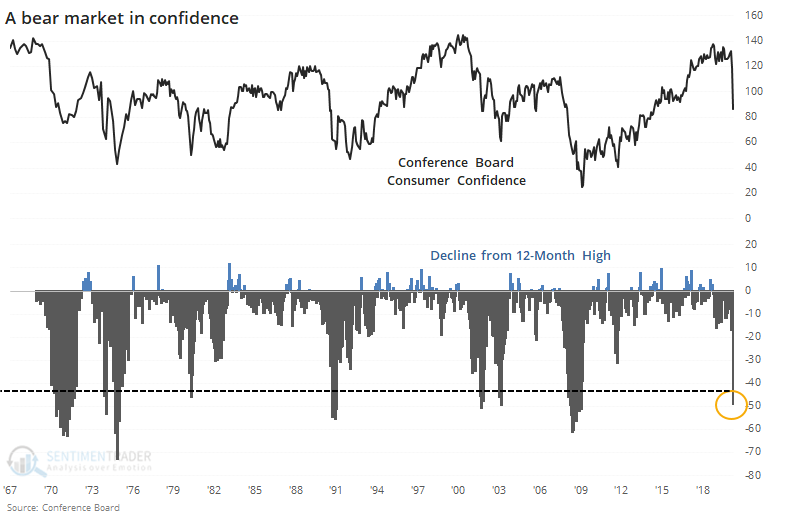
When put into this context, returns were significantly better.
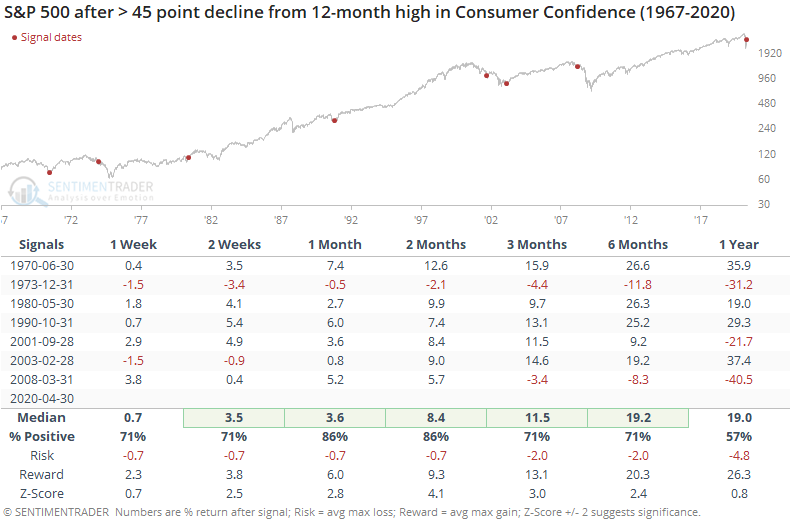
That drop in 1973 is still in the table, and it's the only one that showed a loss over the next 1-2 months, which cascaded into an even larger drop over the next year.
If we combine the large one-month drops in Confidence and the largest drawdowns from the highest Confidence level over the past year, then we get the following signals.
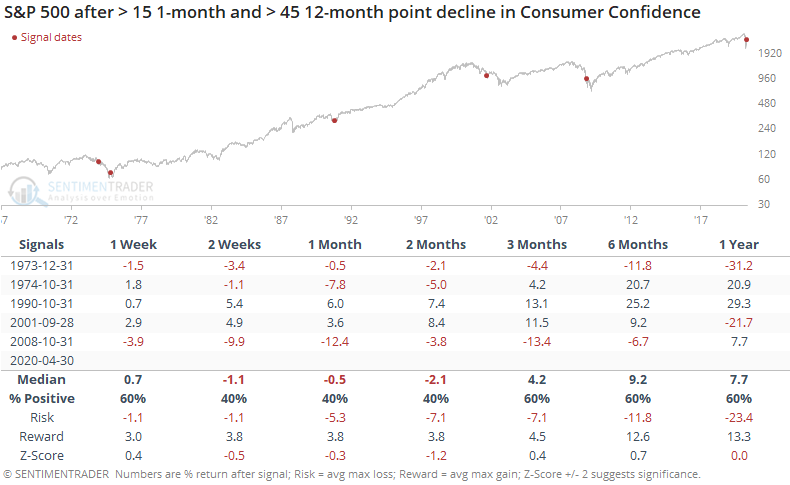
These massive drops in Consumer Confidence came near bear market lows in 1974 and 1990. But it was woefully early in 1973 and 2008, and served to be only a medium-term inflection point in 2001.
Both bulls and bears could point to something there, which isn't very helpful. Probably the biggest takeaway is that it should be a positive going forward, but if prices start to show a pattern of lower lows, then the precedents are decidedly negative.
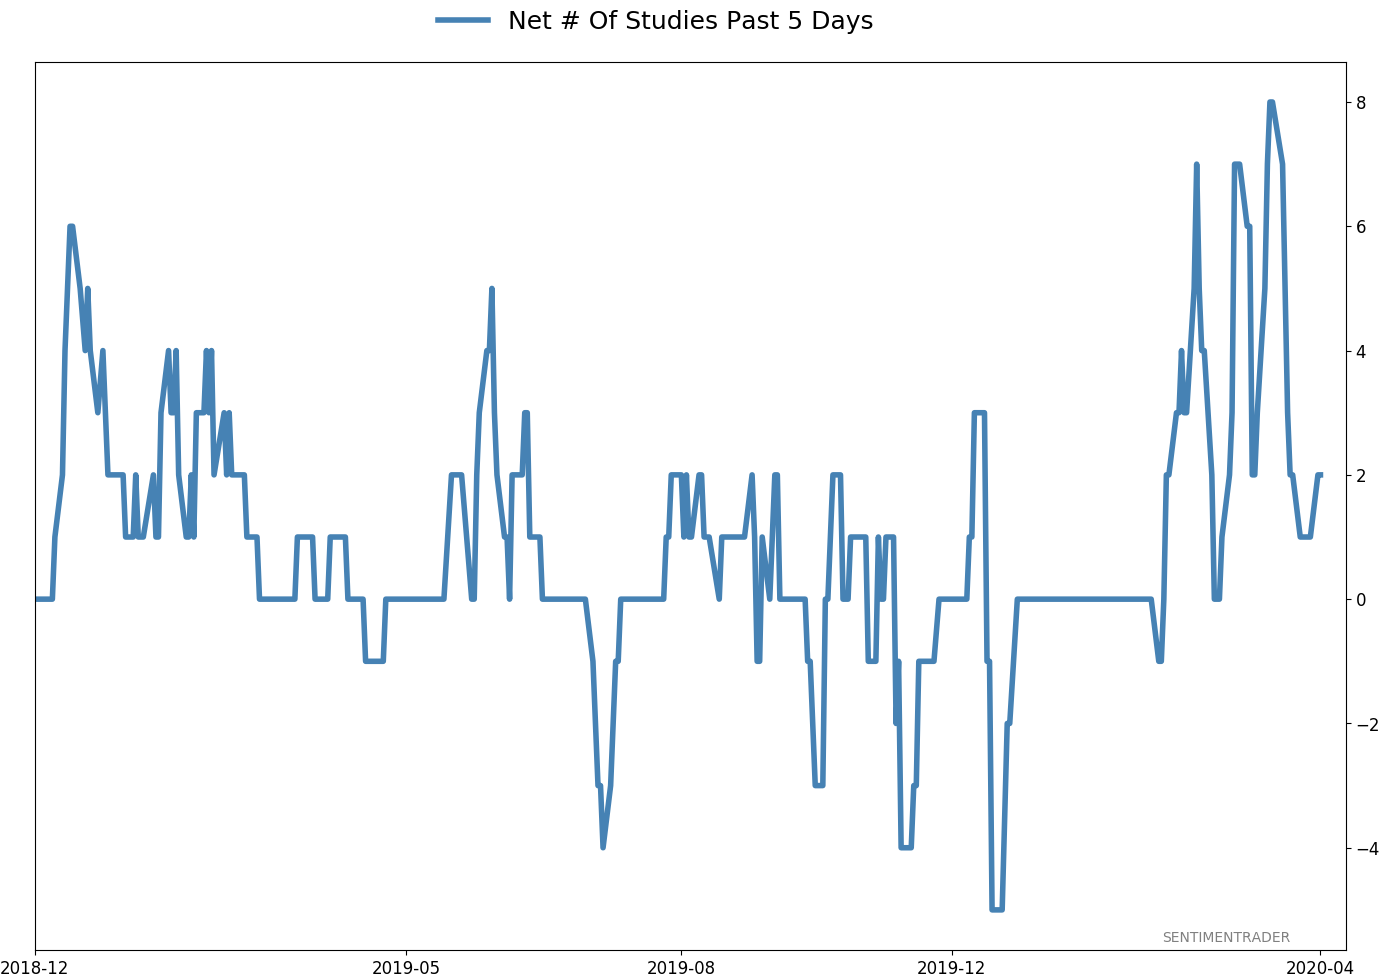
Active Studies
| Time Frame | Bullish | Bearish | | Short-Term | 0 | 5 | | Medium-Term | 12 | 0 | | Long-Term | 34 | 3 |
|
Indicators at Extremes
Portfolio
| Position | Weight % | Added / Reduced | Date | | Stocks | 49.9 | Reduced 10.3% | 2020-04-23 | | Bonds | 0.0 | Reduced 6.7% | 2020-02-28 | | Commodities | 5.1 | Added 2.4%
| 2020-02-28 | | Precious Metals | 0.0 | Reduced 3.6% | 2020-02-28 | | Special Situations | 0.0 | Reduced 31.9% | 2020-03-17 | | Cash | 45.0 | | |
|
Updates (Changes made today are underlined)
In the first months of the year, we saw manic trading activity. From big jumps in specific stocks to historic highs in retail trading activity to record highs in household confidence to almost unbelievable confidence among options traders. All of that came amid a market where the average stock couldn't keep up with their indexes. There were signs of waning momentum in stocks underlying the major averages, which started triggering technical warning signs in late January. The kinds of extremes we saw in December and January typically take months to wear away, but the type of selling in March went a long way toward getting there. When we place the kind of moves we saw into March 23 into the context of coming off an all-time high, there has been a high probability of a multi-month rebound. After stocks bottomed on the 23rd, they enjoyed a historic buying thrust and retraced a larger amount of the decline than "just a bear market rally" tends to. While other signs are mixed that panic is subsiding, those thrusts are the most encouraging sign we've seen in years. Shorter-term, there have been some warning signs popping up and our studies have stopped showing as positively skewed returns. I reduced my exposure some on Monday and a little more on Thursday and will consider further reducing it if we drop below last week's lows on SPY. Long-term suggestions from the studies remain robust, but shorter-term ones are significantly less so, and stocks still have to prove that we're in something other than a protracted, recessionary bear market.
RETURN YTD: -9.3% 2019: 12.6%, 2018: 0.6%, 2017: 3.8%, 2016: 17.1%, 2015: 9.2%, 2014: 14.5%, 2013: 2.2%, 2012: 10.8%, 2011: 16.5%, 2010: 15.3%, 2009: 23.9%, 2008: 16.2%, 2007: 7.8%
|
|
Phase Table
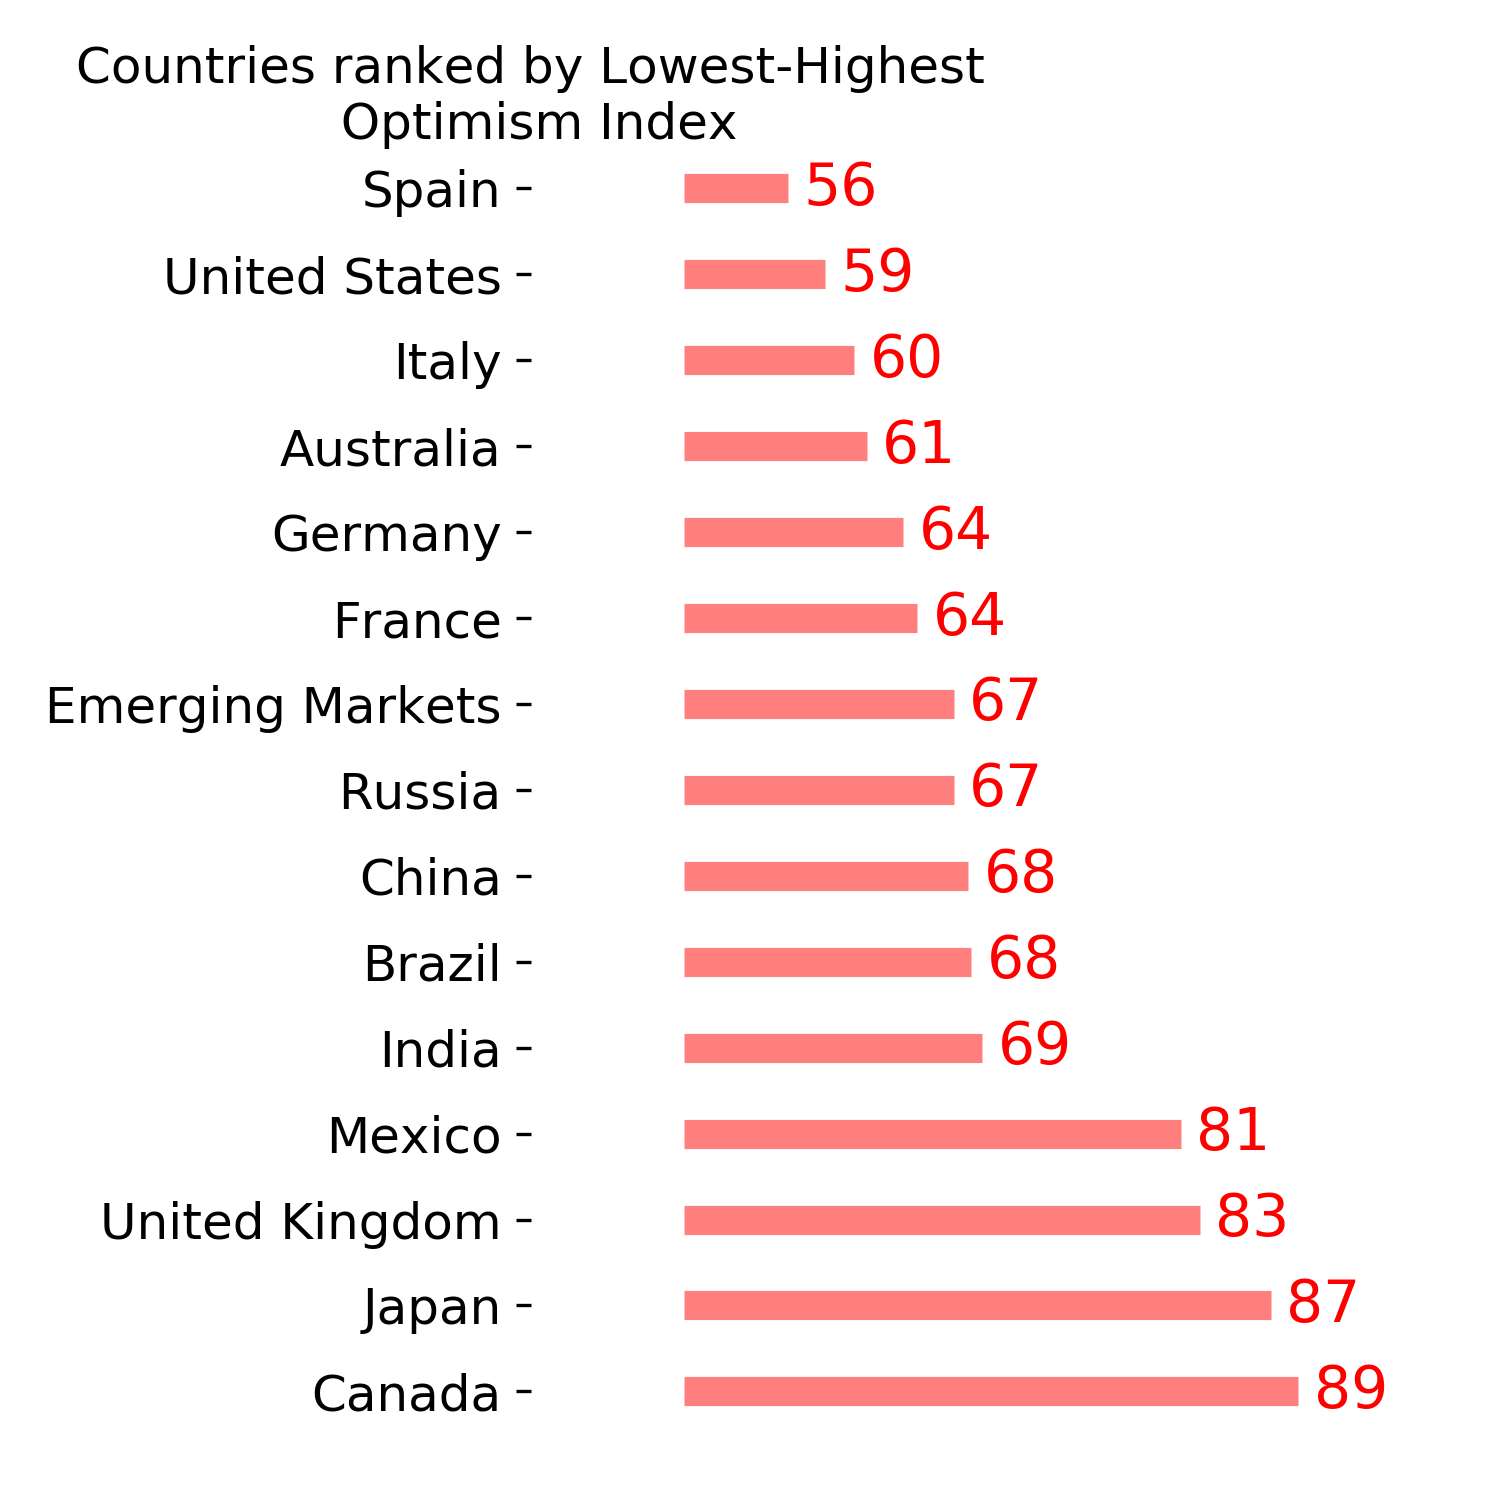
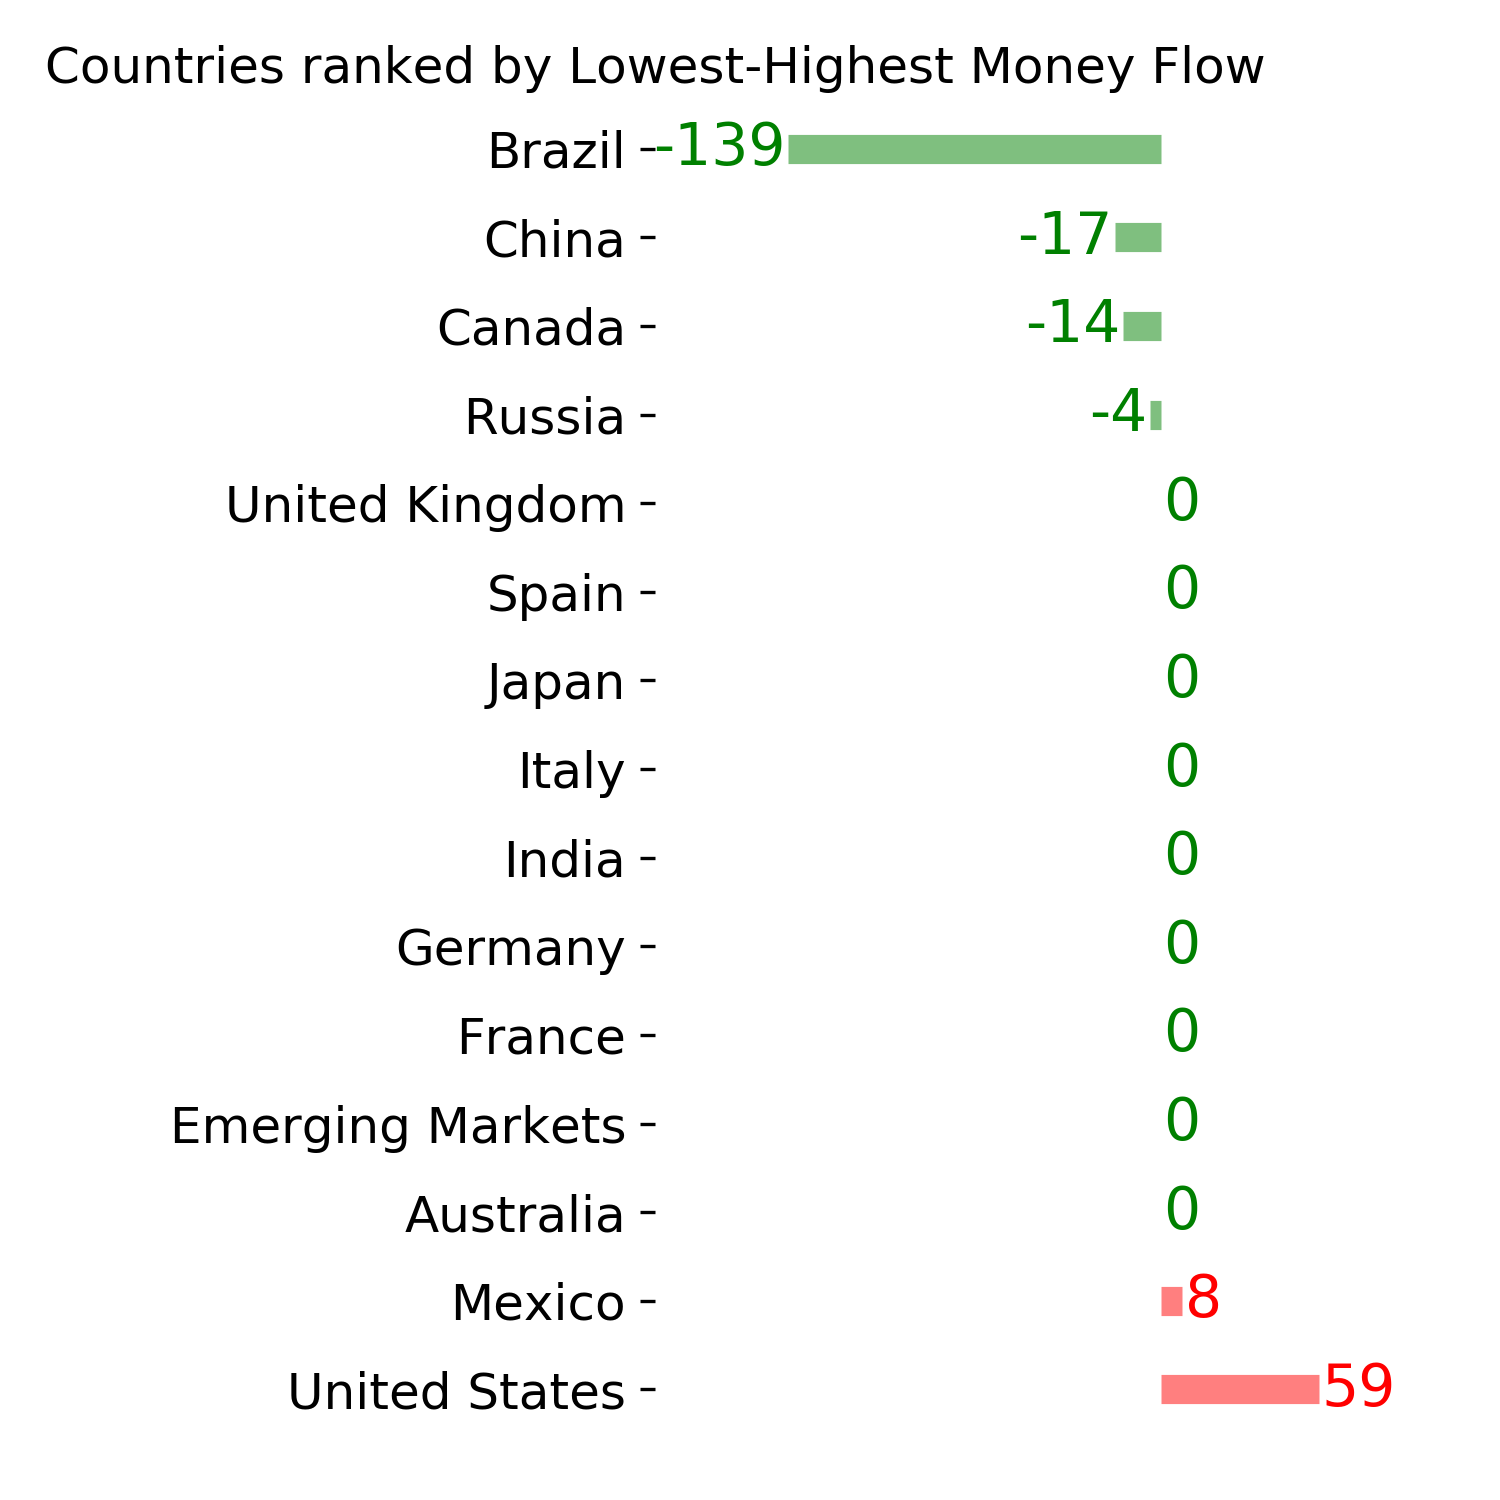
Ranks
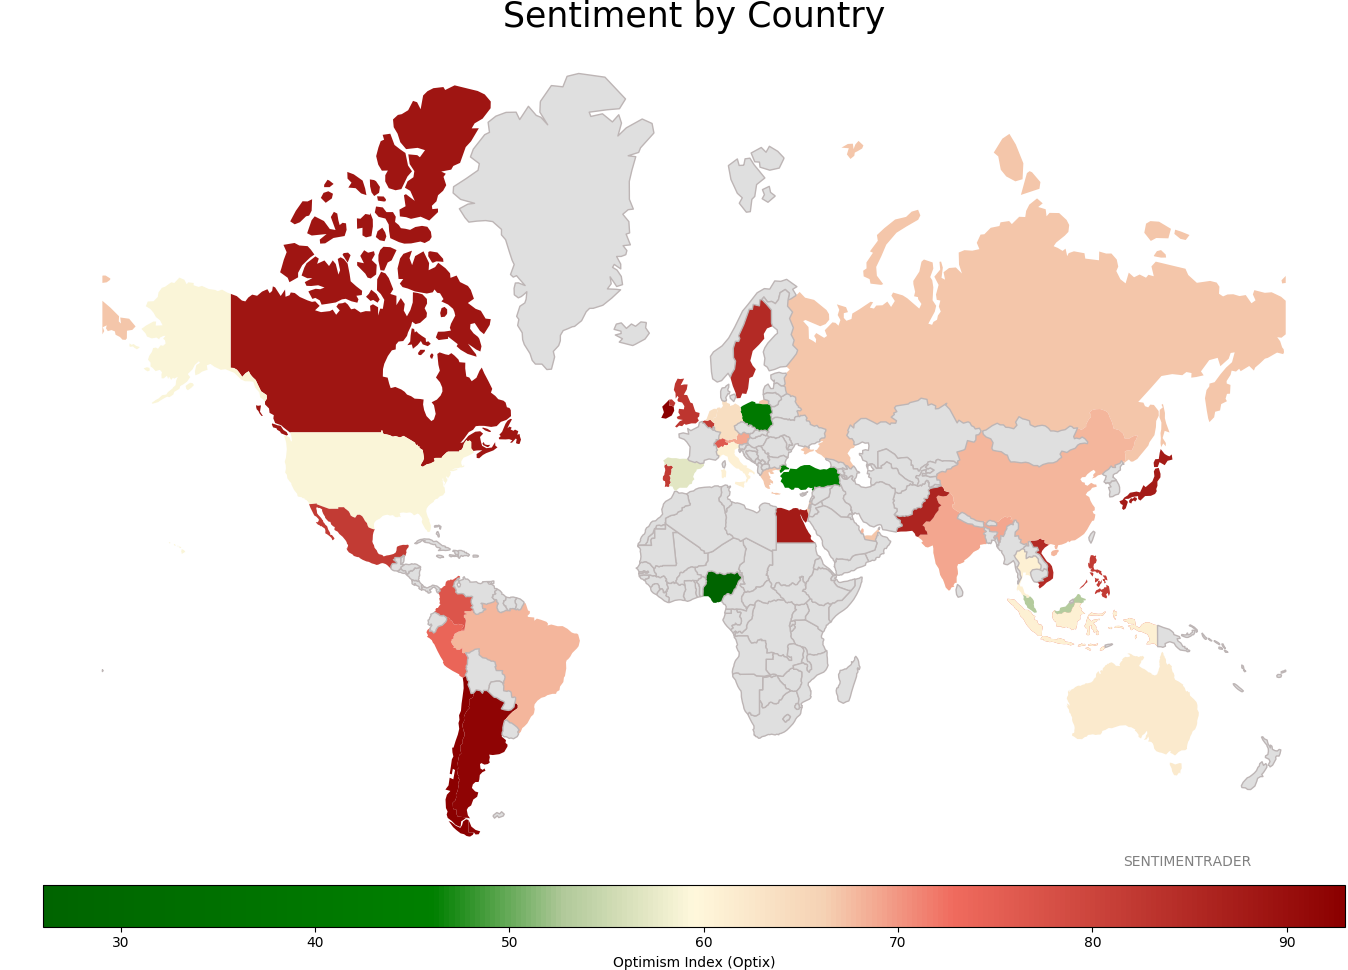
Sentiment Around The World
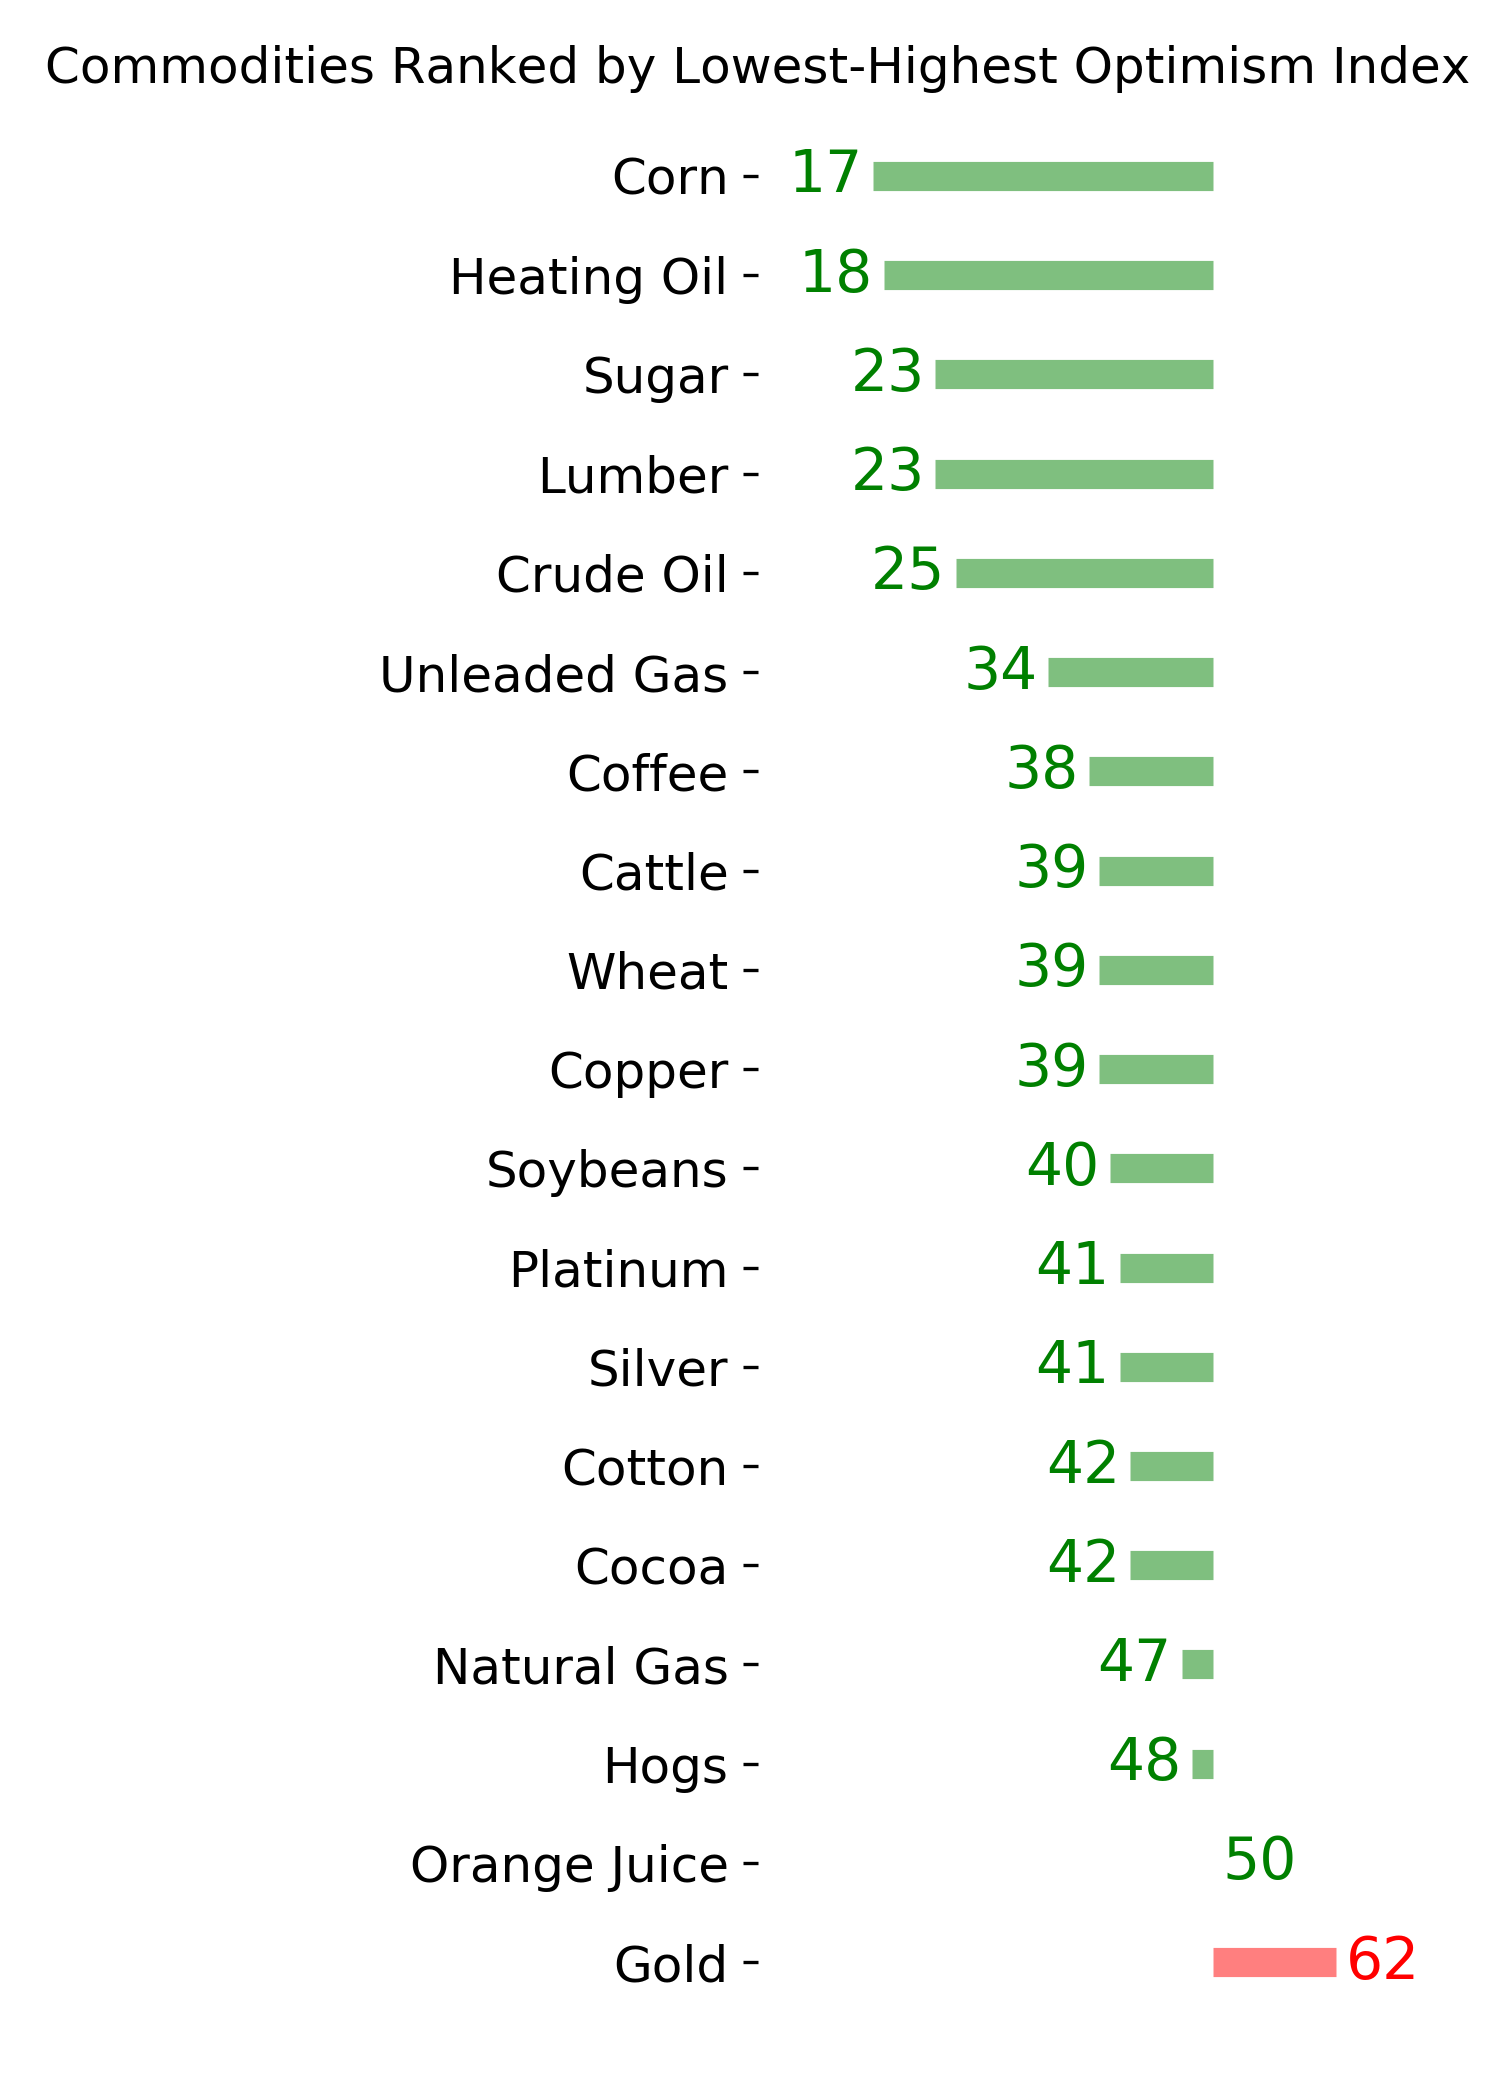
Optimism Index Thumbnails
|
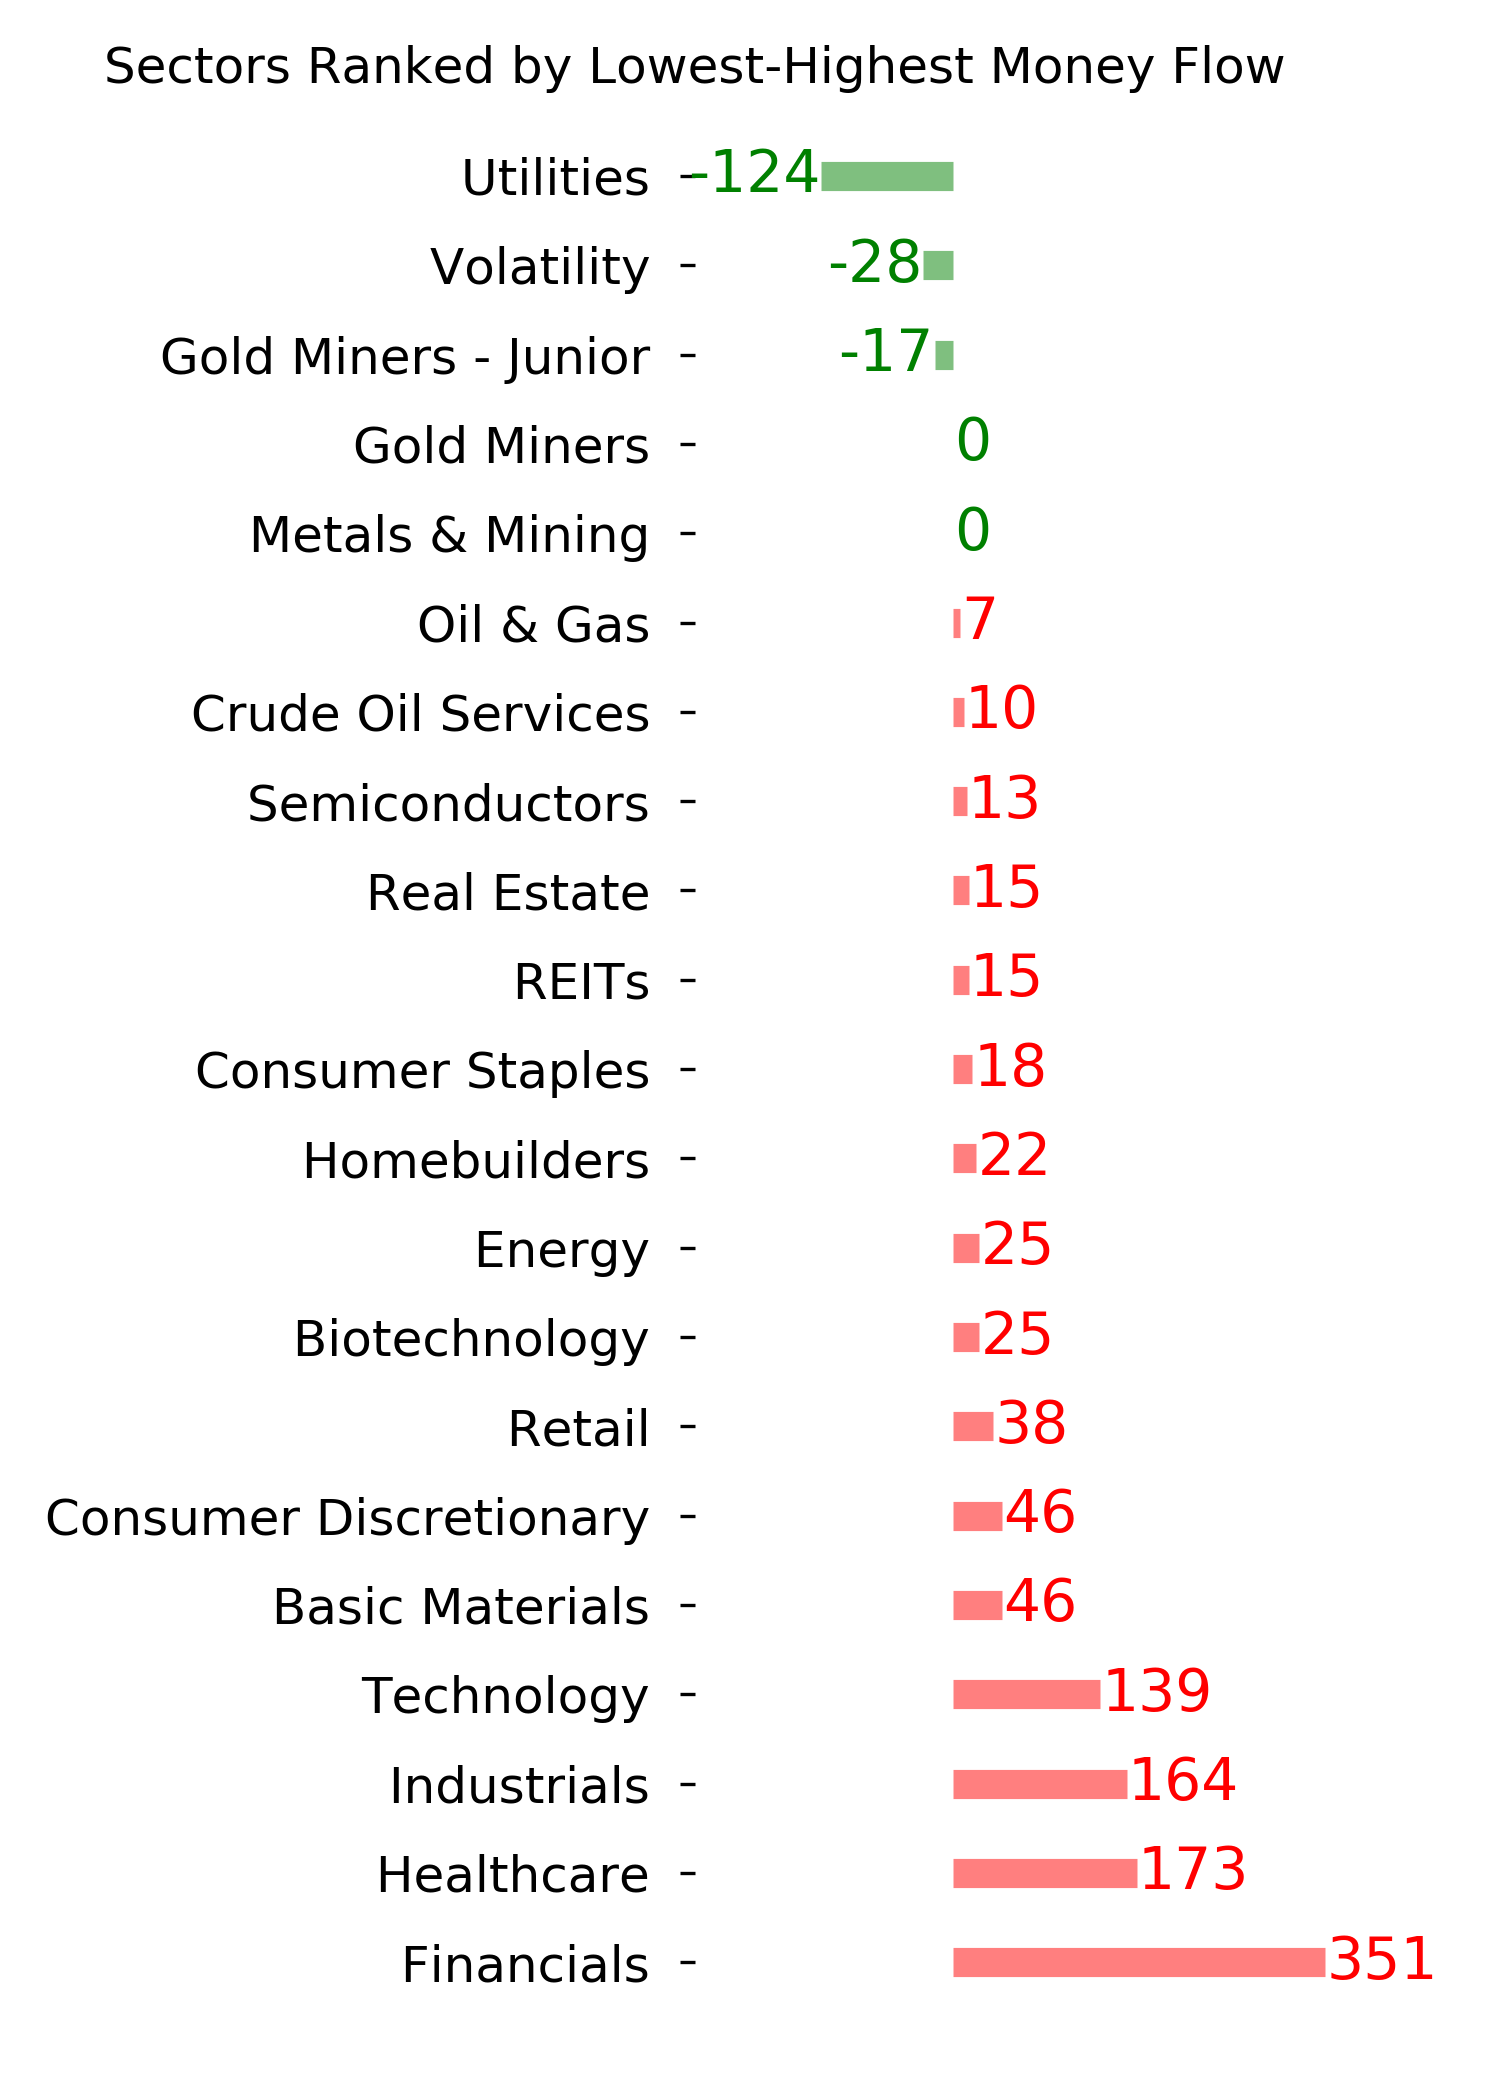
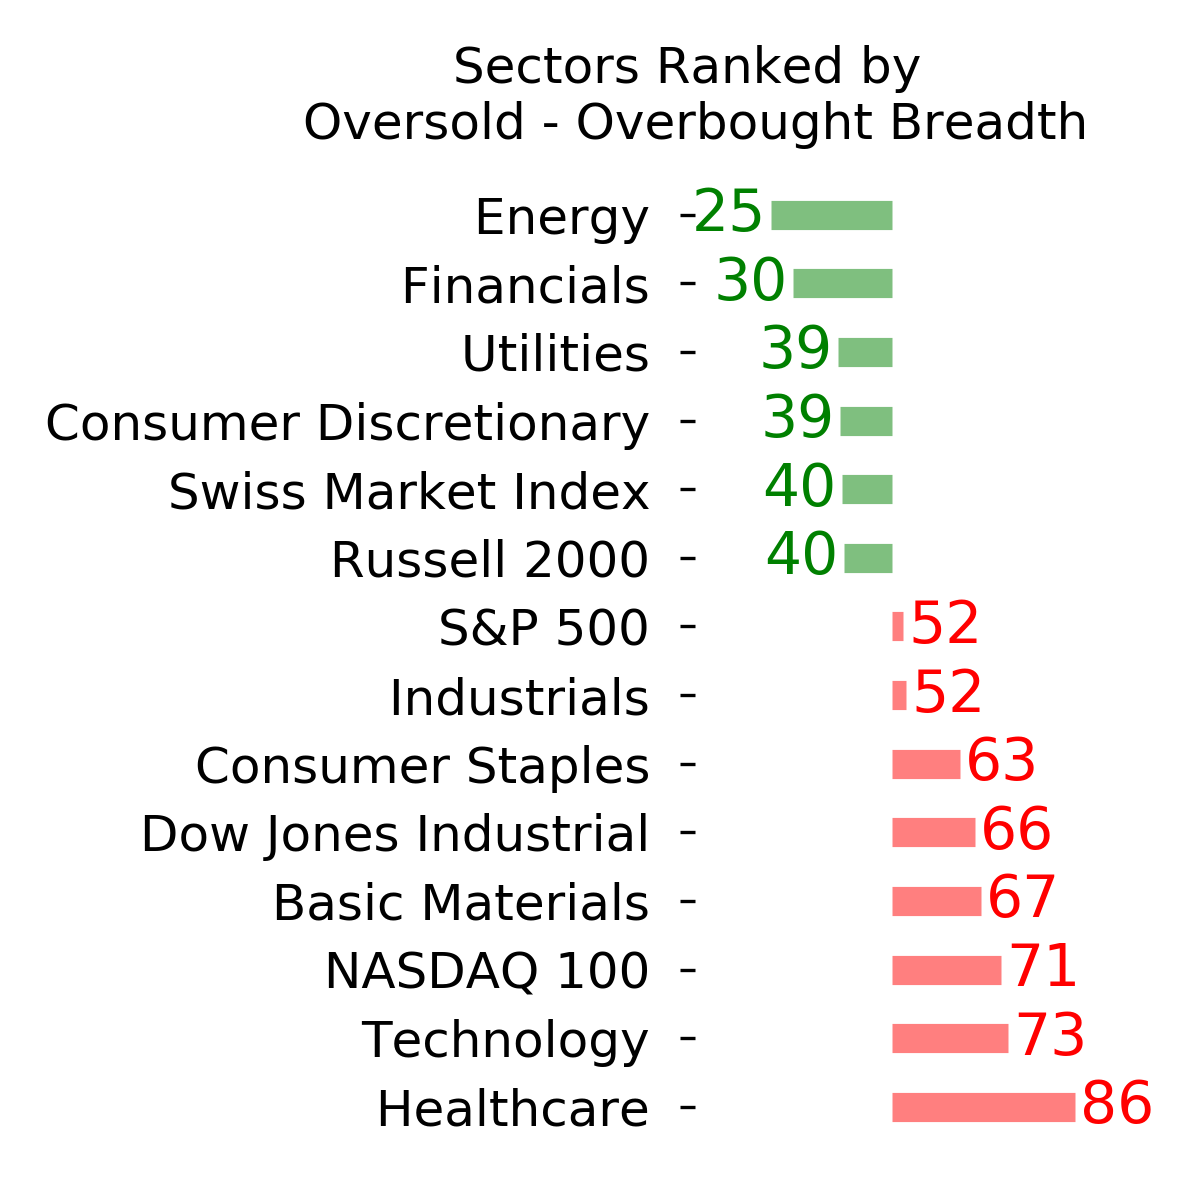
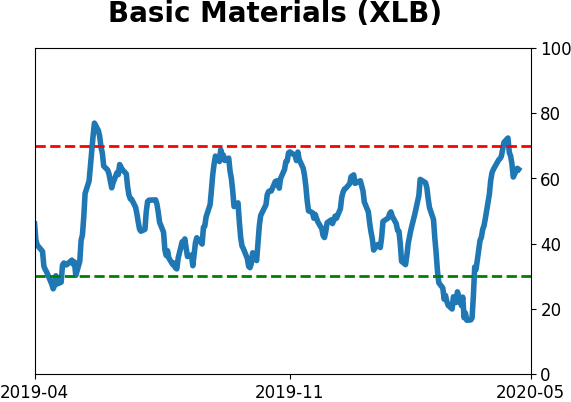
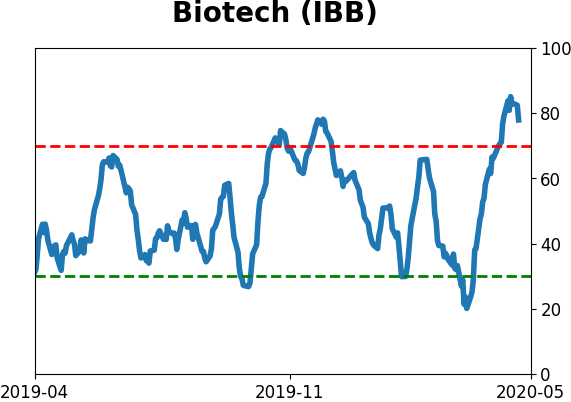
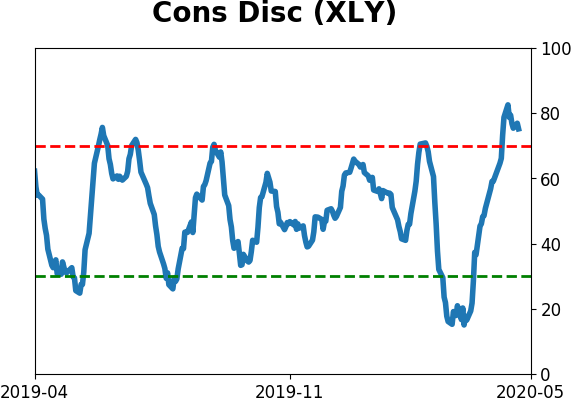
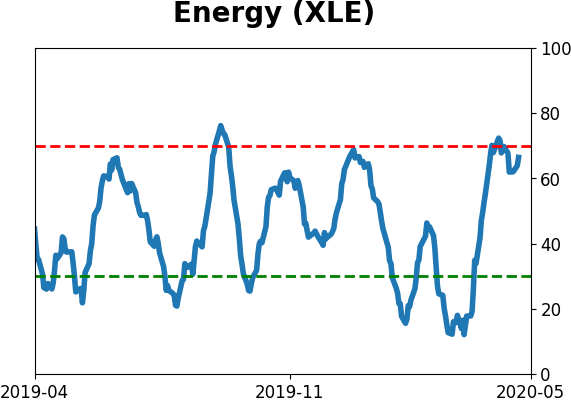
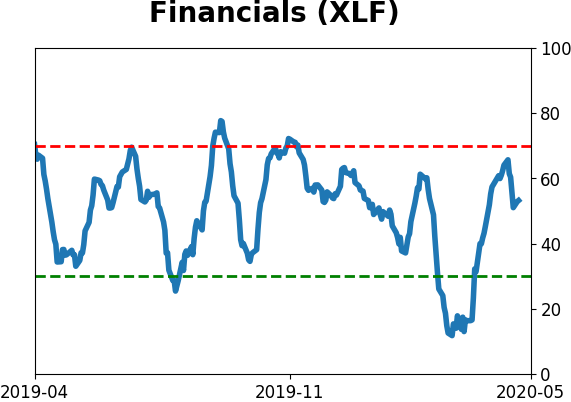
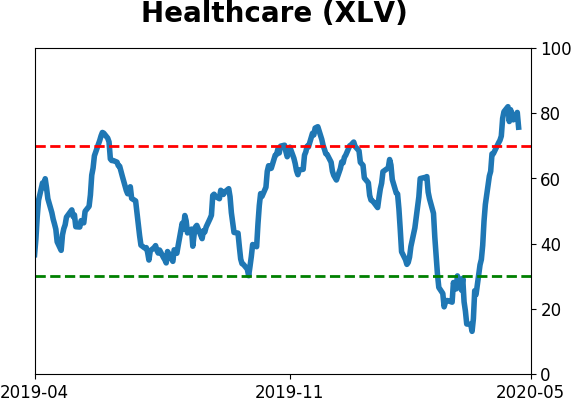
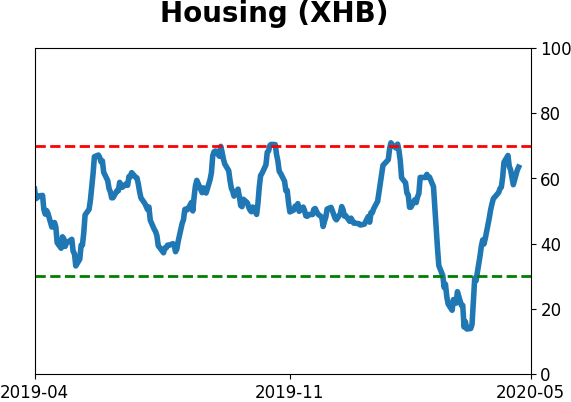
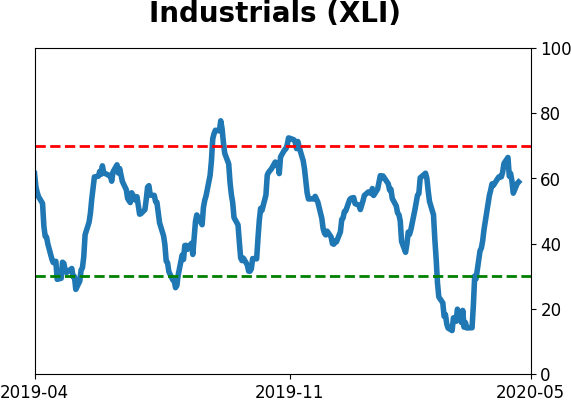
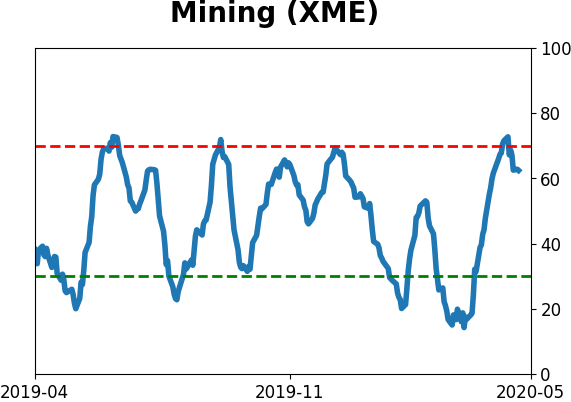
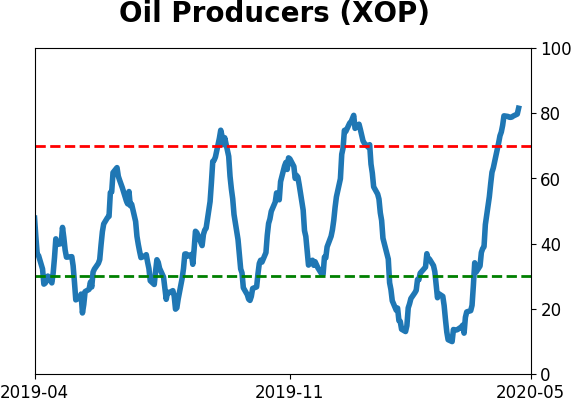
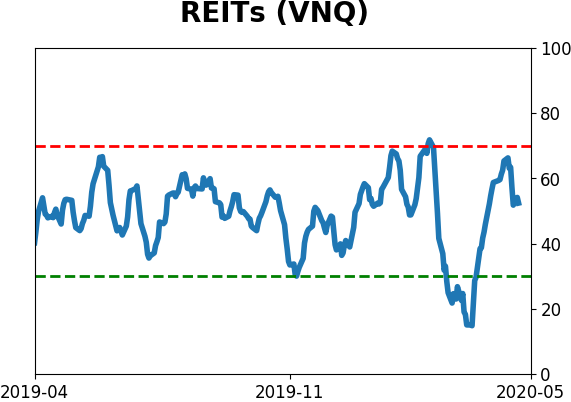
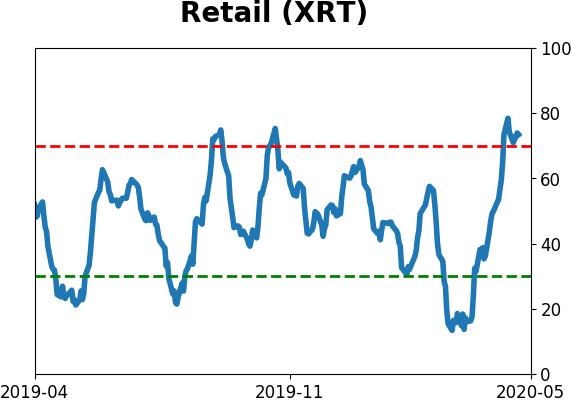
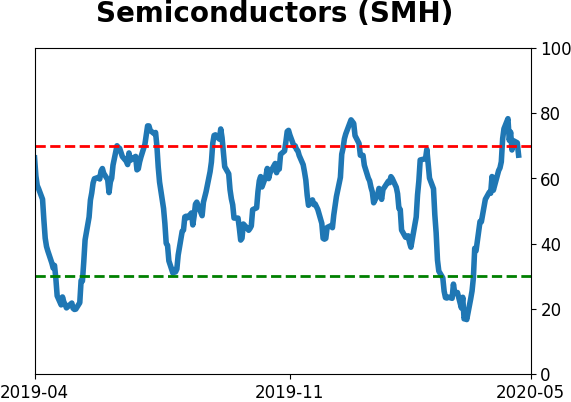
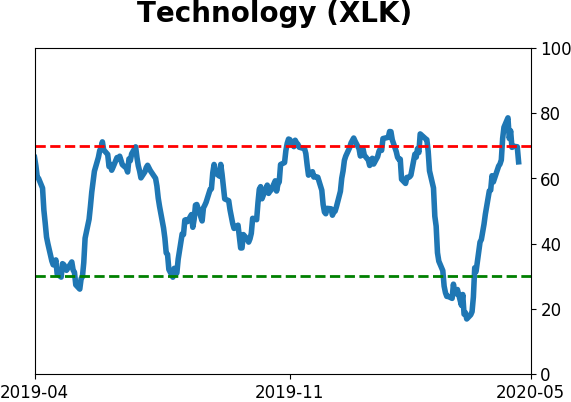
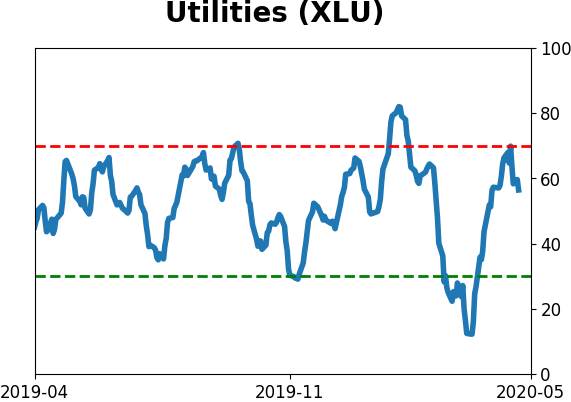
Sector ETF's - 10-Day Moving Average
|
|
|
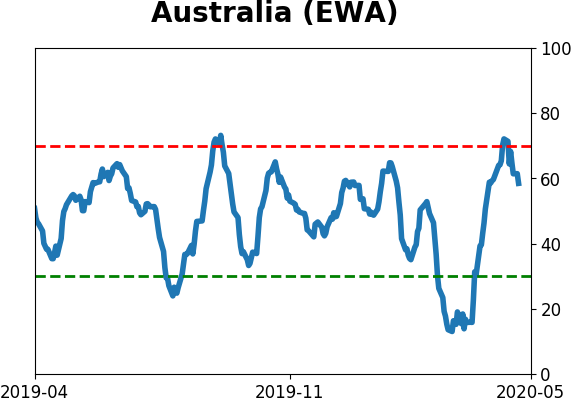
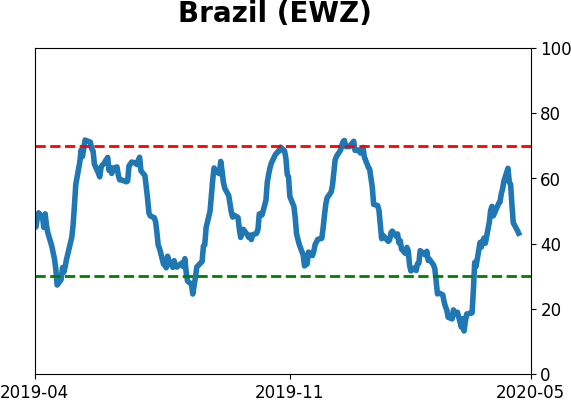
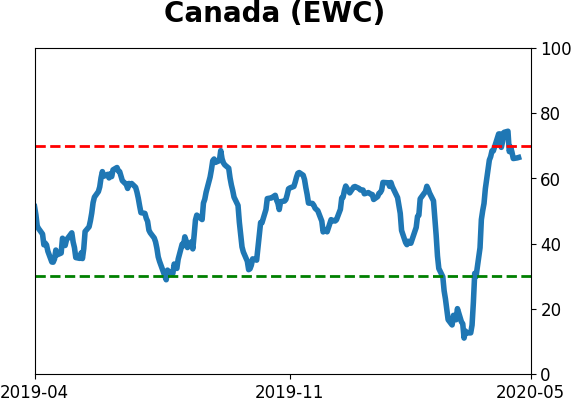
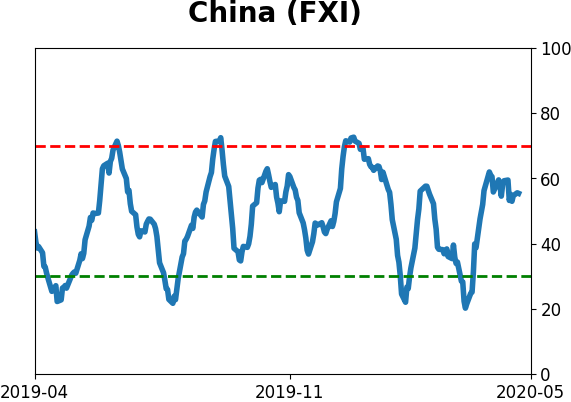
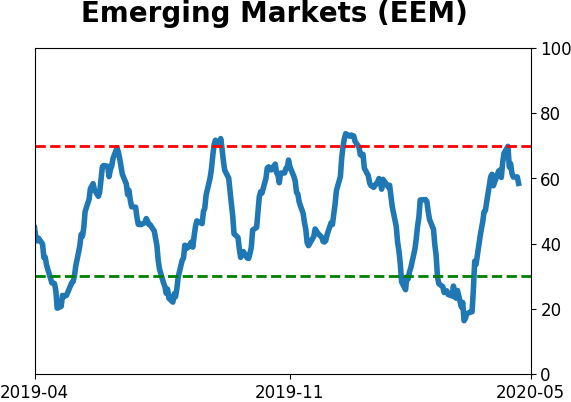
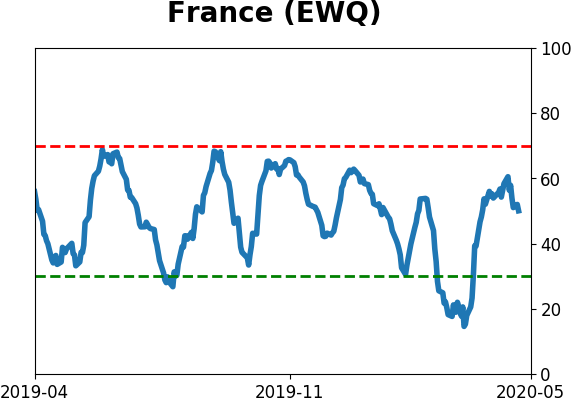
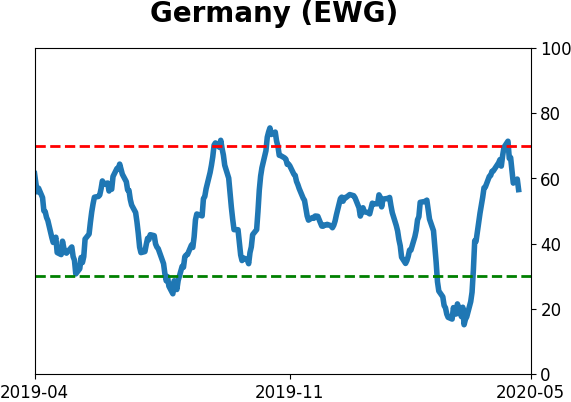
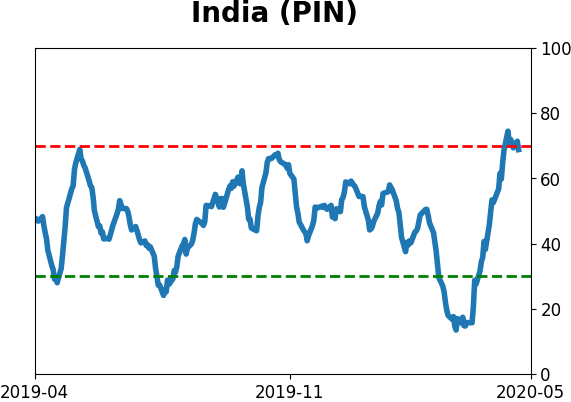
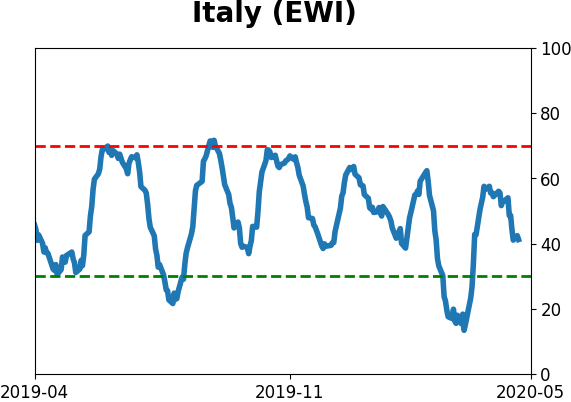
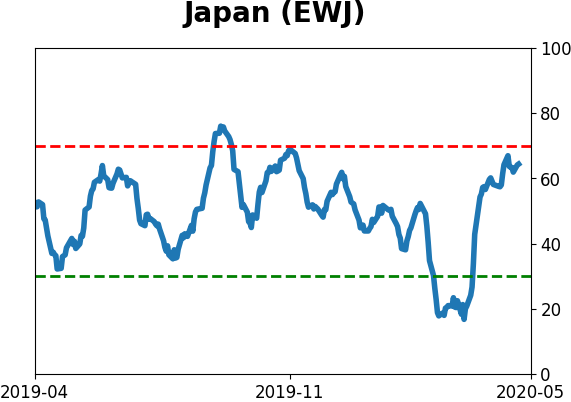
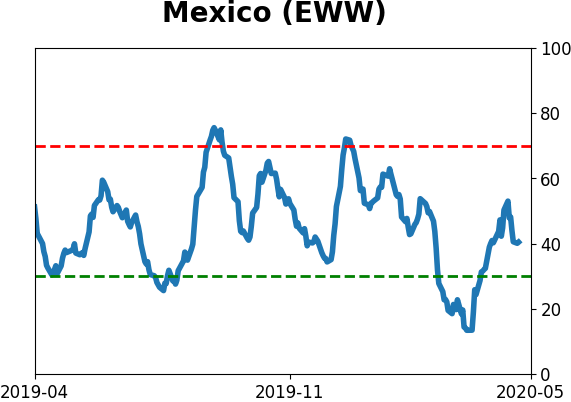
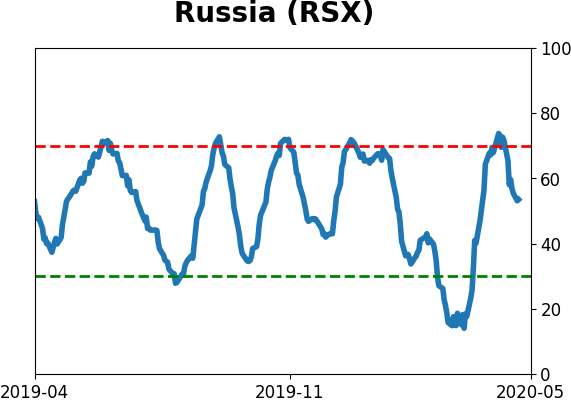
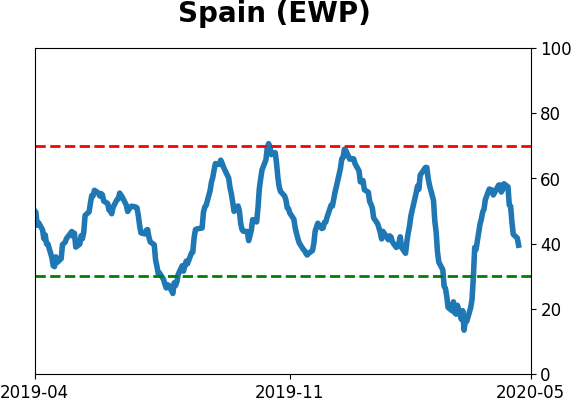
Country ETF's - 10-Day Moving Average
|
|
|
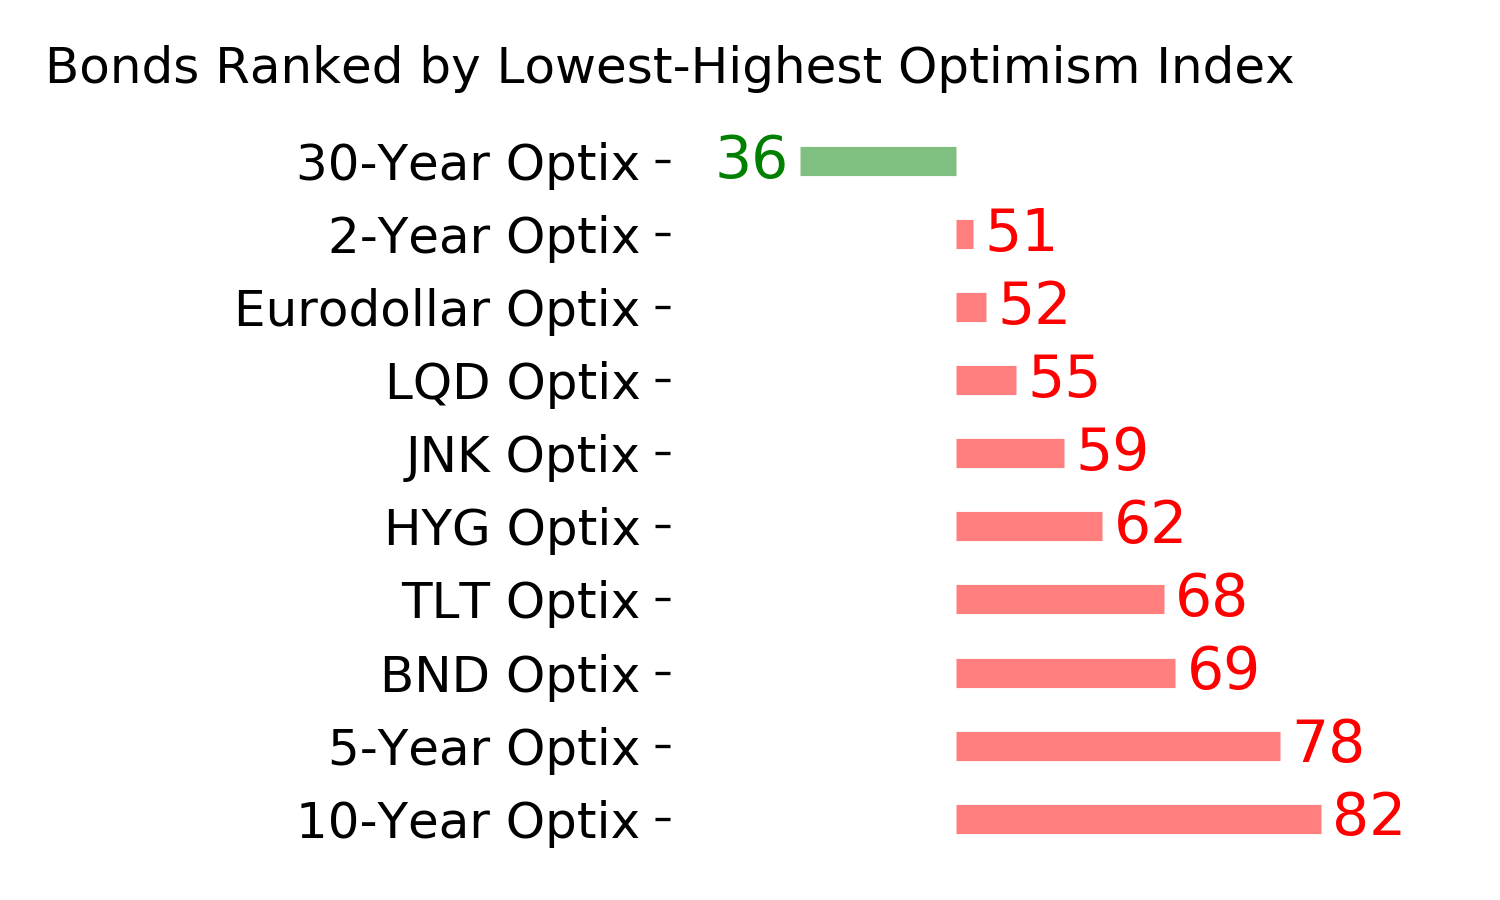
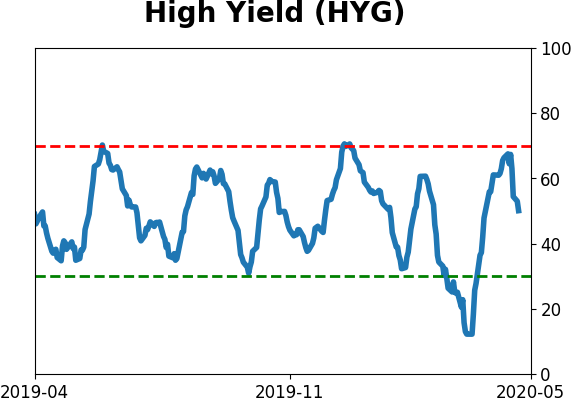
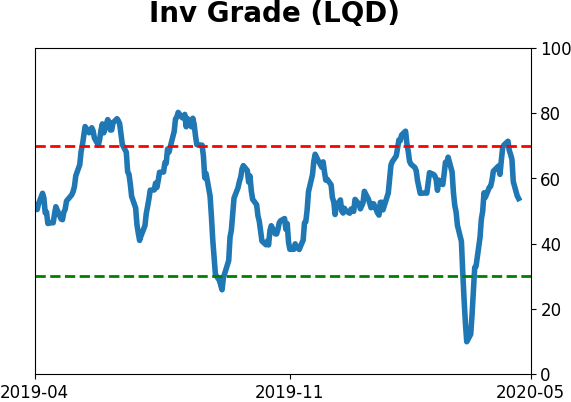
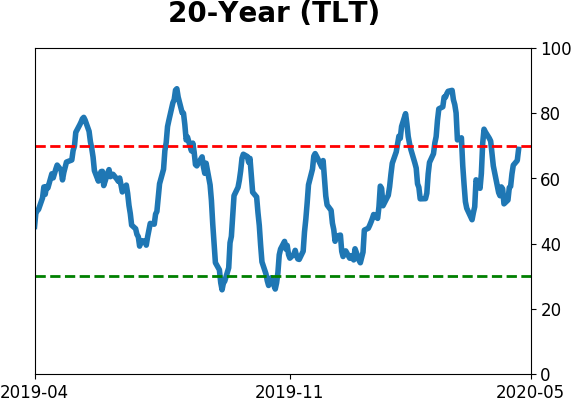
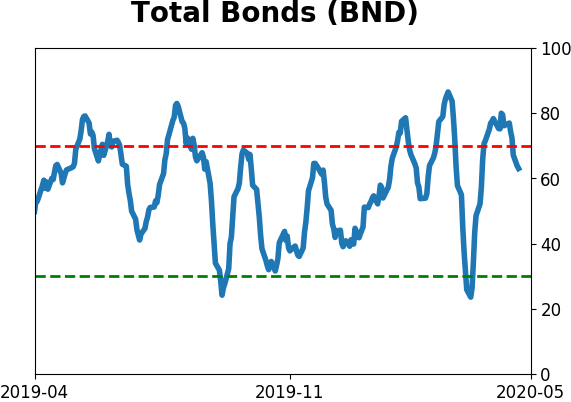
Bond ETF's - 10-Day Moving Average
|
|
|
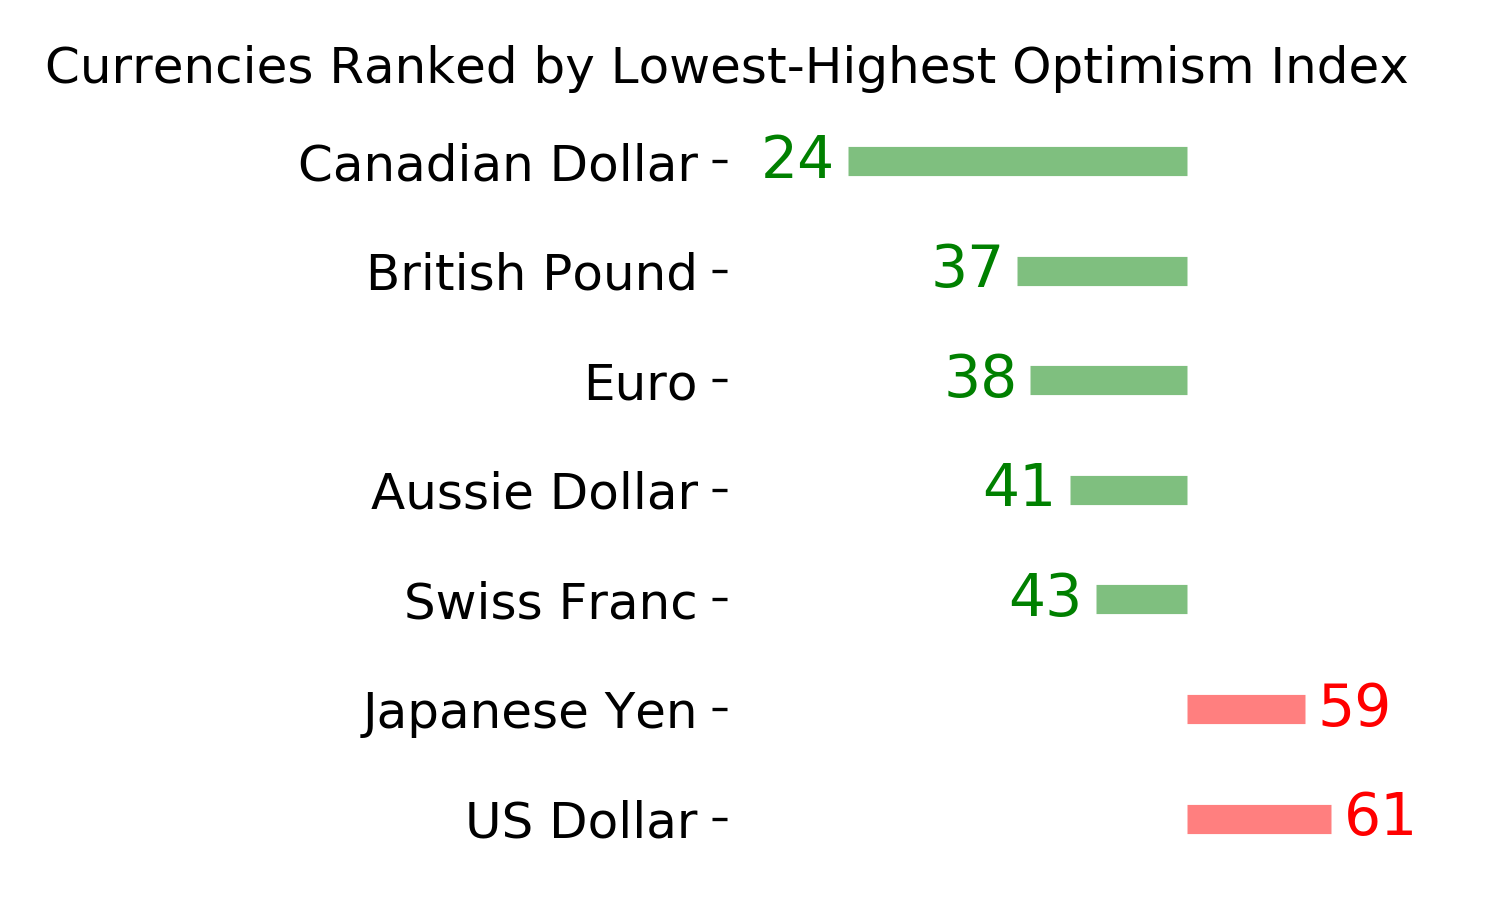
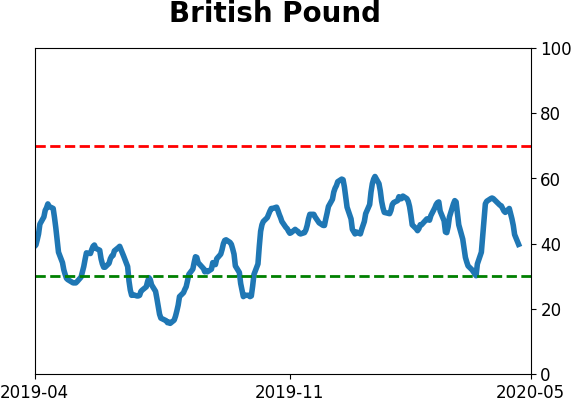
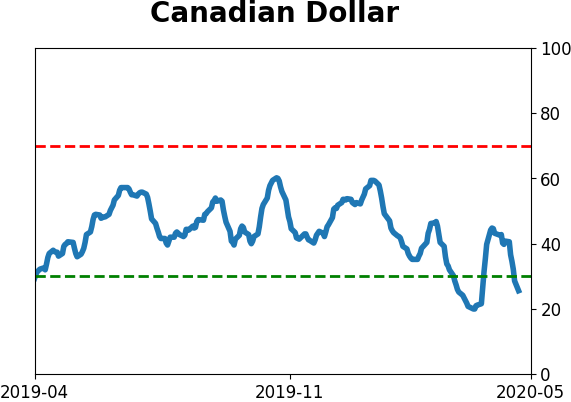
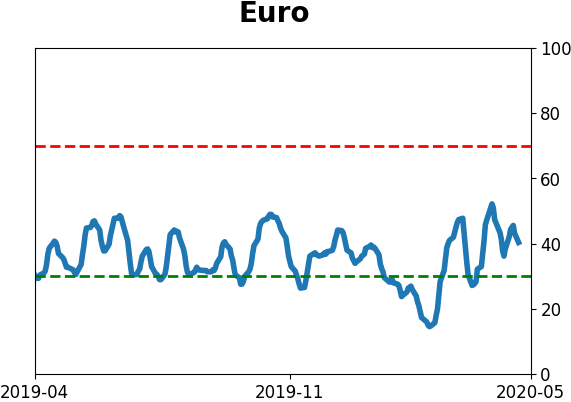
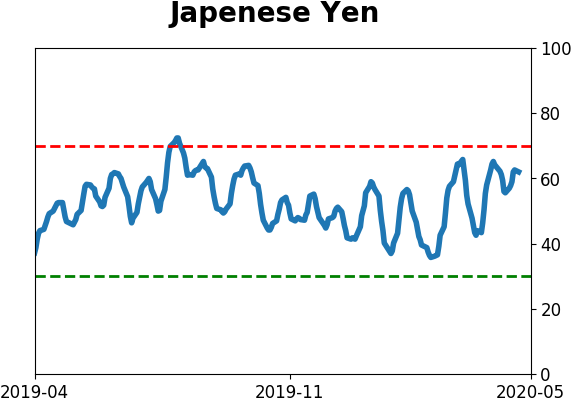
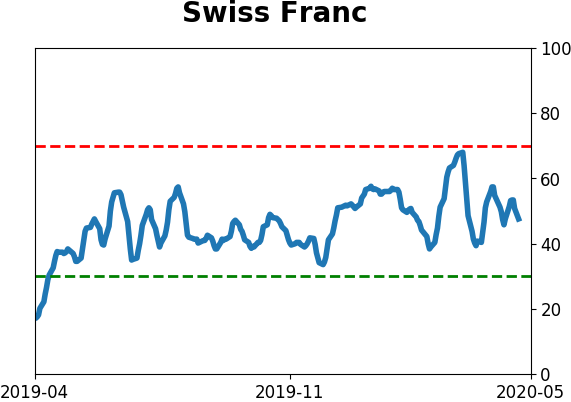
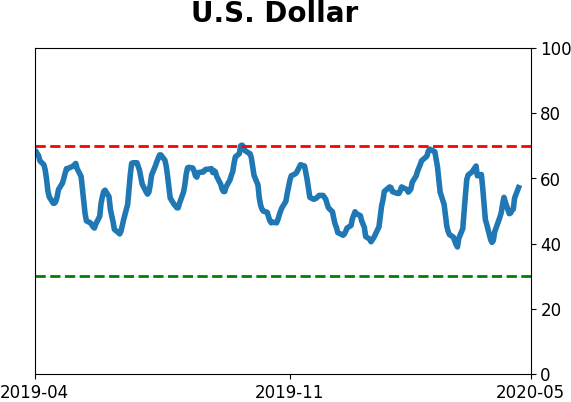
Currency ETF's - 5-Day Moving Average
|
|
|
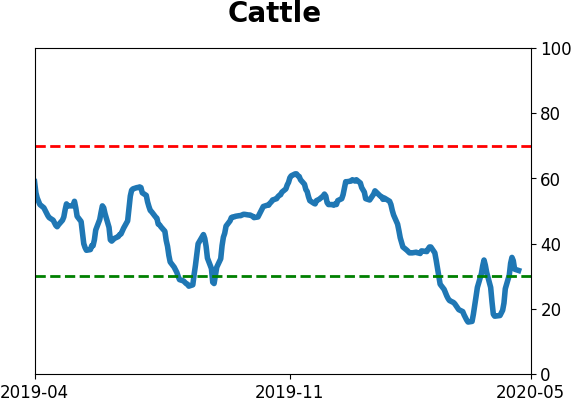
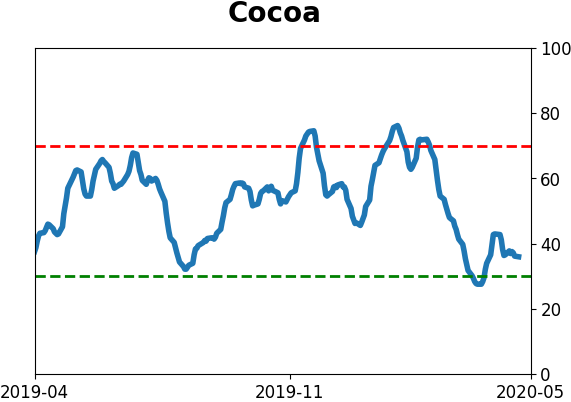
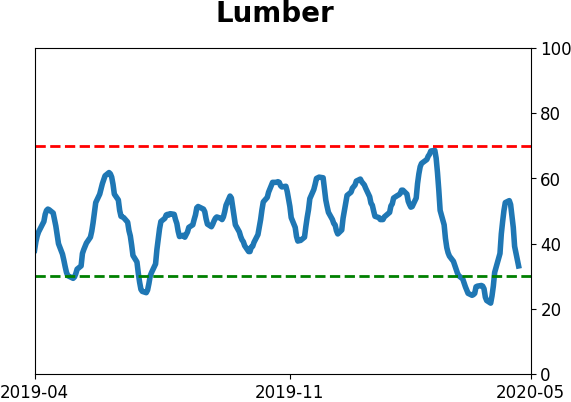
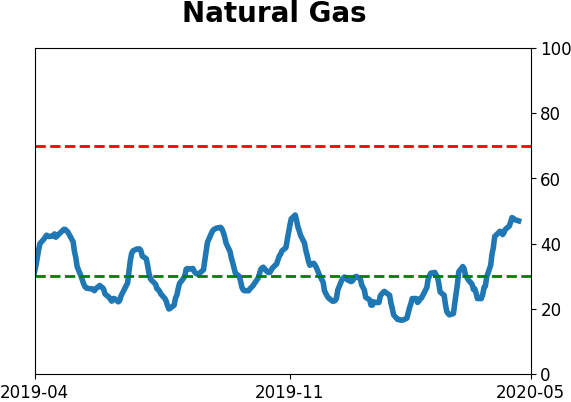
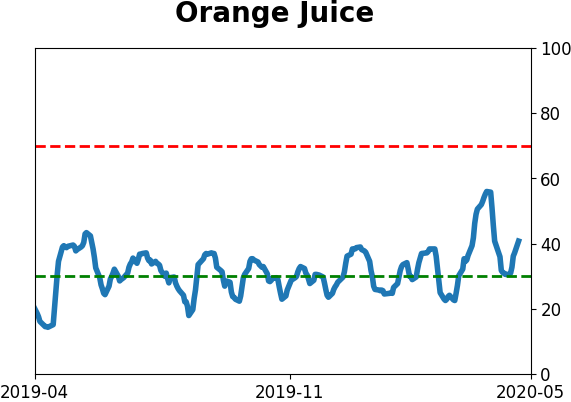
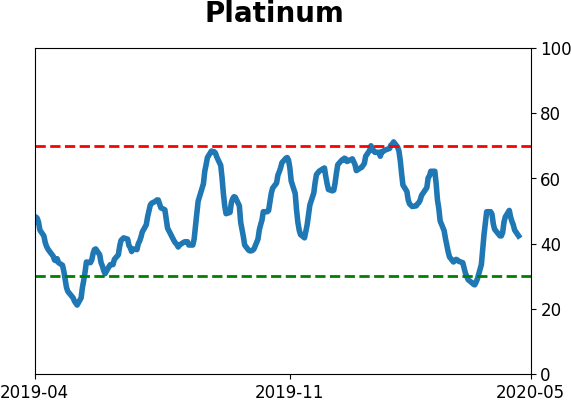
Commodity ETF's - 5-Day Moving Average
|
|