Data &
Technology
Research
Reports
Report Solutions
Reports Library
Actionable
Strategies
Free
Resources
Simple Backtest Calculator
Simple Seasonality Calculator
The Kelly Criterion Calculator
Sentiment Geo Map
Public Research Reports
Free Webinar
Pricing
Company
About
Meet Our Team
In the News
Testimonials
Client Success Stories
Contact
Log inLoginSign up
< BACK TO ALL REPORTS

Cyclical stocks transition to uptrends

Dean Christians
2023-01-18
The percentage of stocks with their respective 50-day average > 150-day average for cyclical sectors cycled from < 20% to > 60% for the 18th time since 1962. After similar price trend shifts, the broad market enjoyed impressive returns.

Key points:

  • Stocks within cyclical sectors transitioned from downtrends to uptrends 
  • After similar price trend shifts, the broad market enjoyed impressive returns
  • Historically, equal-weighted cyclical sectors tended to outperform cap-weighted ones

Most cyclical sector stocks are now in an uptrend

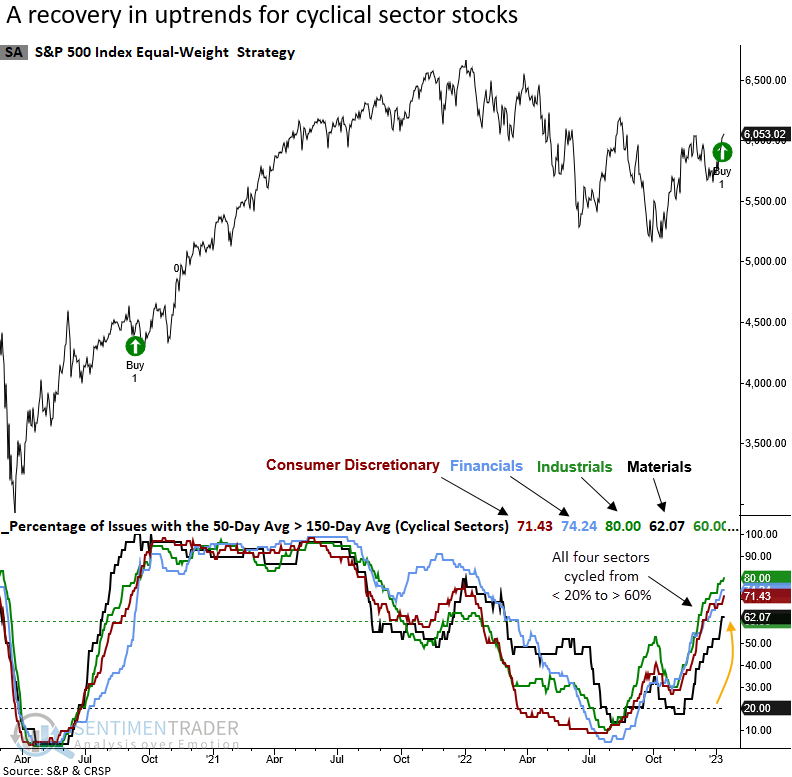
In the last few months, we've shared several research notes highlighting impressive recoveries in various cyclical/value-oriented sectors like Industrials, Financials, and Materials. And last week, the Consumer Discretionary sector turned the corner.

Until now, most studies relied on short to medium-term indicators. However, that's now starting to change as longer-duration measures are improving.

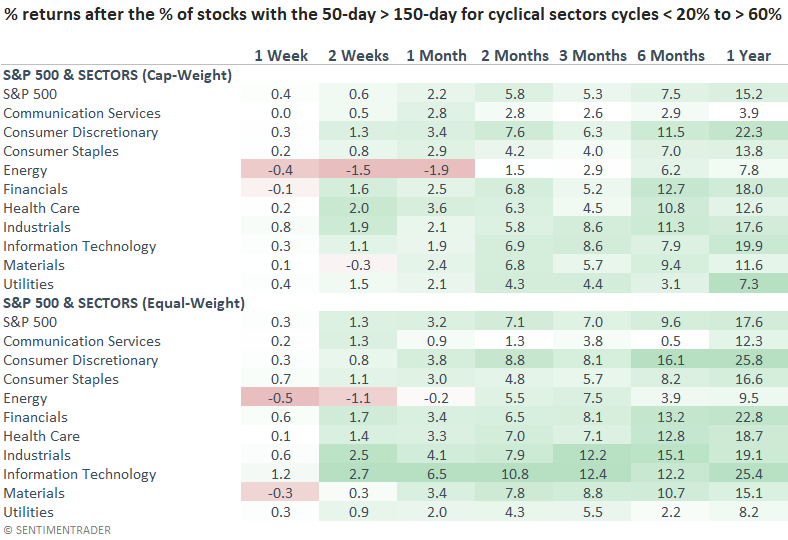
The percentage of issues with their respective 50-day average > 150-day average for cyclical sectors cycled from < 20% to > 60%, triggering a buy signal for the broad market for only the 18th time in more than 60 years. 

Cyclical sectors include Consumer Discretionary, Financials, Industrials, and Materials. 

Similar price trend recoveries in cyclical sectors preceded excellent results

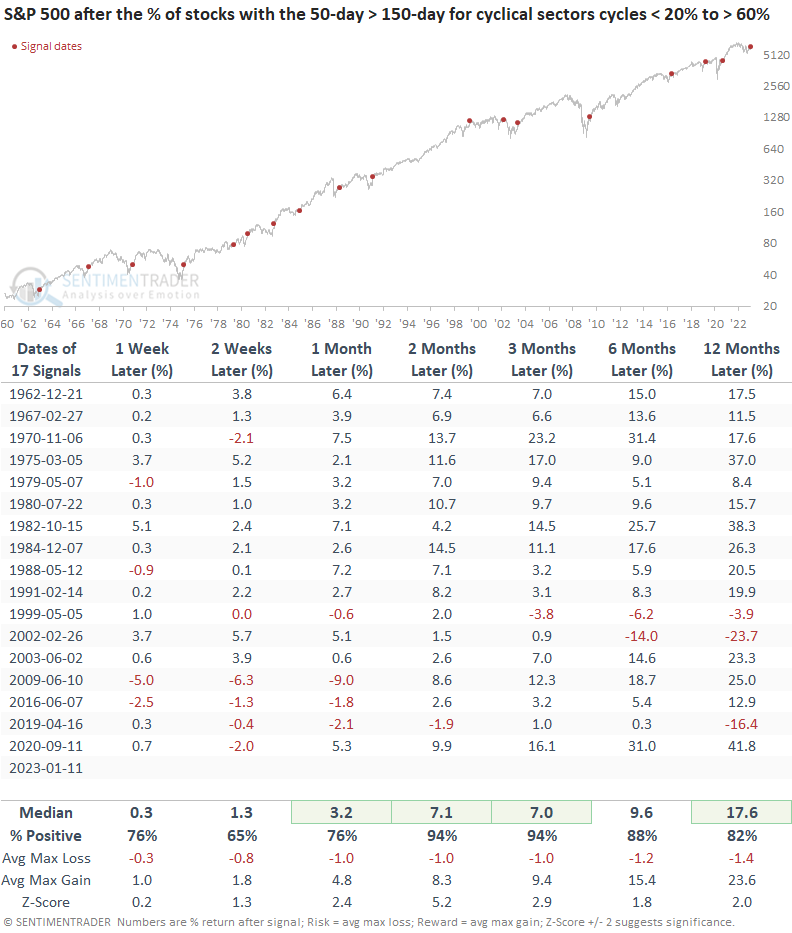
When the percentage of stocks with their respective 50-day average > 150-day average for cyclical sectors cycles from < 20% to > 60%, forward returns for the equal-weighted S&P 500 index were excellent across all time frames. The signal shows a solid risk/reward profile, with relatively benign drawdowns in the first three months, even for the whipsaw instance in 2002. 

The signal marked the end of 20%+ drawdowns in 8 out of 9 cases, with 2002 being the exception.

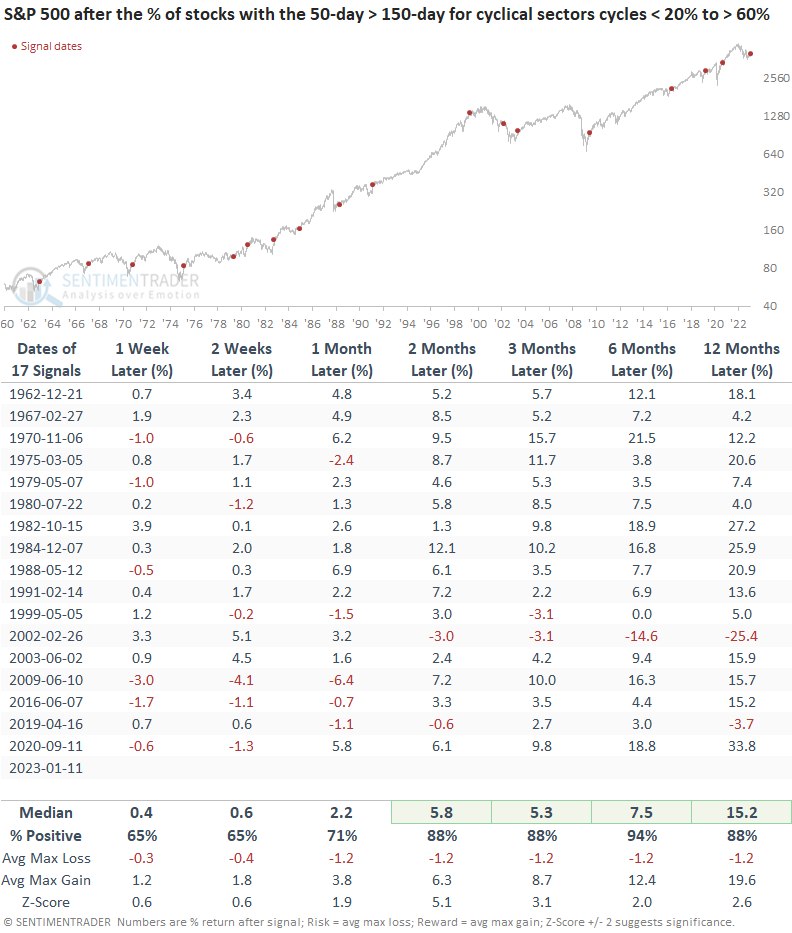
Performance for the cap-weighted S&P 500 index looks equally impressive. Drawdowns across short to medium-term time frames were slightly less than the equal-weighted version.

Typically, the recovery in cyclical sector stocks foreshadows an end to significant drawdowns. When it does, passive investors would have been rewarded by allocating to the equal-weighted S&P 500 index, as it tends to outperform the cap-weighted index up to a year later. 

If the recovery turns out to be a false signal, like in 2002, the equal-weighted S&P 500 still outperformed the cap-weighted version.

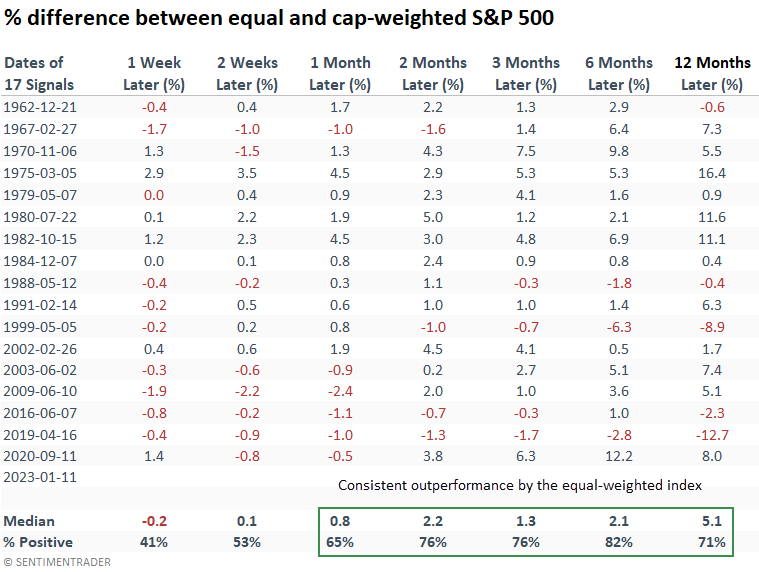
When I apply the signals to the two different index weighting methodologies, the equal-weighted cyclical sectors consistently outperform the cap-weighted ones across most time frames.

While historical performance trends are lovely, one should always utilize a comparative relative strength indicator to see if the current environment aligns with historical precedents.

What the research tells us...

When markets transition from a bear to a bull environment, it's imperative to see longer-duration indicators confirm the message from short to medium-term ones. Otherwise, the odds of a false signal are greater, which was the case in 2022. So, with the percentage of stocks with their respective 50-day average > 150-day average for cyclical sectors cycling from < 20% to > 60%, the evidence is starting to build in favor of a new bull market. However, we need to see other long-term trend measures improve. Stay tuned. 

Sorry, you don't have access to this report

Upgrade your subscription plan to get access
Go to Dasboard
DATA &
TECHnologies
IndicatorEdge
‍
BackTestEdge
‍
Other Tools
‍
DataEdge API
RESEARCH
reports
Research Solution
‍
Reports Library
‍
actionable
Strategies
Trading Strategies
‍
Smart Stock Scanner
‍
FREE
RESOUrCES
Simple Backtest
Calculator
Simple Seasonality
Calculator
The Kelly Criterion
Calculator
Sentiment Geo Map
‍
Public Research Reports
‍
Free Webinar
COMPANY
‍
About
‍
Meet our Team
‍
In the News
‍
Testimonials
‍
Client Success Stories
Pricing
Bundle pricing
‍
Announcements
‍
FAQ
© 2024 Sundial Capital Research Inc. All rights reserved.
Setsail Marketing
TermsPrivacyAffiliate Program
Risk Disclosure: Futures and forex trading contains substantial risk and is not for every investor. An investor could potentially lose all or more than the initial investment. Risk capital is money that can be lost without jeopardizing ones’ financial security or life style. Only risk capital should be used for trading and only those with sufficient risk capital should consider trading. Past performance is not necessarily indicative of future results.

Hypothetical Performance Disclosure: Hypothetical performance results have many inherent limitations, some of which are described below. No representation is being made that any account will or is likely to achieve profits or losses similar to those shown; in fact, there are frequently sharp differences between hypothetical performance results and the actual results subsequently achieved by any particular trading program. One of the limitations of hypothetical performance results is that they are generally prepared with the benefit of hindsight. In addition, hypothetical trading does not involve financial risk, and no hypothetical trading record can completely account for the impact of financial risk of actual trading. for example, the ability to withstand losses or to adhere to a particular trading program in spite of trading losses are material points which can also adversely affect actual trading results. There are numerous other factors related to the markets in general or to the implementation of any specific trading program which cannot be fully accounted for in the preparation of hypothetical performance results and all which can adversely affect trading results.

Testimonial Disclosure: Testimonials appearing on this website may not be representative of other clients or customers and is not a guarantee of future performance or success.