
Crude oil's negative trend and seasonal headwind

Key points:
- October through January has historically been an unfavorable period for crude oil
- Adding a simple price trend filter magnifies the results
- Crude oil appears destined to enter the unfavorable seasonal period already in an established downtrend
Crude oil October through January
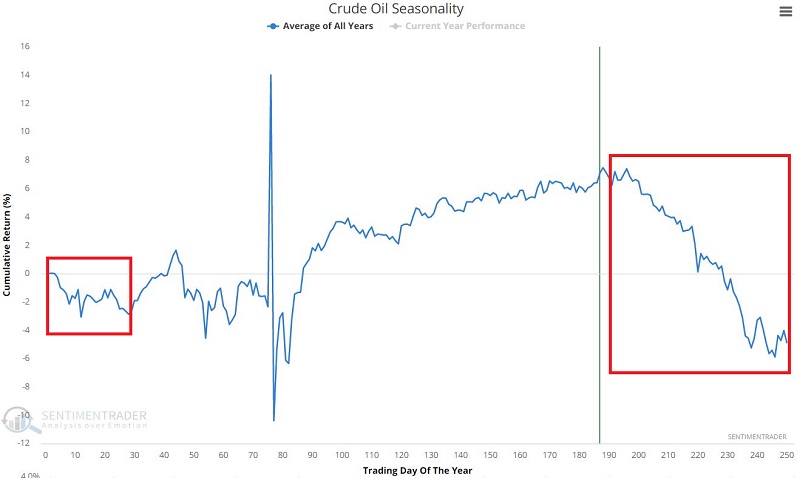
The chart below displays the annual seasonal trend for crude oil futures. Note the sharp drop-off in the fourth quarter of the year (you can ignore the weird spikes between days #70-80).
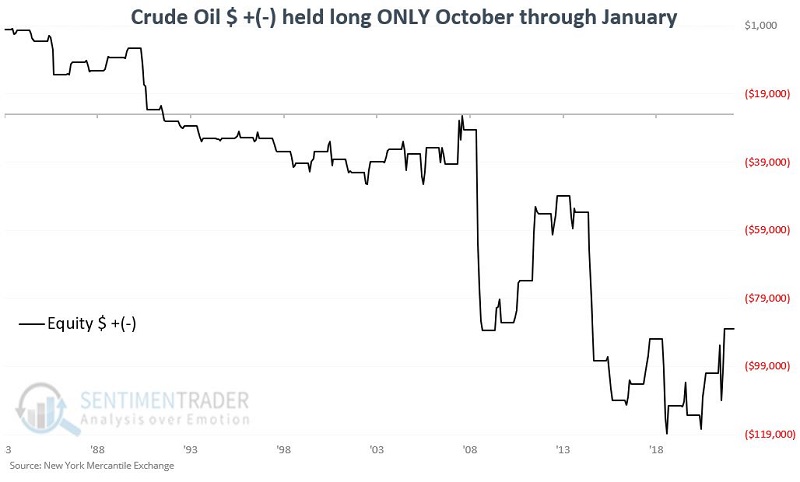
The chart below displays an equity curve of holding a long position in crude oil futures from October through January each year since 1983. A one-point movement in the price of a contract equals a $1,000 change in contract value.
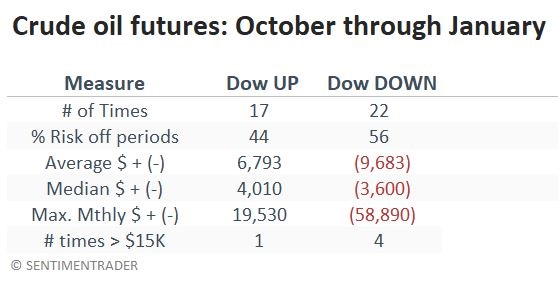
The table below summarizes crude oil futures performance during these windows. The contract lost value most years during these stretches, but more notably, there was a tendency to see big losses rather than big gains.
Adding in a price filter
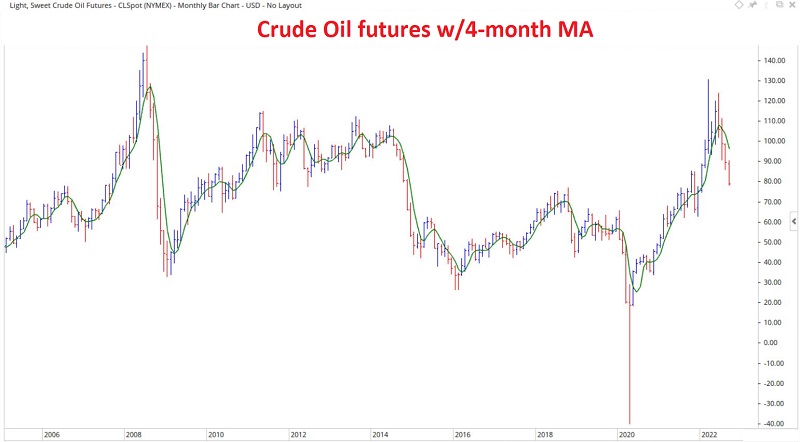
For our filter, we will compare the month-end price for crude oil to its four-month moving average. If the month-end close is above the four-month moving average, the price trend is favorable; if below, unfavorable.
The chart below (courtesy of Optuma) displays crude oil spot month futures with a four-month moving average. Note at the far right that the price is currently well below the moving average.
Combining trend and seasonality
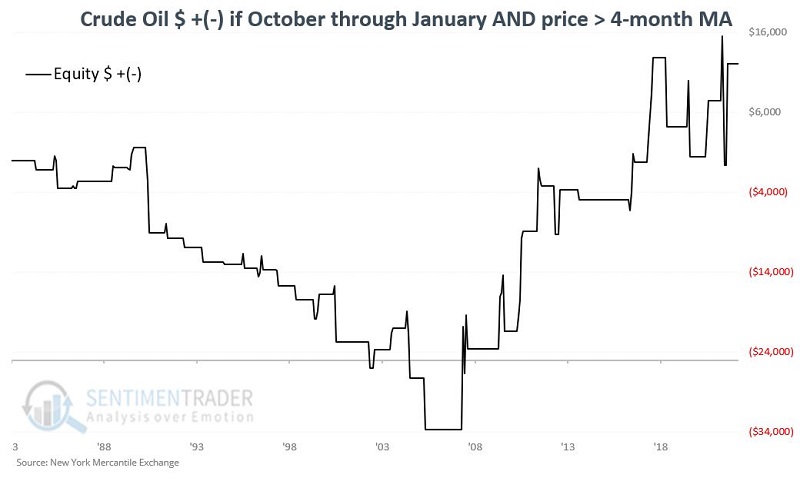
The chart below displays the cumulative dollar return for crude oil futures if held long only when the current month is October, November, December, or January, and crude oil closed the previous month above its four-month moving average.
The results were consistently bearish through 2006 and have been primarily bullish since. The net hypothetical result is a gain of $12,060.
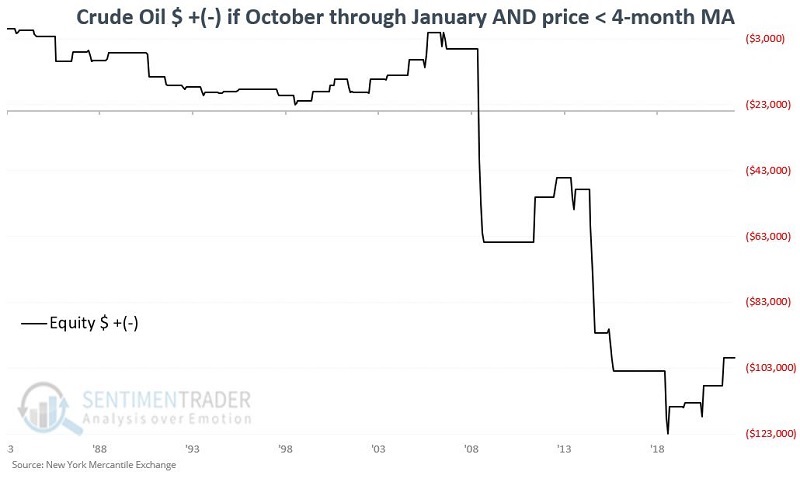
Contrast that to the chart below, which shows the return if held long during those four months but crude oil closed the previous month below its four-month moving average.
The results were essentially neutral through 2006 but have been decisively bearish since. The net hypothetical result is a loss of -$99,200.
Barring a significant rally, crude oil will begin the month of October 2022 with price in a downtrend, suggesting a bearish setup.
What the research tells us…
The trend for crude oil when the price is below the four-month moving average from October through January has been decidedly unfavorable over the past sixteen years. With a bearish configuration setting for the end of September, this history suggests that crude oil traders remain cautious.
There are no guarantees - the odds of success are not much different than a coin flip. The critical concern is that when crude oil does follow through to the downside during an unfavorable month, the results have often been devastating, with massive losses being not uncommon.