Data &
Technology
Research
Reports
Report Solutions
Reports Library
Actionable
Strategies
Free
Resources
Simple Backtest Calculator
Simple Seasonality Calculator
The Kelly Criterion Calculator
Sentiment Geo Map
Public Research Reports
Free Webinar
Pricing
Company
About
Meet Our Team
In the News
Testimonials
Client Success Stories
Contact
Log inLoginSign up
< BACK TO ALL REPORTS

Buyers Make Another Save with Breadth Thrust

Jason Goepfert
2021-08-25
For the past 3 sessions, more than 75% of volume on the NYSE flowed into advancing securities. With the S&P 500 sitting at a 52-week high, its the first time we've seen a thrust like this since 1991.

Just leave it to this market. Unbelievable.

Seemingly whenever something negative triggers, buyers show up immediately. We saw on Monday that the S&P 500's approach to its former high was accompanied by a negative McClellan Summation Index and more 52-week lows than highs on the NYSE.

No matter, stocks continued to rise, and breadth turned around. The switch was dramatic enough that more than 75% of volume on the NYSE flowed into advancing securities. It happened on Monday, too. And Friday.

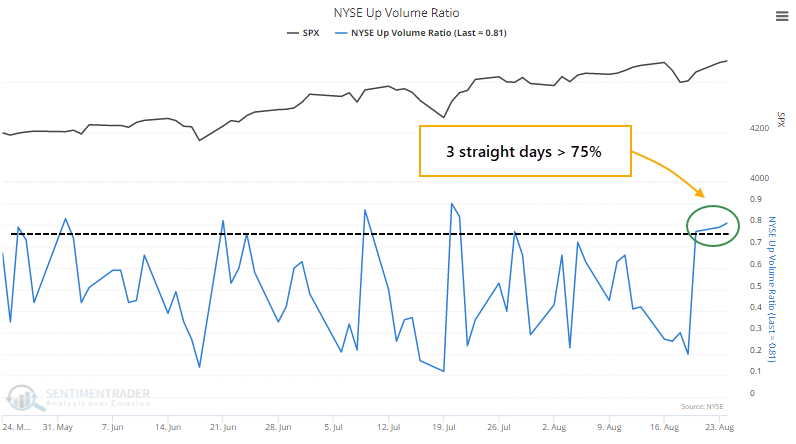
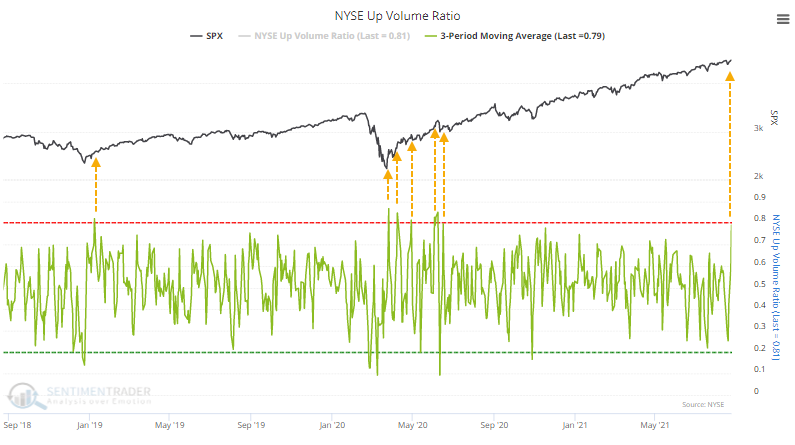
Over the past three years, this is only the 3rd distinct time that the 3-day average of NYSE Up Volume has neared 80% (lumping together the handful of post-pandemic thrusts as one).

THRUSTS ARE ALMOST ALWAYS A GOOD SIGN

Since 1928, there have been 86 non-overlapping periods with 3 consecutive days of 75% or greater Up Volume. Like we've seen so often, the primary highlight of thrusts like this is a remarkably positive risk versus reward ratio over the medium- to long-term.

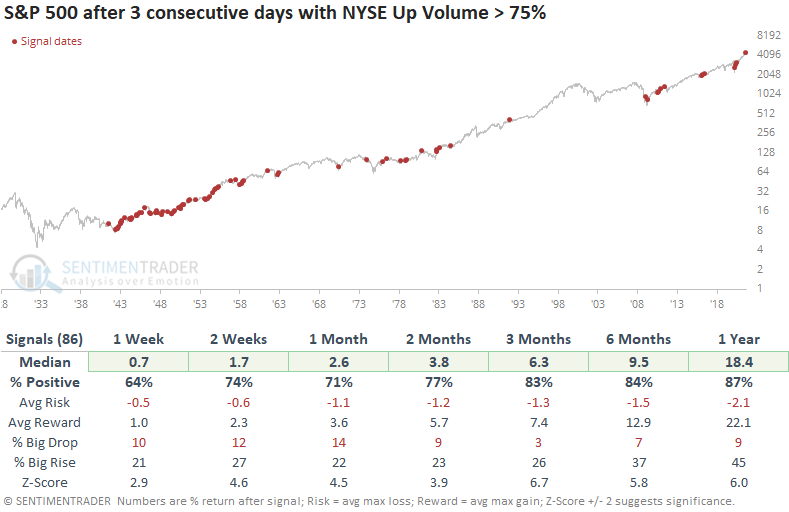
Across all time frames, the S&P 500's average return was well above random, the average drawdown (risk) was a small fraction of drawup (reward), and there was a much higher probability of a big rise than a big drop.

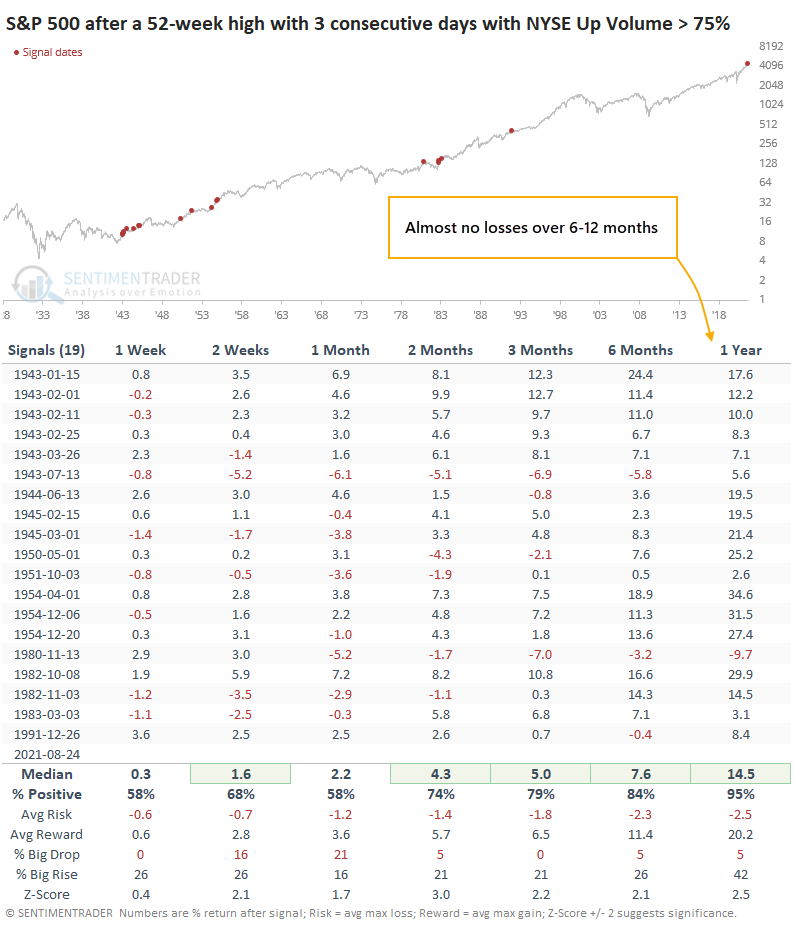
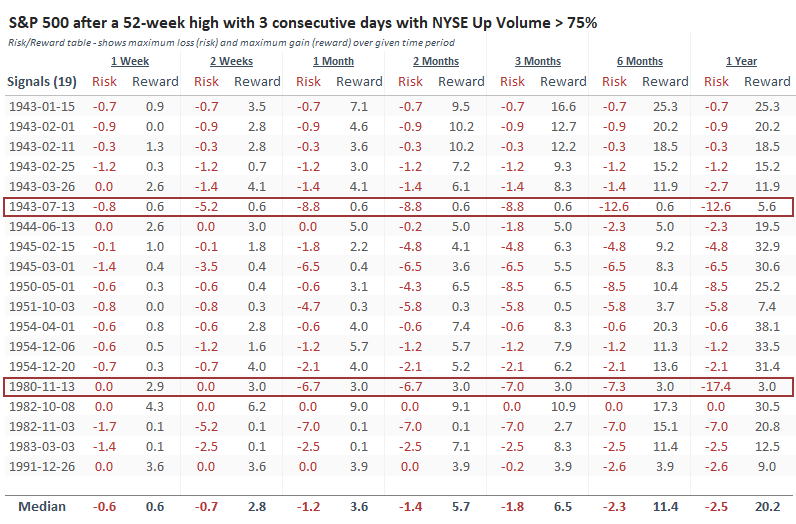
Often, we see thrusts like this when coming out of oversold conditions. The last time there were 3 consecutive days with at least 75% Up Volume with the S&P closing at a 52-week high was more than 30 years ago. While it can signal some short-term buying exhaustion (8 of the last 14 signals showed a negative 1-month return), the risk/reward ratio was impressive over the longer-term.

LOW RISK AND HIGH REWARD

One of the primary reasons to be constructive last March (and May and June) was the incessantly positive breadth thrusts that showed consistently positive forward returns.

The Risk/Reward Table of the signals shown in the table above shows just how skewed most of the signals tended to be. There were only two of them that showed consistently more downside than upside in the months ahead.

Once again, buyers have stepped in almost to the day following a dip in some breadth measures like the net percentage of NYSE issues at 52-week highs minus lows. That shows that there is still no change in the character of this market and its participants, and we might as well throw our hands up when trying to determine when any of the negatives might finally matter.

Sorry, you don't have access to this report

Upgrade your subscription plan to get access
Go to Dasboard
DATA &
TECHnologies
IndicatorEdge
‍
BackTestEdge
‍
Other Tools
‍
DataEdge API
RESEARCH
reports
Research Solution
‍
Reports Library
‍
actionable
Strategies
Trading Strategies
‍
Smart Stock Scanner
‍
FREE
RESOUrCES
Simple Backtest
Calculator
Simple Seasonality
Calculator
The Kelly Criterion
Calculator
Sentiment Geo Map
‍
Public Research Reports
‍
Free Webinar
COMPANY
‍
About
‍
Meet our Team
‍
In the News
‍
Testimonials
‍
Client Success Stories
Pricing
Bundle pricing
‍
Announcements
‍
FAQ
© 2024 Sundial Capital Research Inc. All rights reserved.
Setsail Marketing
TermsPrivacyAffiliate Program
Risk Disclosure: Futures and forex trading contains substantial risk and is not for every investor. An investor could potentially lose all or more than the initial investment. Risk capital is money that can be lost without jeopardizing ones’ financial security or life style. Only risk capital should be used for trading and only those with sufficient risk capital should consider trading. Past performance is not necessarily indicative of future results.

Hypothetical Performance Disclosure: Hypothetical performance results have many inherent limitations, some of which are described below. No representation is being made that any account will or is likely to achieve profits or losses similar to those shown; in fact, there are frequently sharp differences between hypothetical performance results and the actual results subsequently achieved by any particular trading program. One of the limitations of hypothetical performance results is that they are generally prepared with the benefit of hindsight. In addition, hypothetical trading does not involve financial risk, and no hypothetical trading record can completely account for the impact of financial risk of actual trading. for example, the ability to withstand losses or to adhere to a particular trading program in spite of trading losses are material points which can also adversely affect actual trading results. There are numerous other factors related to the markets in general or to the implementation of any specific trading program which cannot be fully accounted for in the preparation of hypothetical performance results and all which can adversely affect trading results.

Testimonial Disclosure: Testimonials appearing on this website may not be representative of other clients or customers and is not a guarantee of future performance or success.