
Bulls pull back in time for record breadth week

Key points:
- Two popular sentiment surveys witnessed dramatic drops in bullishness among investors
- After drastic weekly declines in optimism, the S&P 500 has tended to show above-average long-term returns
- That tendency is confirmed after a multi-day stretch with overwhelmingly positive breadth, as happened last week
A drastic shift in sentiment
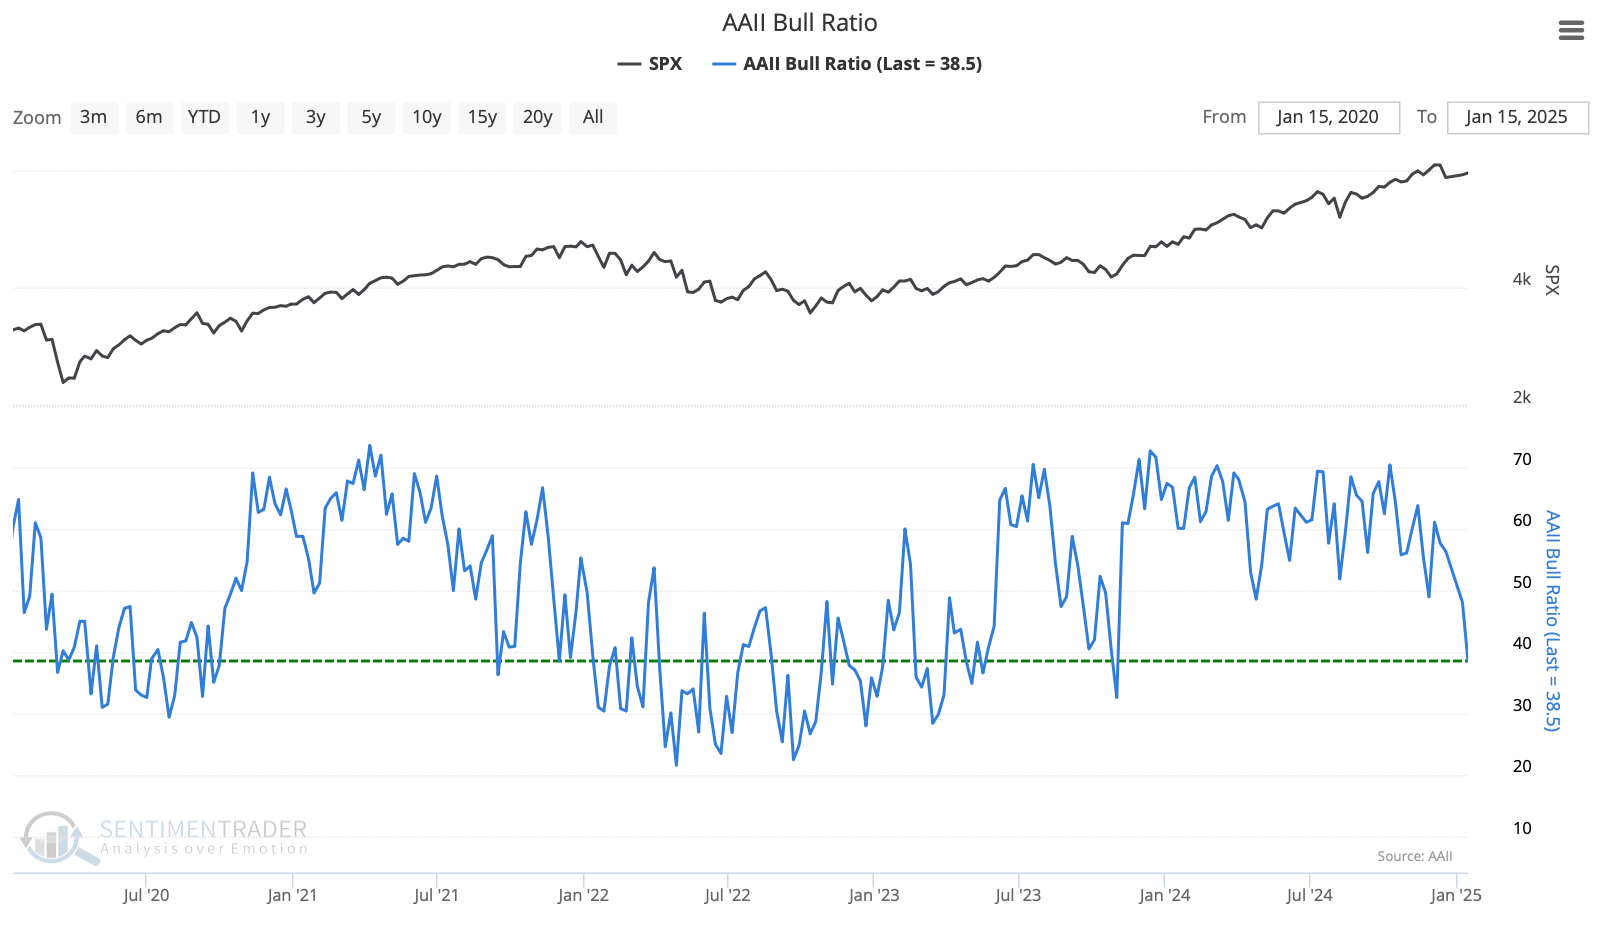
Heading into last week, the pullback in stocks clearly unnerved investors. While mainstay indices like the S&P 500 were holding up relatively well, select pockets were hit hard, drastically impacting surveys.
Individual investors polled by AAII sharply pulled back their expectations of future gains. The Bull Ratio plunged below 40% for only the 2nd time since May 2023.
The investors in that survey are a fickle group, so a 10% decline in the Bull Ratio isn't all that uncommon.
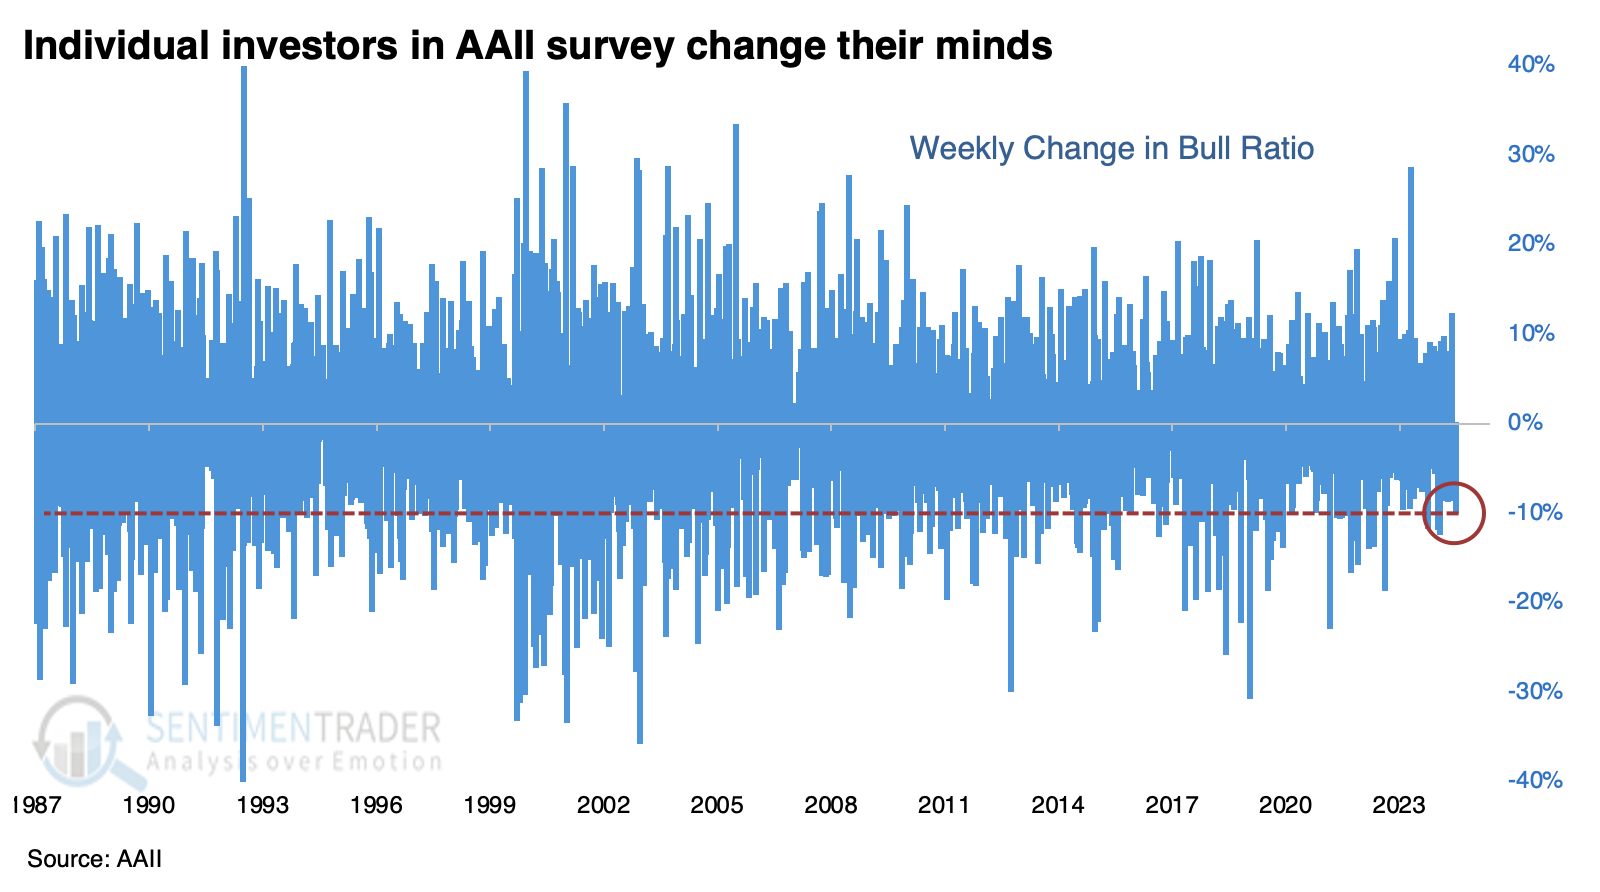
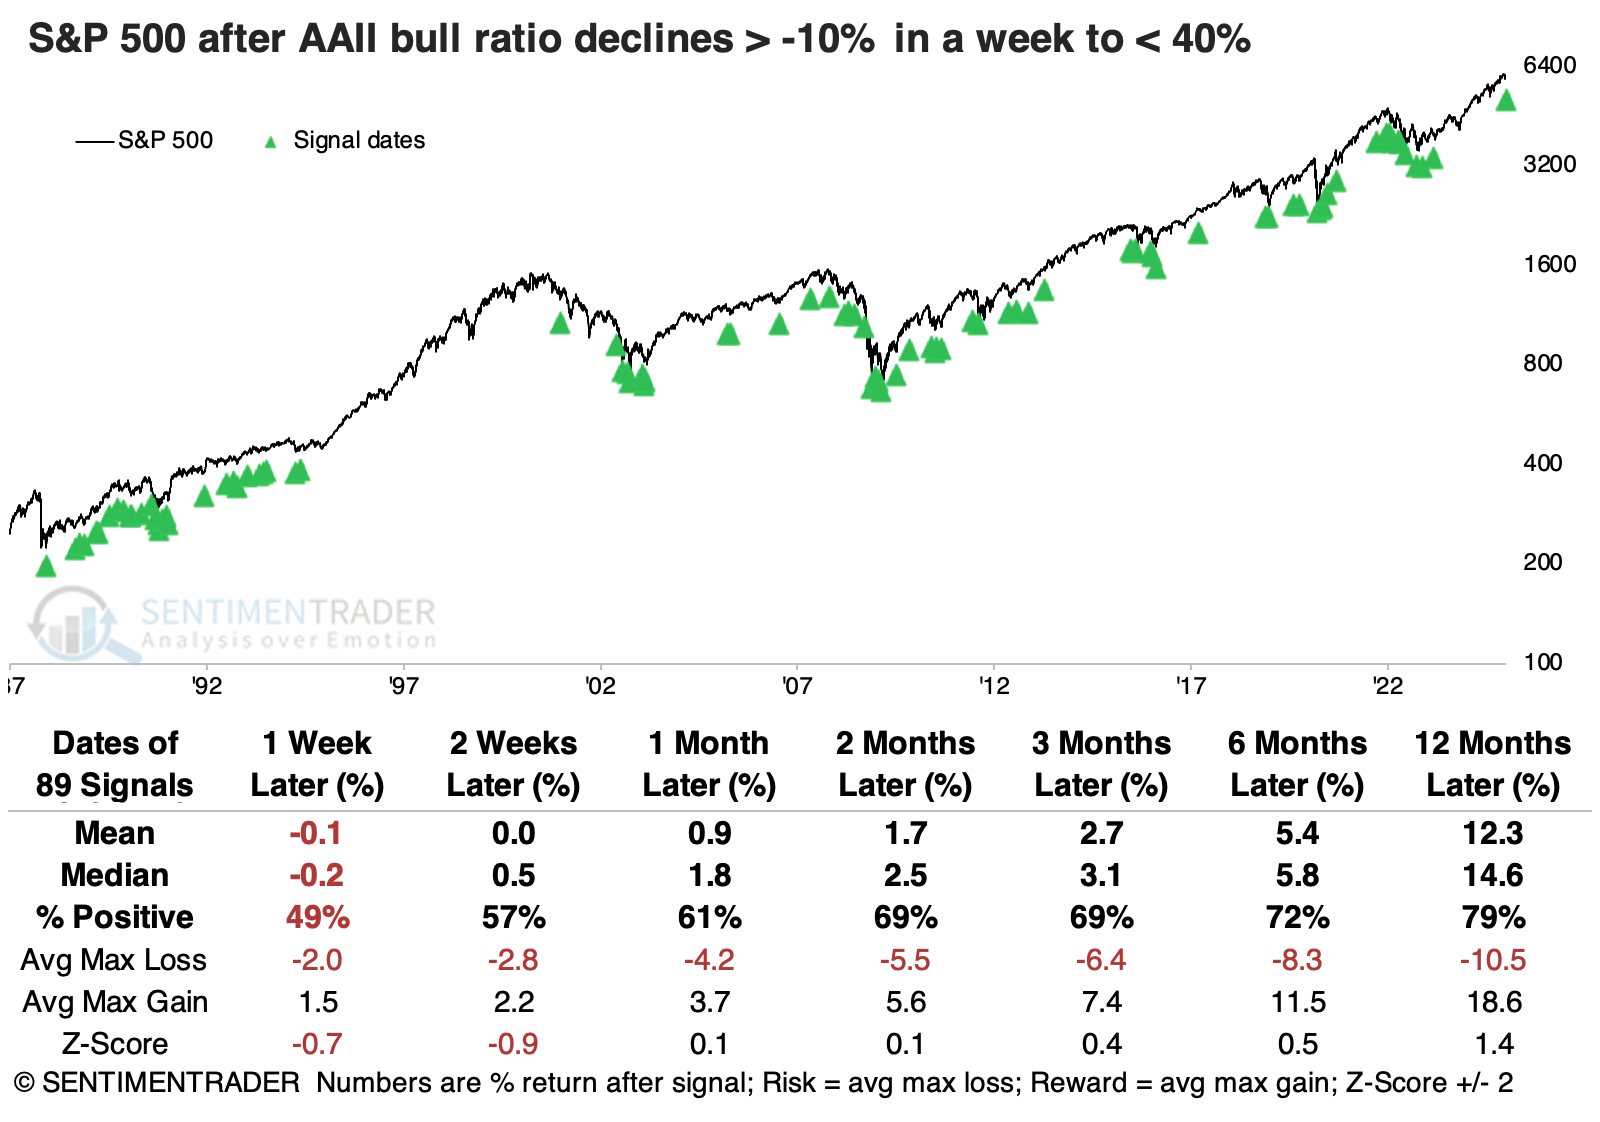
Since the survey's inception in 1989, there have been 90 weeks when the Bull Ratio dropped by 10% or more. These drops didn't have much impact on S&P 500 returns, though declining bullishness is generally a negative sign short-term and a positive sign long-term, as we can see below.
Newsletter writers pulled back, too
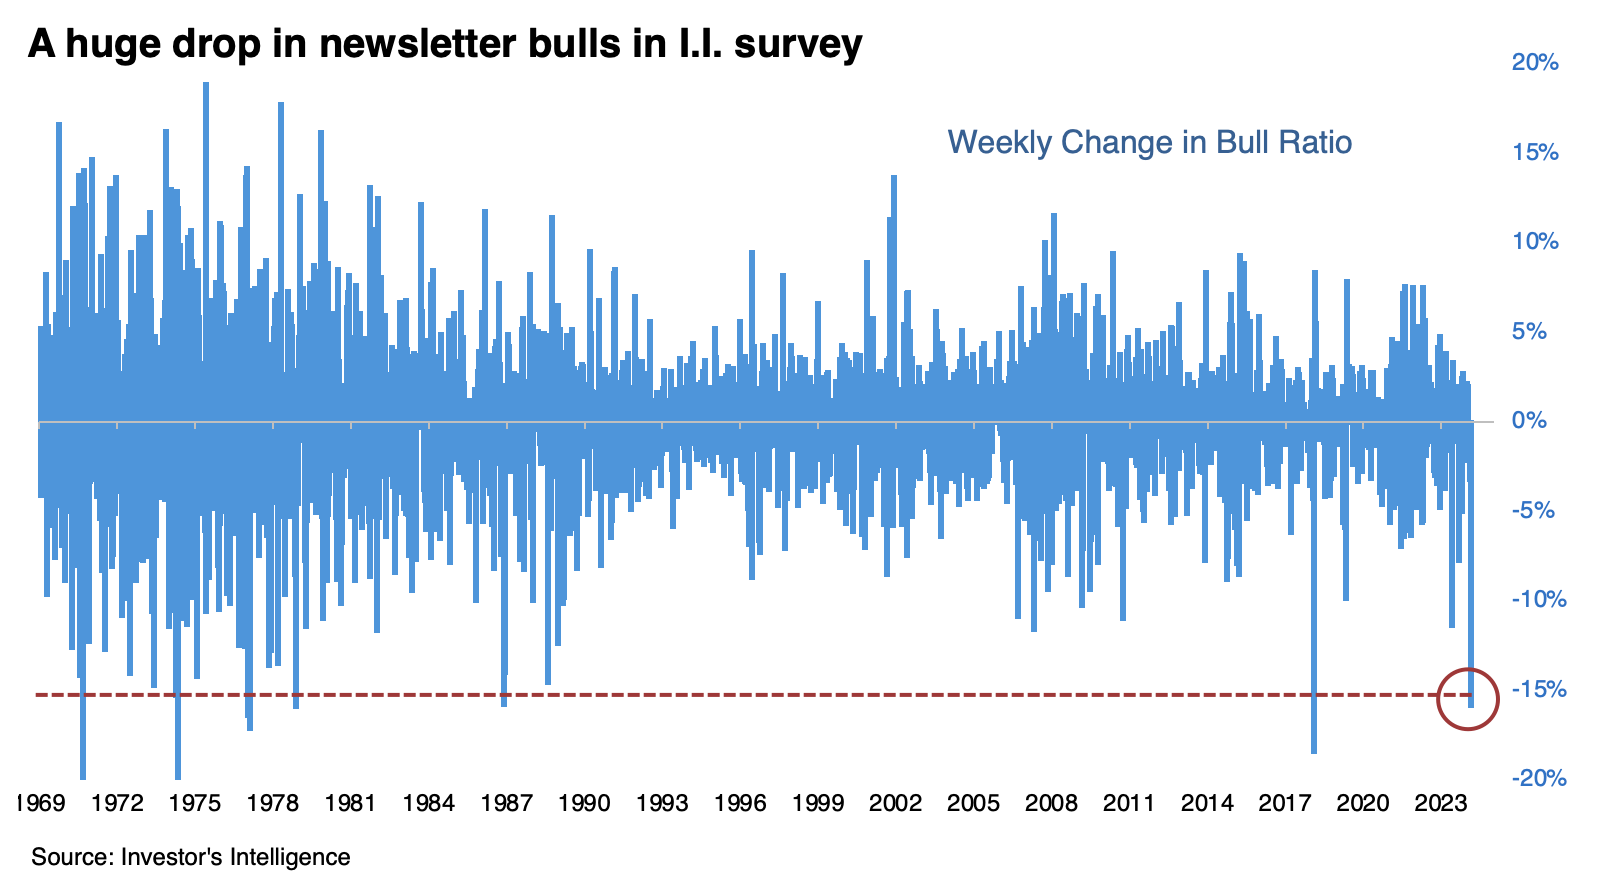
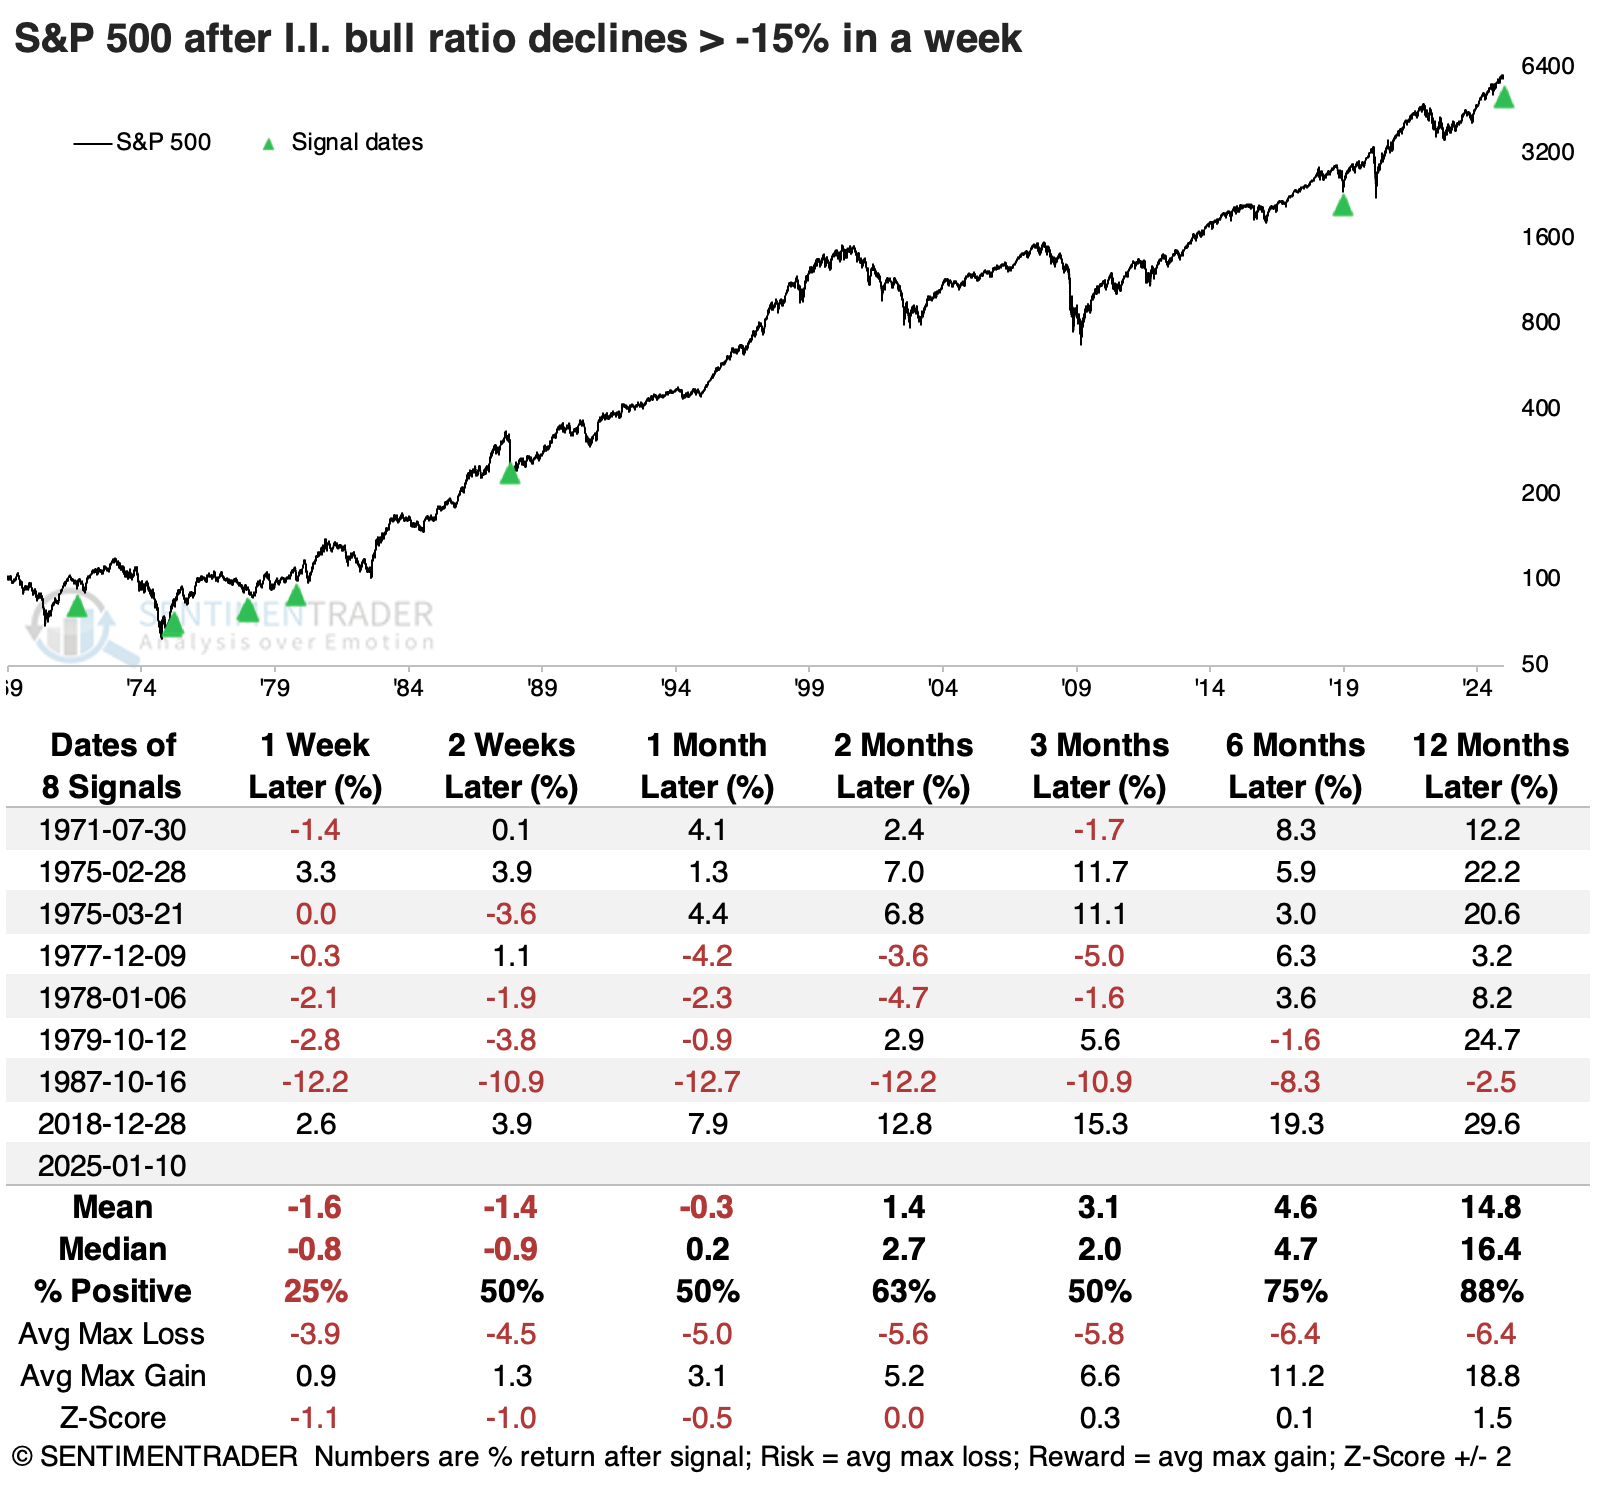
It wasn't just the hyperactive mind-changers in the AAII survey that suddenly became less optimistic. Newsletter writers surveyed by Investor's Intelligence changed their opinions much less drastically...until last week. The 15% drop in that survey's Bull Ratio was among the largest since 1969.
The organization polled fewer surveys before 1987, so it's been even rarer to see such a dramatic one-week shift since then.
Again, we see below that when newsletter writers' bullishness plunged so much in a week, it preceded poor short-term returns and good long-term ones. The current signal is bucking that trend, much like the last one heading into Christmas of 2018 and the one from February 1975. Out of all the signals, those two happened to precede the best, most consistent gains in the months ahead.
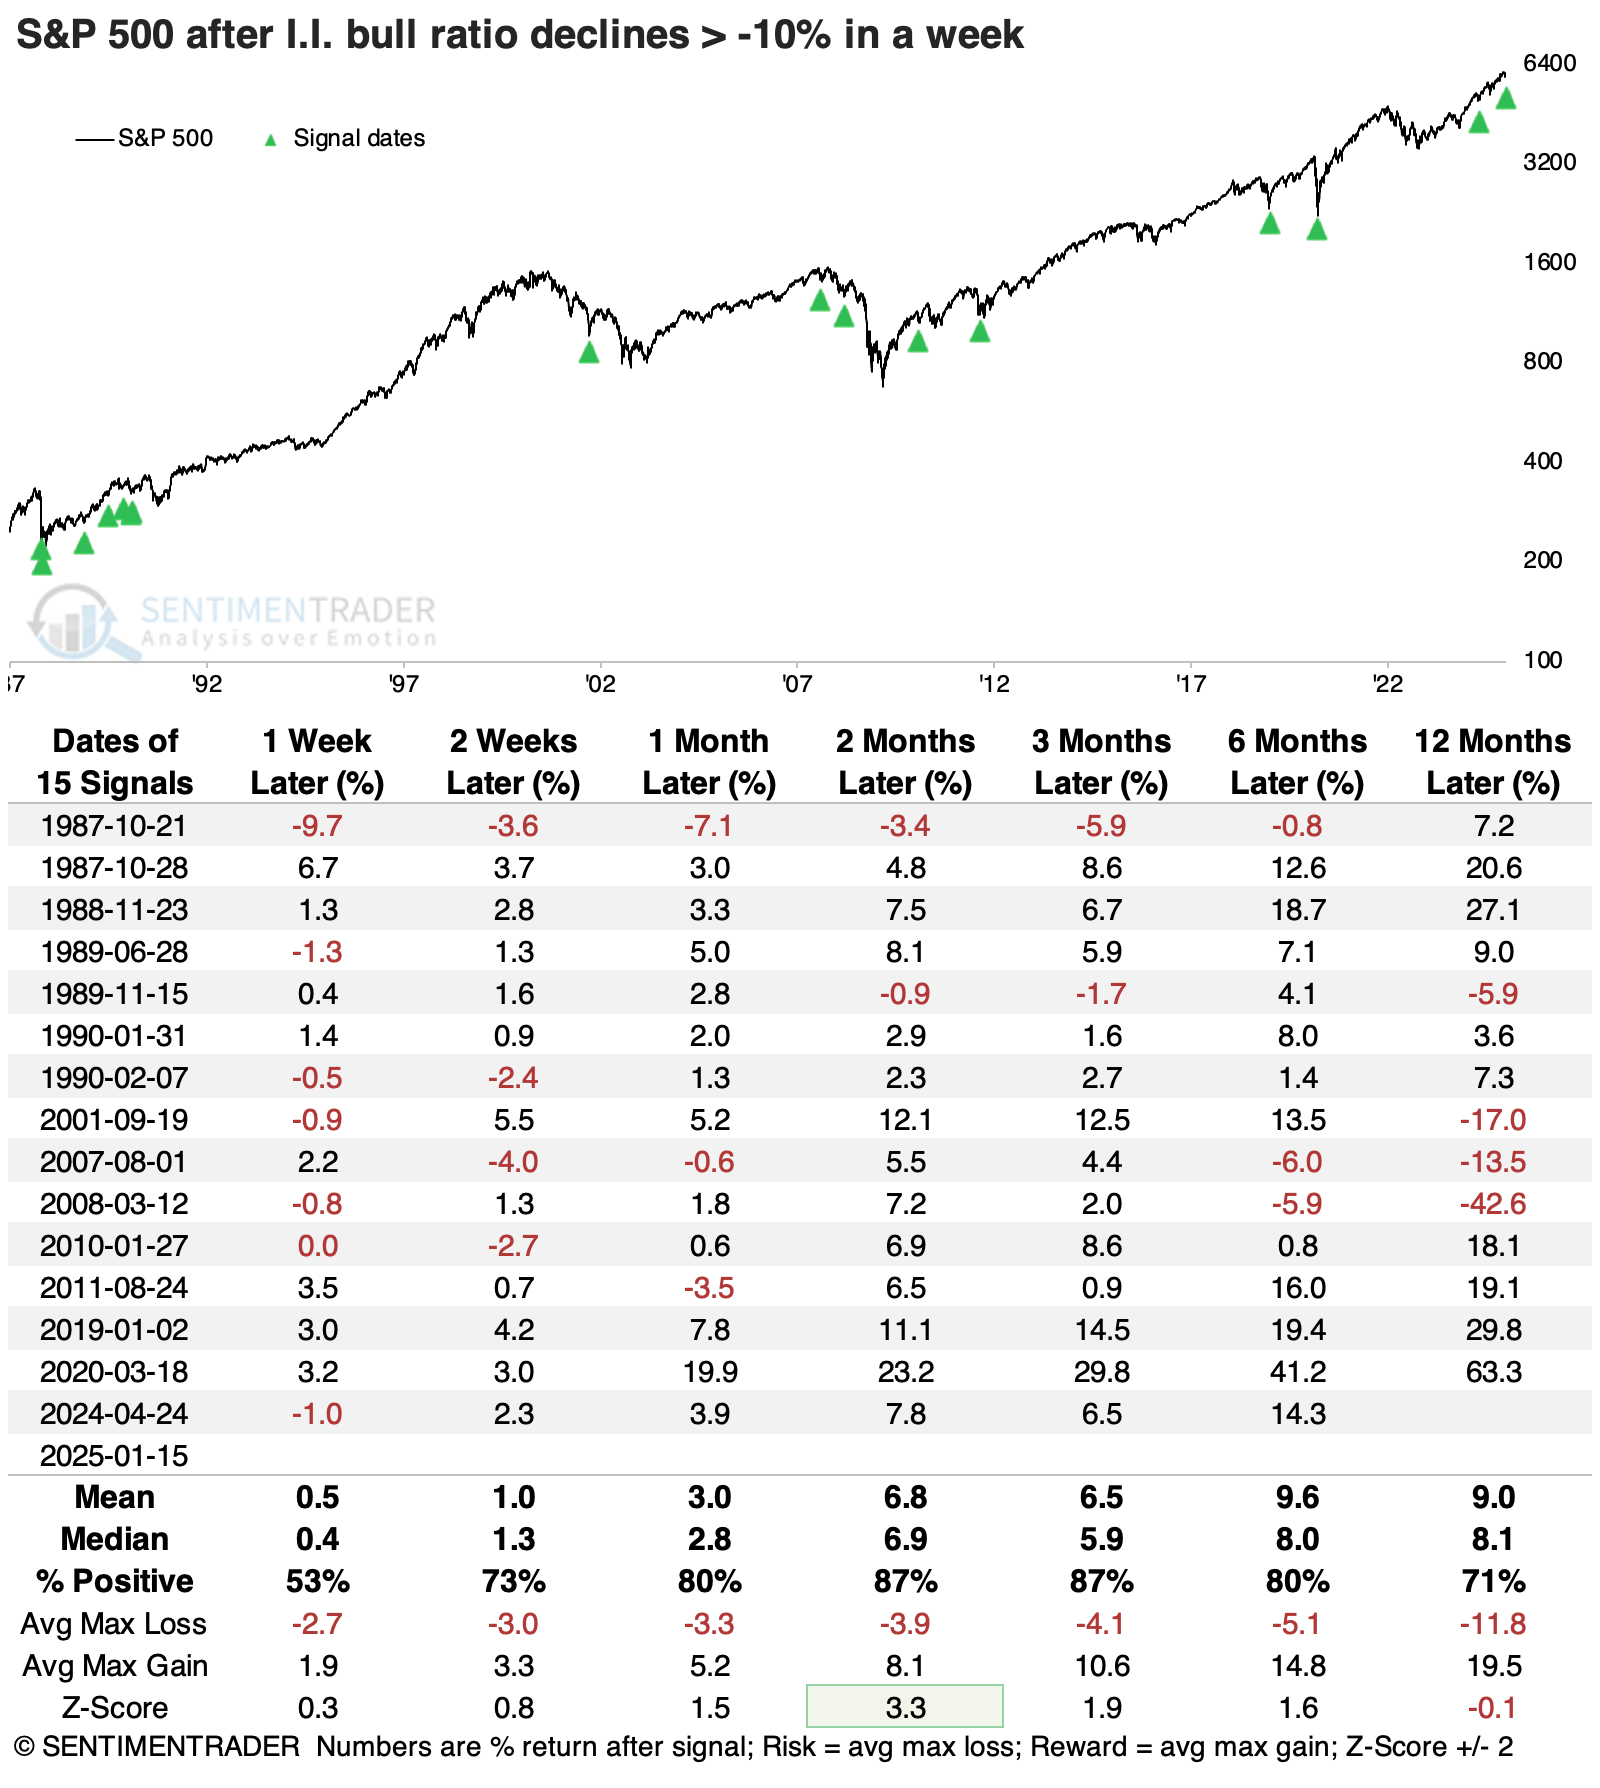
Since the sample size is small, let's look at smaller weekly declines in the I.I. Bull Ratio. The table below shows that weekly declines of -10% or more tended to show substantial gains, with only two slight declines over the following two months, which were soon reversed.
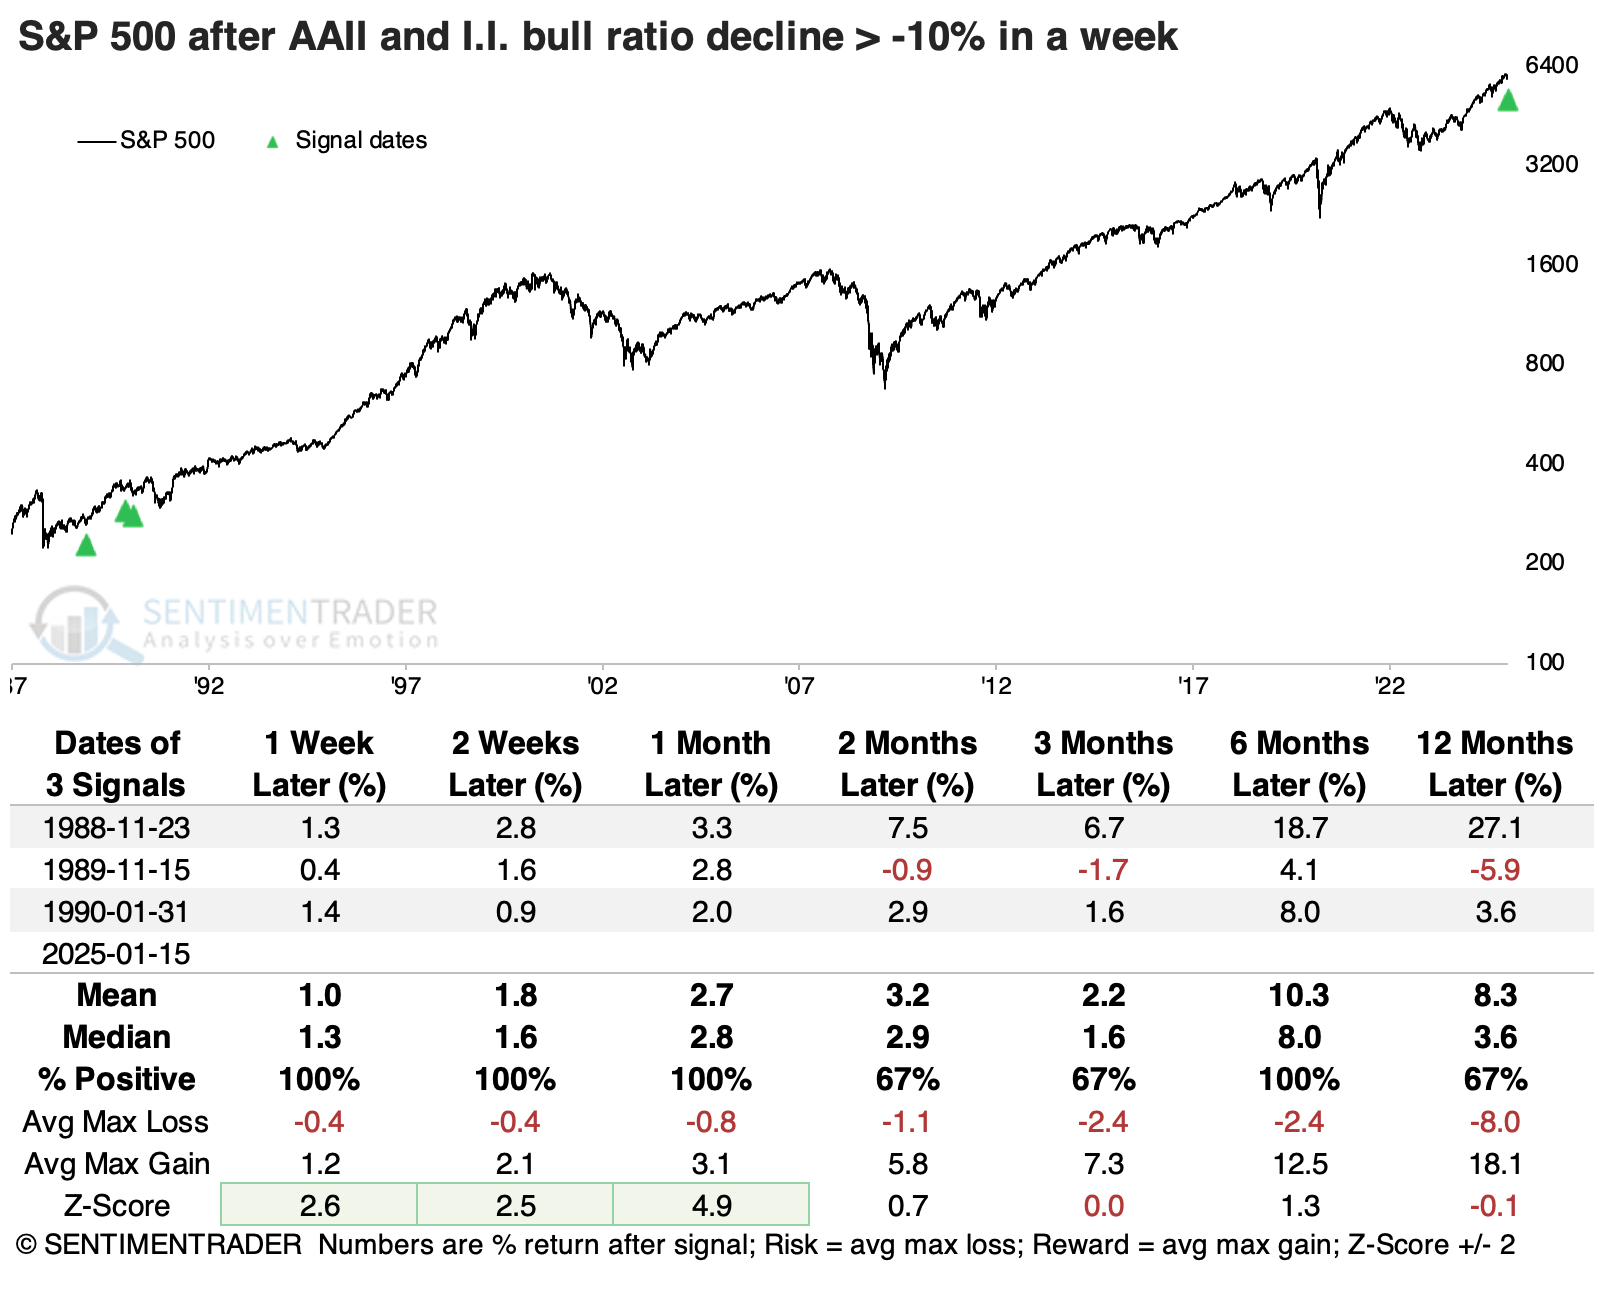
If we combine the two, we see that heading into last week, we'd witnessed only the fourth week ever when both populations reduced their bullishness by -10% or more. All three signals were clustered together, and for what it's worth (not much at all), it was a good sign for the S&P.
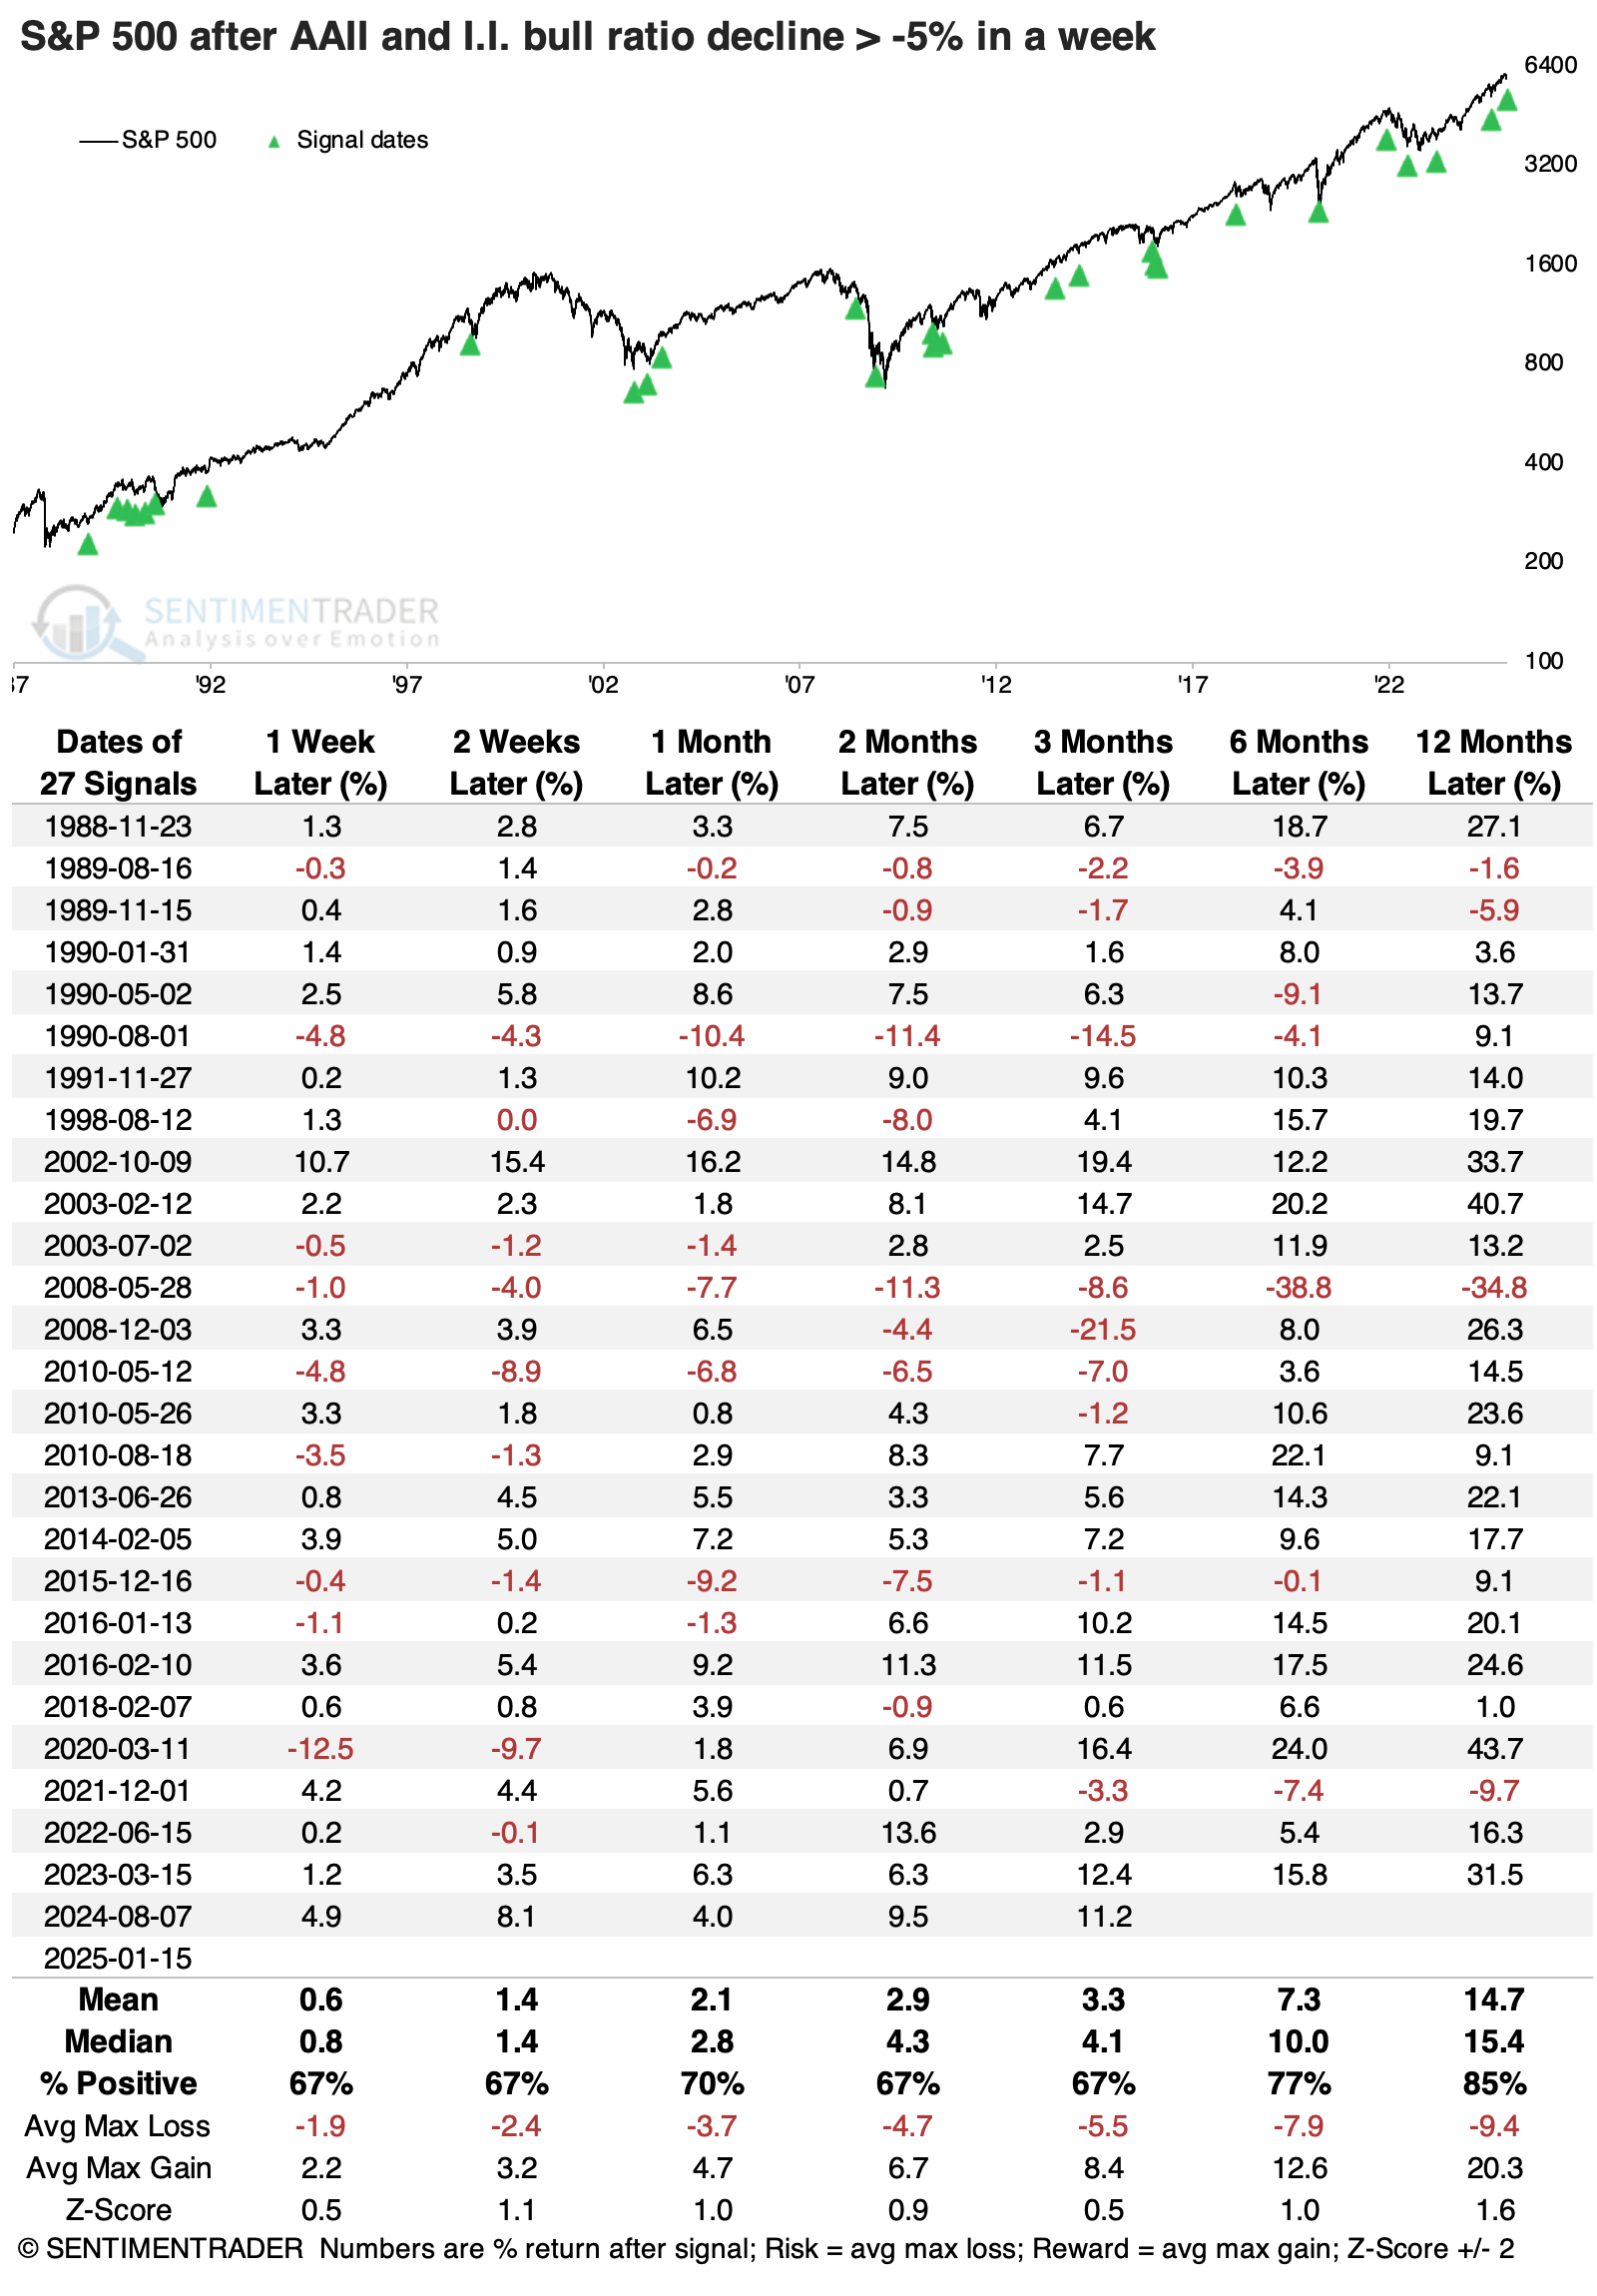
Smaller weekly declines in the Bull Ratio in both surveys tended to precede robust returns, though it's worth noting that the quick flip in sentiment preceded some harrowing losses as well.
Bad timing
The dramatic decrease in sentiment came at the worst possible time for many of these investors. After bullishness declined so much, other investors stepped in (and/or these folks changed their minds again), and S&P 500 stocks had one of their best weeks ever.
Every day during the week, at least 68% of stocks in the S&P 500 advanced. That's the first time so many stocks have advanced without a break since 2019, when it happened twice.
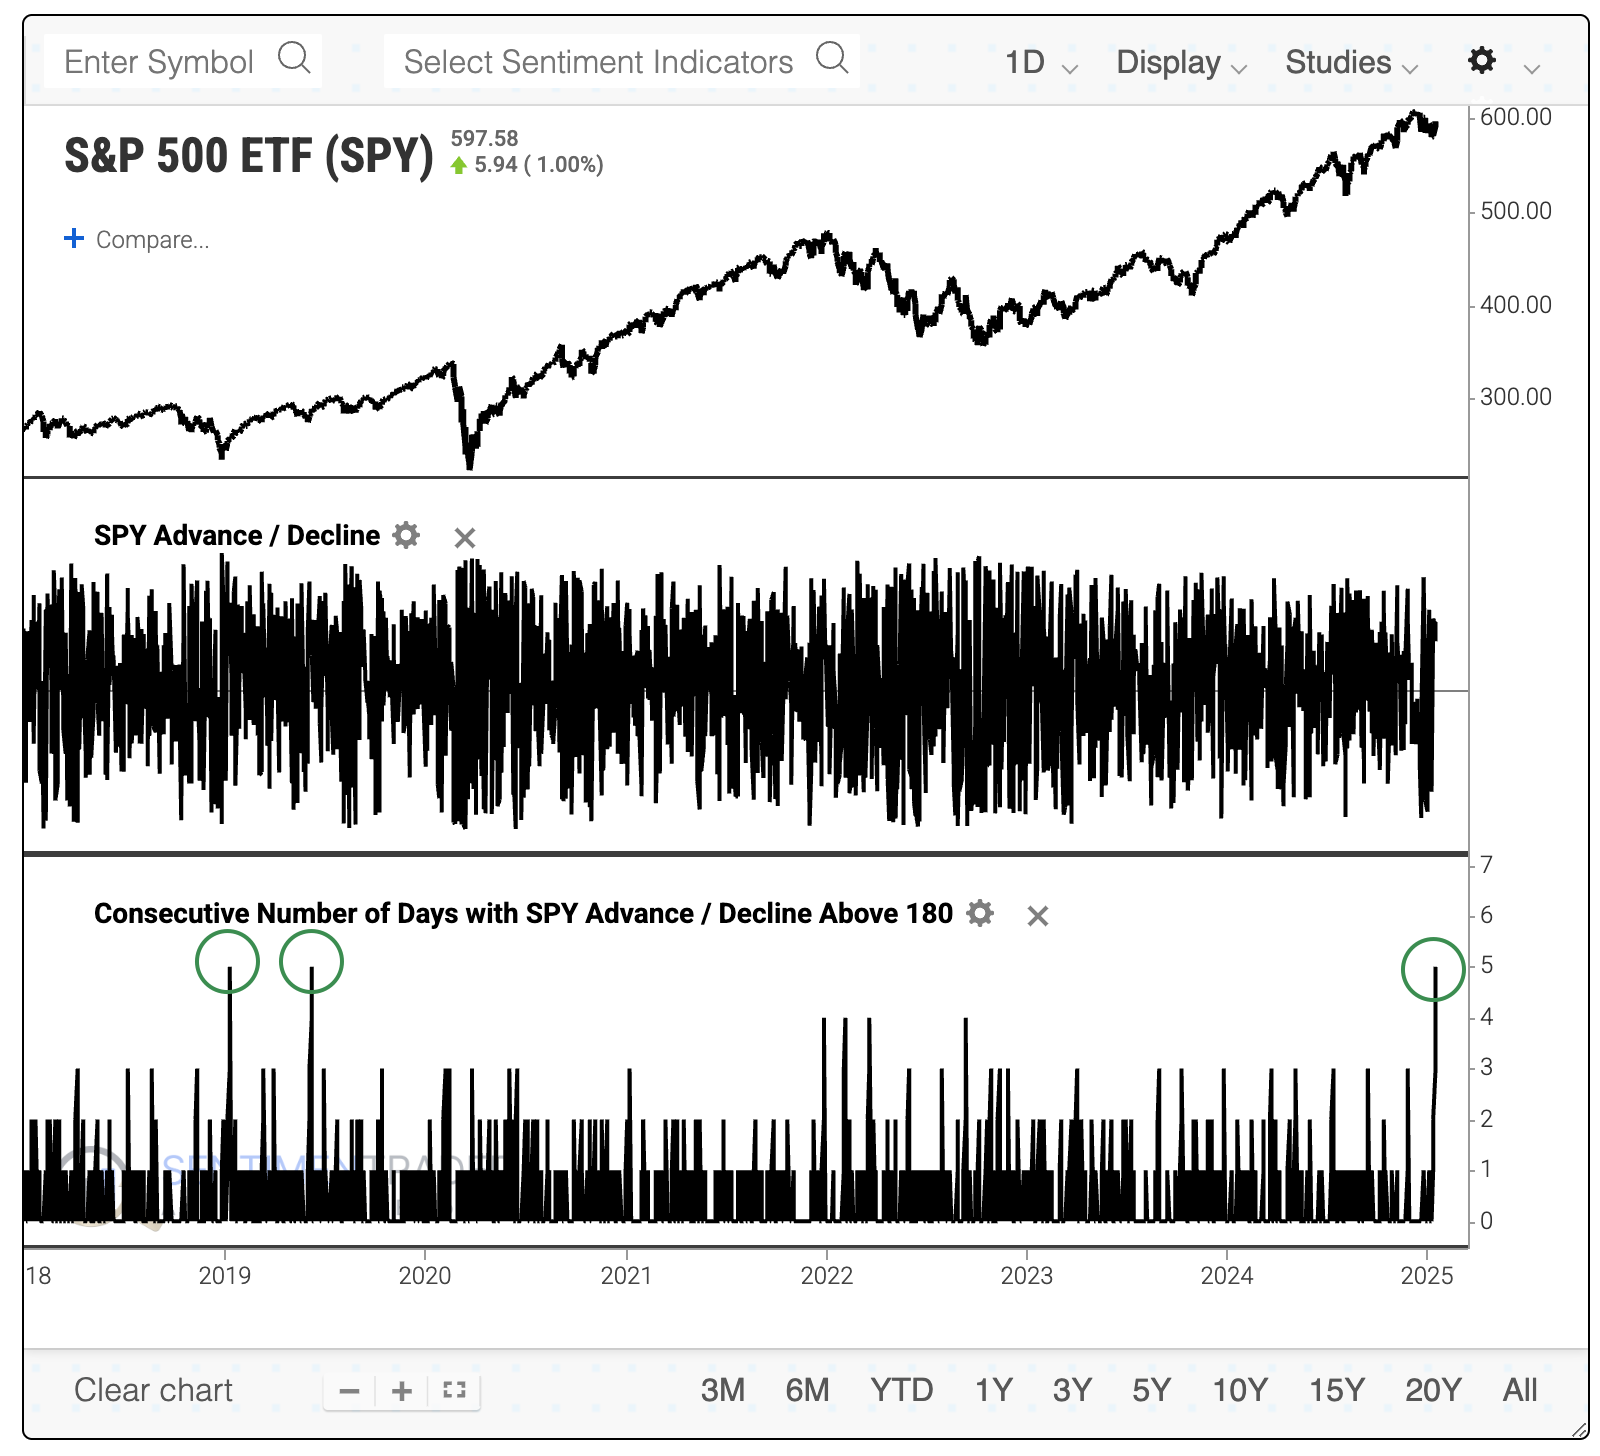
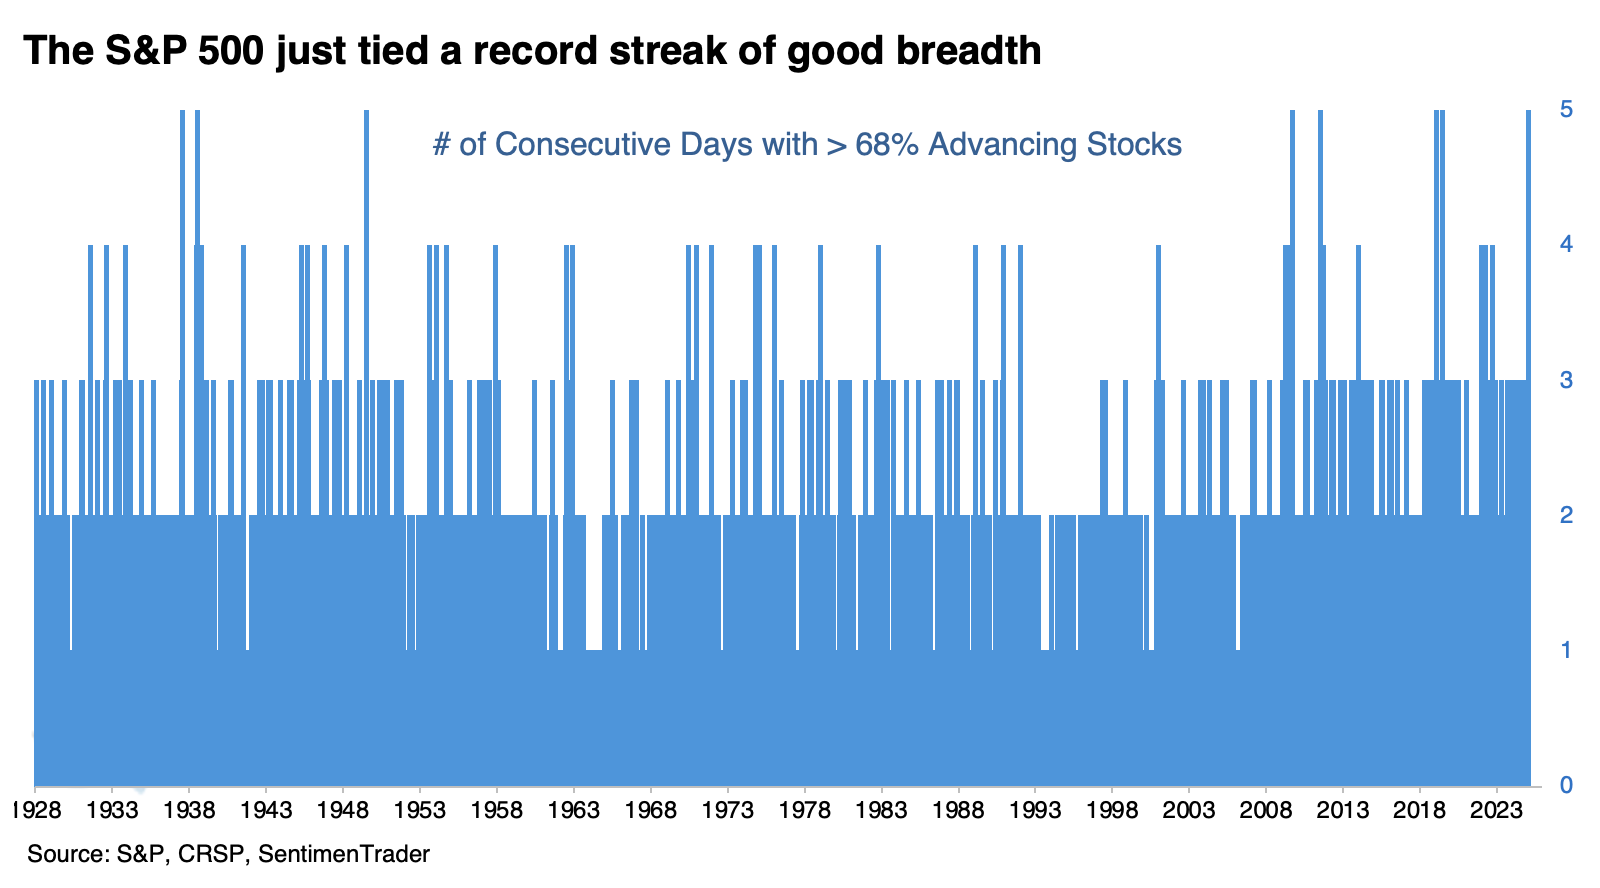
Even going back to 1928, the last five days have tied a record stretch of positive breadth, which is a remarkable feat.
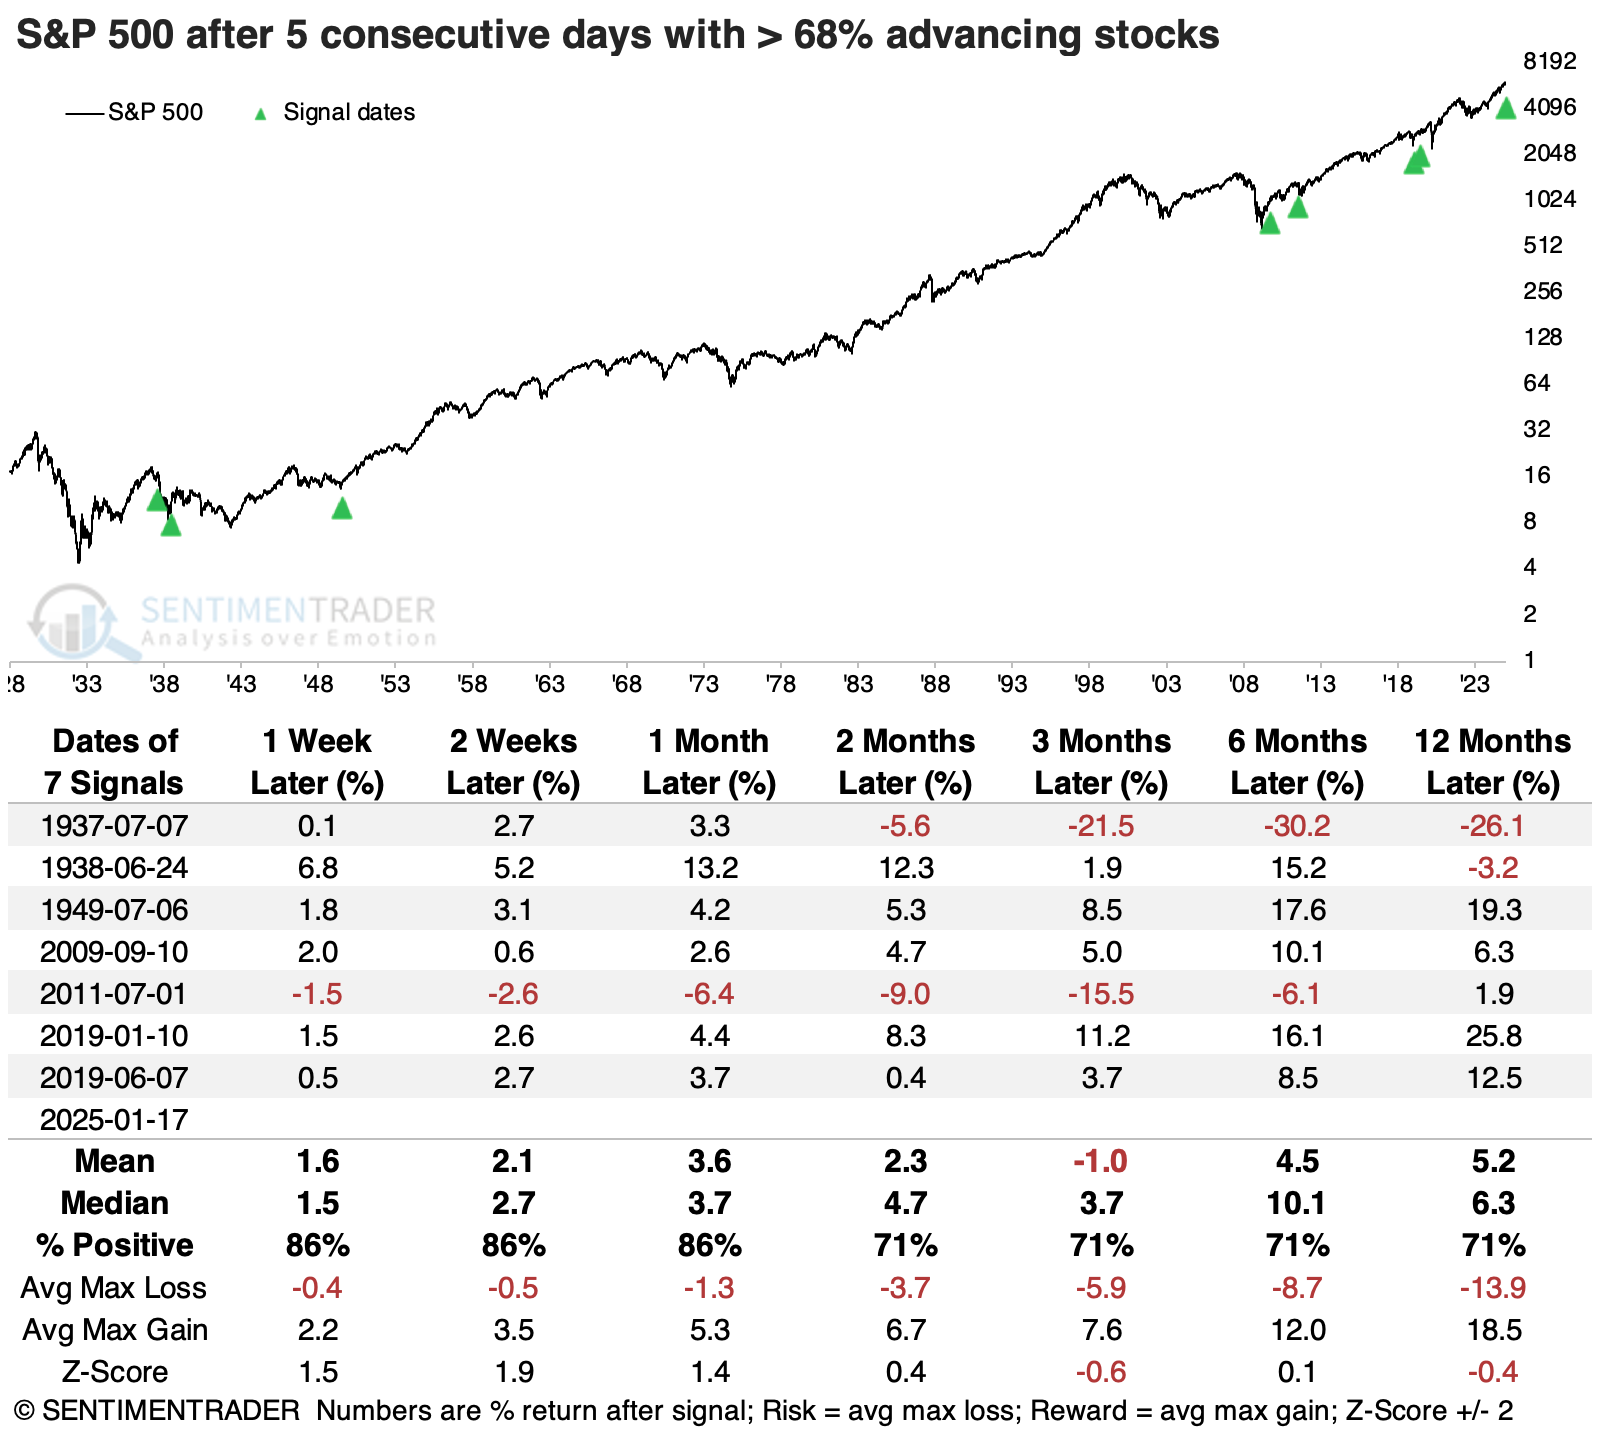
After the other streaks, the S&P 500 added to its gains over the following month every time but once. Two of the signals led to large losses at some point, including in 2011, when the S&P was also close to a multi-year high, like now.
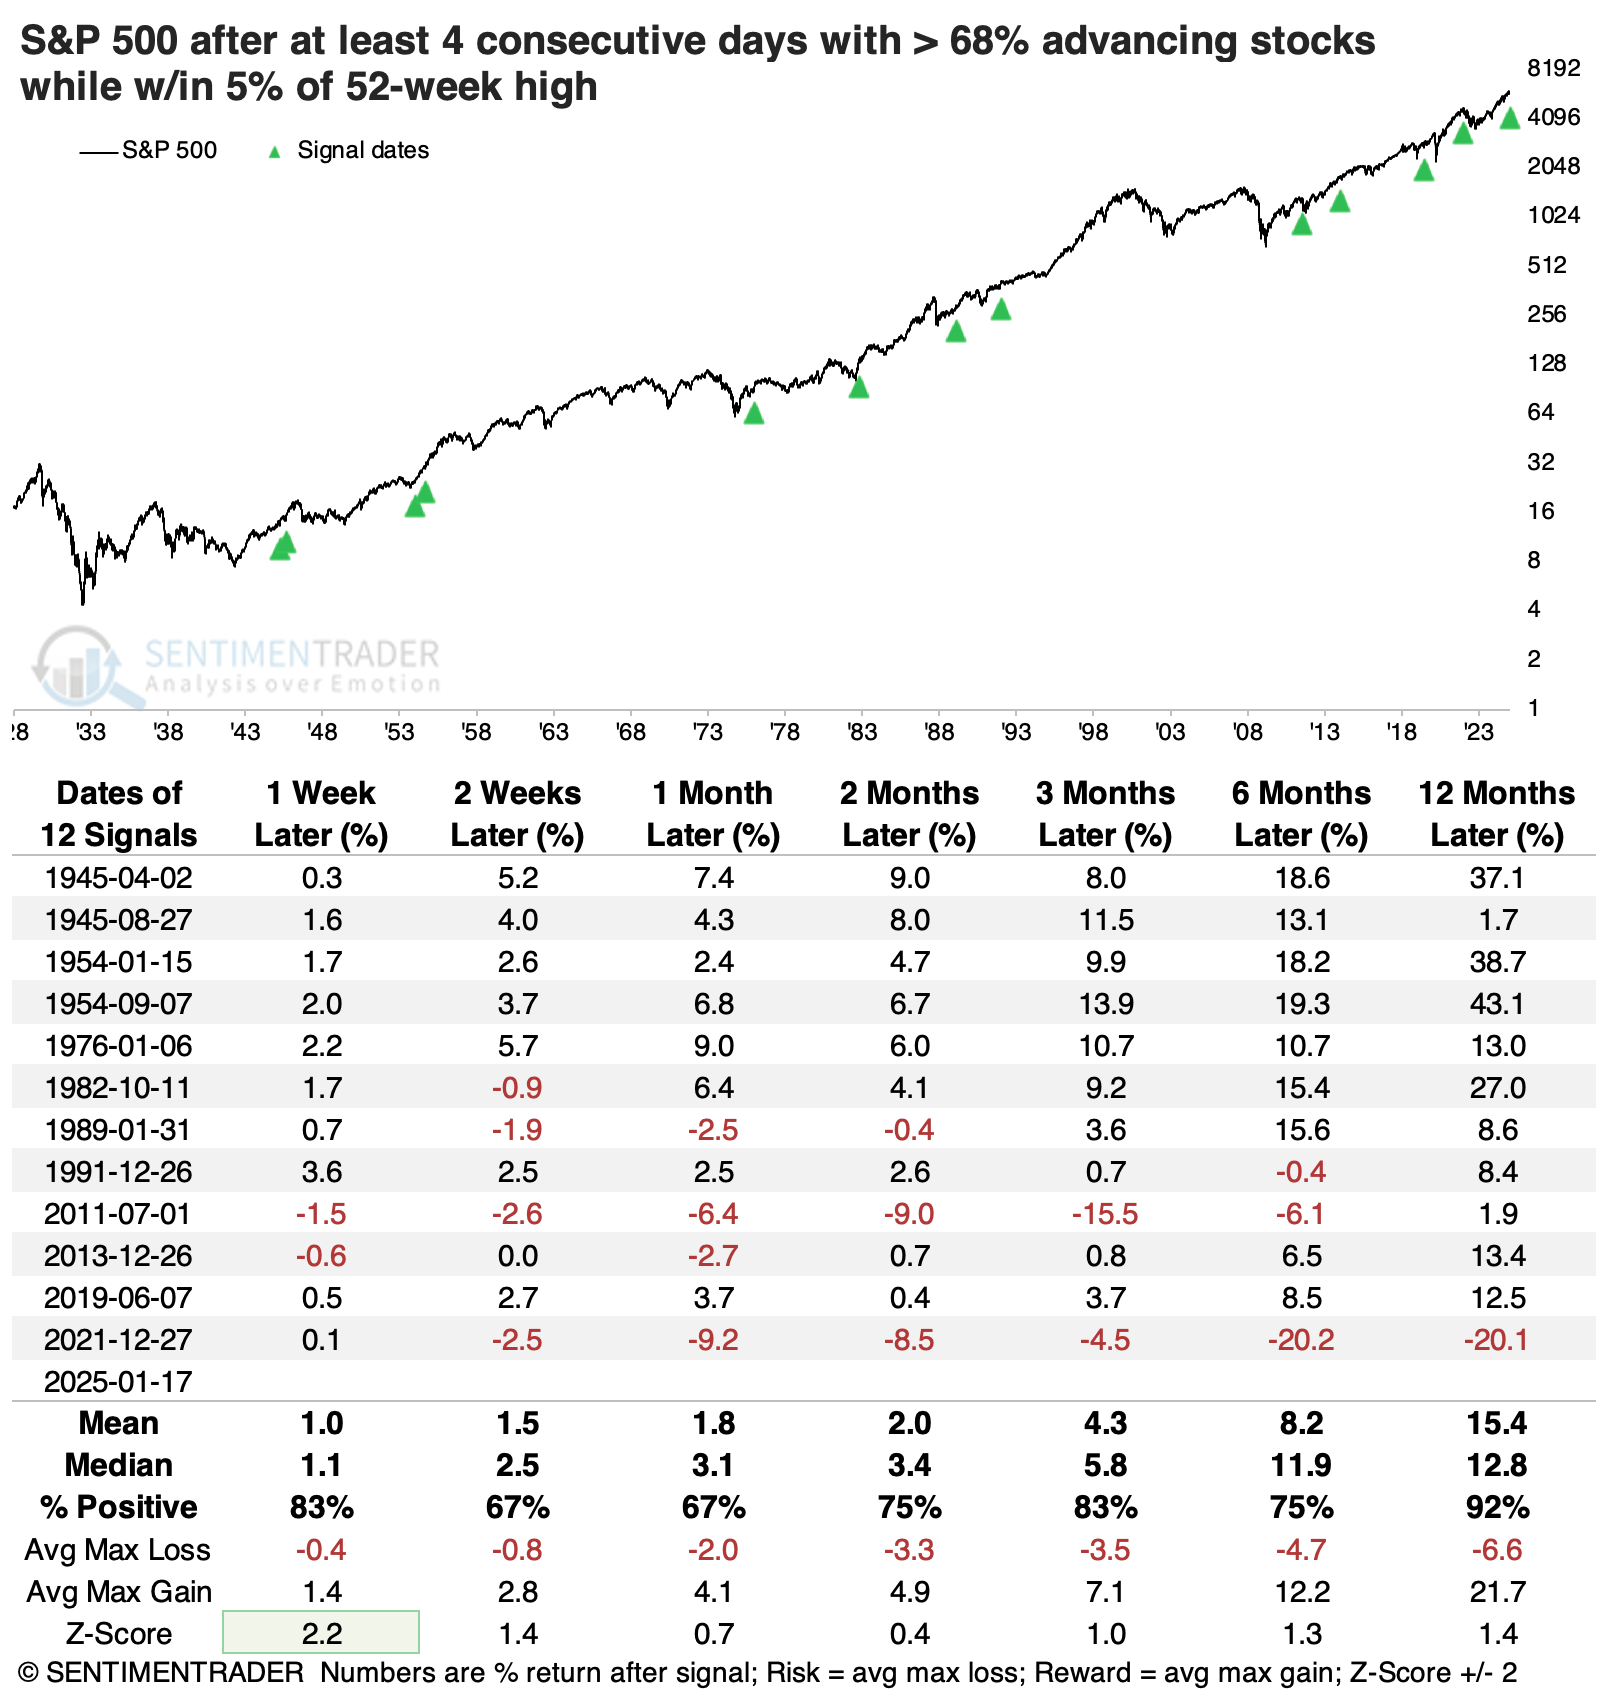
If we expand the sample size by looking for at least four consecutive days with 68% or more of stocks advancing when the S&P traded within 5% of a yearly high, we see mostly positive returns going forward. The only loss a year later was the last signal, which was terrible as it nearly coincided with the peak of the last bull market.
What the research tells us...
Sudden and dramatic shifts in investor sentiment are generally a poor short-term sign. Bull markets need bulls to rise. However, the last week emphatically countered that historical tendency with one of the best-breadth weeks in the history of the S&P 500 index or its proxies.
When markets don't behave as they typically do, it usually tells us something. It's tough to read too much into drastic short-term gyrations, especially with news flow coming in hot and heavy, so we'd focus more on some of the longer-term implications of behavior, as we've witnessed over the past two weeks. Those implications have been favorable for the S&P 500 with few exceptions.