
Bullish thrusts continue to confound the bears

Key points
- The stock market has enjoyed a terrific run and appears to many to be overextended and due for a pullback
- That scenario could well play out in the months ahead
- However, a variety of typically highly reliable momentum indicators suggest that longer-term investors continue to give the bullish case the benefit of the doubt in the year ahead
A favorable spike in S&P 1500 14-day RSI
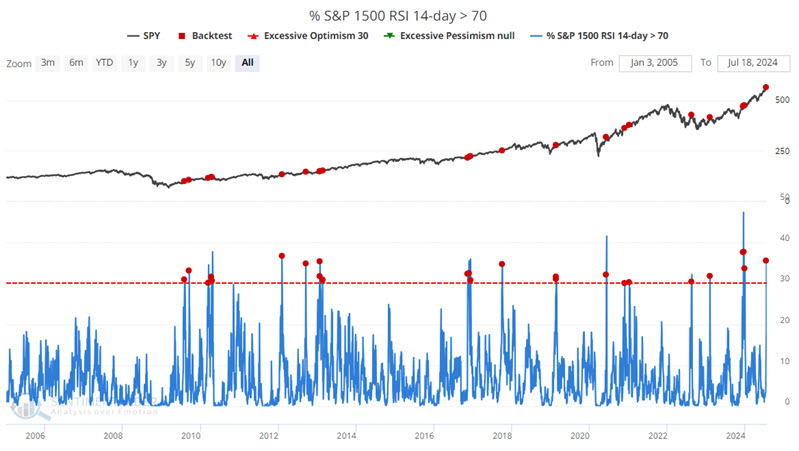
The % S&P 1500 RSI 14-Day > 70 indicator calculates the percentage of S&P 1500 stocks sporting a 14-day RSI value of 70% or more. While many people are inclined to think of high readings as indicative of an "overbought" situation, in the long run, such readings have more often than not highlighted a period of market "thrust" that ultimately propels the stock market higher.
The chart below highlights all dates when the S&P 1500 14-Day RSI > 70 indicator crossed above 30%. The most recent signal occurred on 2024-07-16.
The table below summarizes the subsequent performance of the SPDR S&P 500 ETF Trust (ticker SPY).
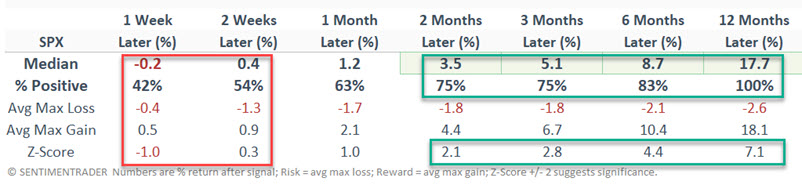
Some near-term weakness has been typical, but overall performance has been strong in subsequent months.
Another signal from the Nasdaq Zweig Breadth Thrust indicator
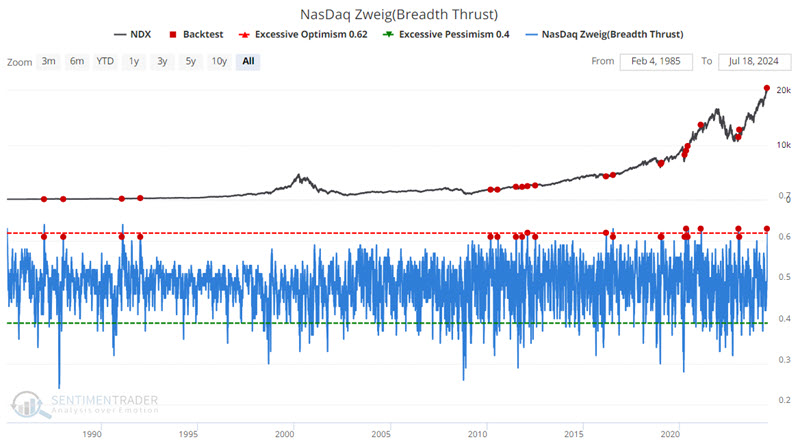
The Nasdaq 100 Index enjoyed a decisive move up before finally breaking down hard for at least one day on 2024-07-17. Many expect a meaningful pullback in this seemingly overextended index, and that scenario could, in fact, play out. Nevertheless, on a strictly objective basis, the Nasdaq Zweig Breadth Thrust indicator just flashed another sign of bullish momentum that higher prices have almost invariably followed.
The chart below highlights all dates when the Nasdaq Zweig Breadth Thrust indicator crossed above 0.60. The most recent signal occurred on 2024-07-16.
The table below summarizes subsequent performance for the Invesco QQQ Trust ETF (ticker QQQ) that tracks the Nasdaq 100 Index.
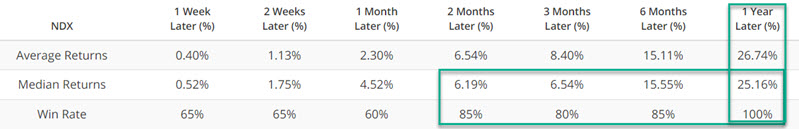
The critical thing to note is the 80%+ Win Rates for all time frames, two months and out.
What the research tells us…
Virtually all major stock market indexes have recently reached a level that can reasonably be described as "overbought." As the market never moves in one direction for too long, this action raises the fear among investors of an impending decline - whether a standard market correction or something worse. And there is nothing wrong with hedging one's portfolio if an investor has objective reason to expect a market pullback. Likewise, bullish thrusts this late into an advance are unusual and cause many investors to intuitively question their validity. Nevertheless, while market corrections are inevitable, signals like the ones highlighted above strongly suggest that investors "fight the fear" and the urge to be frightened out of the market - and to continue to give the bullish case the benefit of the doubt in the year ahead.