Indicators &
Backtest Tools
Research
Reports
Report Solutions
Reports Library
Strategies
& Scanner
Free
Resources
Simple Backtest Calculator
Simple Seasonality Calculator
The Kelly Criterion Calculator
Sentiment Geo Map
Public Research Reports
Free Webinar
Pricing
Company
About
Meet Our Team
In the News
Testimonials
Client Success Stories
Contact
Log inLoginSign up
< BACK TO ALL REPORTS

Brazilian Stocks Are Getting Waxed

Jason Goepfert
2021-10-29
Brazilian stocks have seen a historic level of selling pressure as breadth measures approach all time lows.

Brazil is a mess, and investors are panicking.

In recent days, selling pressure has been heavy enough and broad enough to hint at indiscriminate selling. Breadth metrics are horrid.

Per Bloomberg:

"Local assets have tumbled in recent days as President Jair Bolsonaro's administration seeks ways to boost spending ahead of next year's election and bypass fiscal rules meant to keep budgets in check."

And CNBC:

"The first problem is a slowdown in China that will likely have a knock-on effect on Brazil as one of its largest trading and export partners."

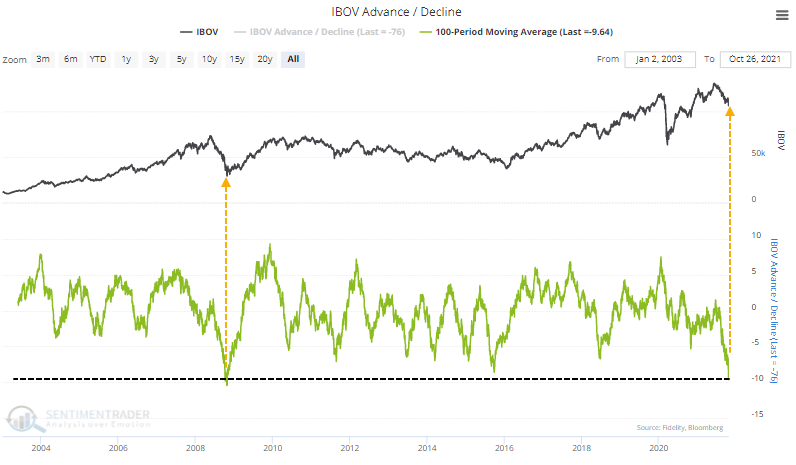
So many stocks on the Ibovespa exchange have been declining consistently that the Cumulative Advance/Decline Line has plunged to the 2nd-lowest level in 15 years.

On an average day during the past 100 sessions, 10 more stocks have declined than advanced. That's an abysmal stretch that few sectors or indexes have matched in the past 20 years. For the Ibovespa, it's the 2nd-lowest reading since 1998, barely exceeded by late October 2008.

Brazil's Ibovespa exchange is seeing historic selling pressure and poor breadth

Such poor internal momentum has pushed the McClellan Summation Index for Brazilian stocks below -1000 and kept it there for most of the past few months. It's been below -975 for 56 trading days, eclipsed only by the 60 days it spent below that threshold in November 2008. 

Conditions like this tend to coincide with high volatility over a multi-week to multi-month time frame. If the stocks crash further in the coming weeks or start to see signs of stabilization, long-term returns have been highly positive under similar circumstances.


What else we're looking at

  • A detailed look at breadth metrics for Brazilian stocks
  • Forward returns after Brazilian stock behavior looked like it does today
  • Another look at the S&P 500's "power period"
  • What happens after Transporation stocks behave as they have over the past month

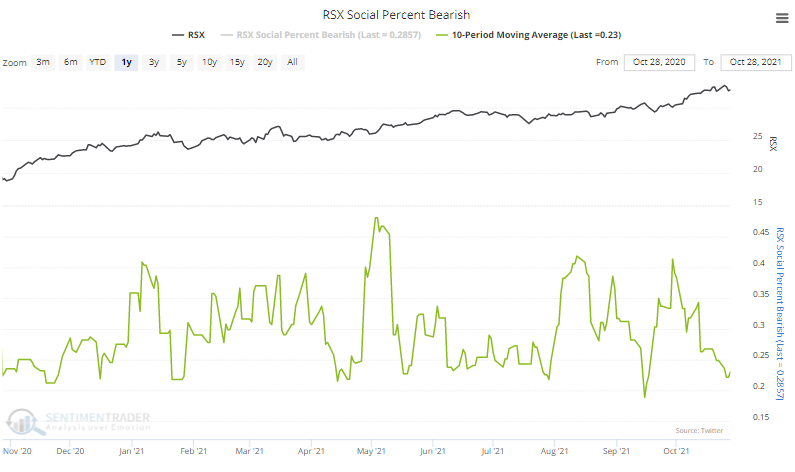
Stat box

The RSX fund of Russian stocks is on track for its 6th consecutive weekly advance. That's tied for the 9th-longest streak since the fund's inception.

Etcetera

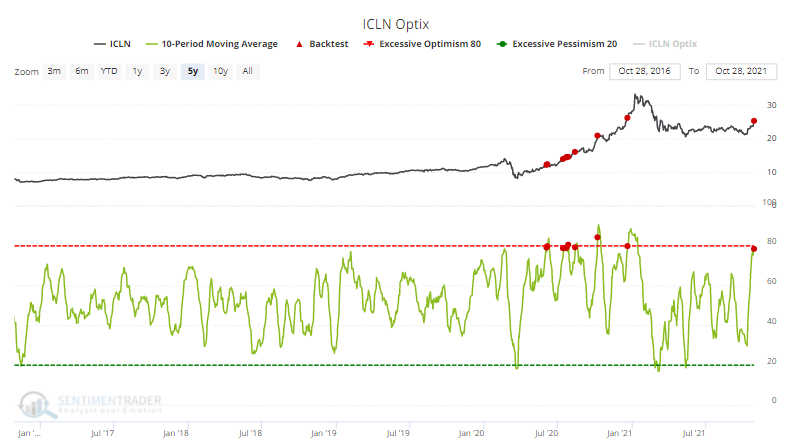
A clean break. Clean energy stocks have broken out of a recent consolidation phase, and optimism is soaring. The 10-day average Optimism Index has climbed above 78%, which preceded a slight pause at best during the rip-roaring 2020 rally. Before 2020, such high optimism preceded pullbacks nearly every time.

Optimism on clean energy fund ICLN is soaring

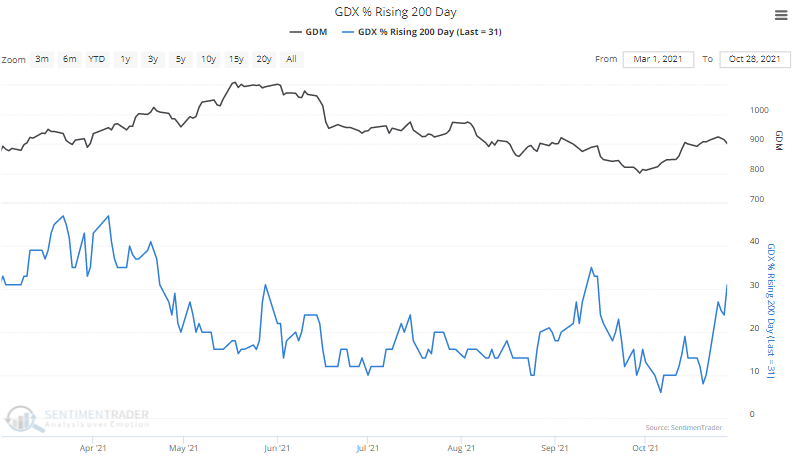
Minor miner positive. There has been a modest increase in the percentage of gold mining stocks in solid uptrends. Nearly 30% of them now have a rising 200-day moving average, but the healthiest bull markets tend to see this hold above 40%.

There are more gold mining stocks with rising 200 day moving averages

Putin on the fritz. Twitter users are looking past any strong-arm tactics. The percentage of messages with a bearish tone about the RSX fund of Russian stocks has been nearly the lowest in a year over the past 10 days.

Twitter users are feeling positive about Russia

Indicators & Backtest Tools
IndicatorEdge
‍
BackTestEdge
‍
Other Tools
‍
DataEdge API
RESEARCH
reports
Research Solution
‍
Reports Library
‍
Strategies & Scanner
Trading Strategies
‍
Smart Stock Scanner
‍
FREE
RESOUrCES
Simple Backtest
Calculator
Simple Seasonality
Calculator
The Kelly Criterion
Calculator
Sentiment Geo Map
‍
Public Research Reports
‍
Free Webinar
COMPANY
‍
About
‍
Meet our Team
‍
In the News
‍
Testimonials
‍
Client Success Stories
Pricing
Bundle pricing
‍
Announcements
‍
FAQ
© 2024 Sundial Capital Research Inc. All rights reserved.
Setsail Marketing
TermsPrivacyAffiliate Program
Risk Disclosure: Futures and forex trading contains substantial risk and is not for every investor. An investor could potentially lose all or more than the initial investment. Risk capital is money that can be lost without jeopardizing ones’ financial security or life style. Only risk capital should be used for trading and only those with sufficient risk capital should consider trading. Past performance is not necessarily indicative of future results.

Hypothetical Performance Disclosure: Hypothetical performance results have many inherent limitations, some of which are described below. No representation is being made that any account will or is likely to achieve profits or losses similar to those shown; in fact, there are frequently sharp differences between hypothetical performance results and the actual results subsequently achieved by any particular trading program. One of the limitations of hypothetical performance results is that they are generally prepared with the benefit of hindsight. In addition, hypothetical trading does not involve financial risk, and no hypothetical trading record can completely account for the impact of financial risk of actual trading. for example, the ability to withstand losses or to adhere to a particular trading program in spite of trading losses are material points which can also adversely affect actual trading results. There are numerous other factors related to the markets in general or to the implementation of any specific trading program which cannot be fully accounted for in the preparation of hypothetical performance results and all which can adversely affect trading results.

Testimonial Disclosure: Testimonials appearing on this website may not be representative of other clients or customers and is not a guarantee of future performance or success.