Data &
Technology
Research
Reports
Report Solutions
Reports Library
Actionable
Strategies
Free
Resources
Simple Backtest Calculator
Simple Seasonality Calculator
The Kelly Criterion Calculator
Sentiment Geo Map
Public Research Reports
Free Webinar
Pricing
Company
About
Meet Our Team
In the News
Testimonials
Client Success Stories
Contact
Log inLoginSign up
< BACK TO ALL REPORTS

Bio-tech has turned into a bio-wreck

Jason Goepfert
2021-12-17
Biotechnology stocks look washed out according to some internal breadth measures. Using simple trend-following methods for interest rates.

Bio-tech has become bio-wreck

Heading into February's speculative peak, almost everything was in gear. That euphoric sentiment eased as some of the riskiest parts of the markets took a dive or treaded water at best.

Since then, there have been entire sectors that have lagged the broader market. Some equity indexes, especially those weighted by market capitalization, are at or near record highs. But not everyone is enjoying the gains.

Getting reliable information on the losses in the sector is difficult. It's a notoriously volatile group, with share prices skyrocketing based on rumors or collapsing and de-listing based on the same. That can trigger heavy turnover in Biotechnology indexes, with historical studies often suffering from survivorship bias.

We can create metrics that look at the breadth of the performance among many of these stocks to gauge whether recent declines are enough to suggest the worst is likely over. We've done our best to recreate the stocks included in the ICE Biotechnology Index, the index underlying the largest Biotech fund, IBB. There are a little over 300 stocks in the custom index, but it is not perfect.

All of the metrics we studied showed readings that were in the bottom 5% of days since 1999. For example, fewer than 10% of Biotech stocks were able to hold within 20% of their 52-week highs, ranking in the bottom 1% of all days in the past 22 years.

Fewer than 10% of biotechnology stocks are in bull markets

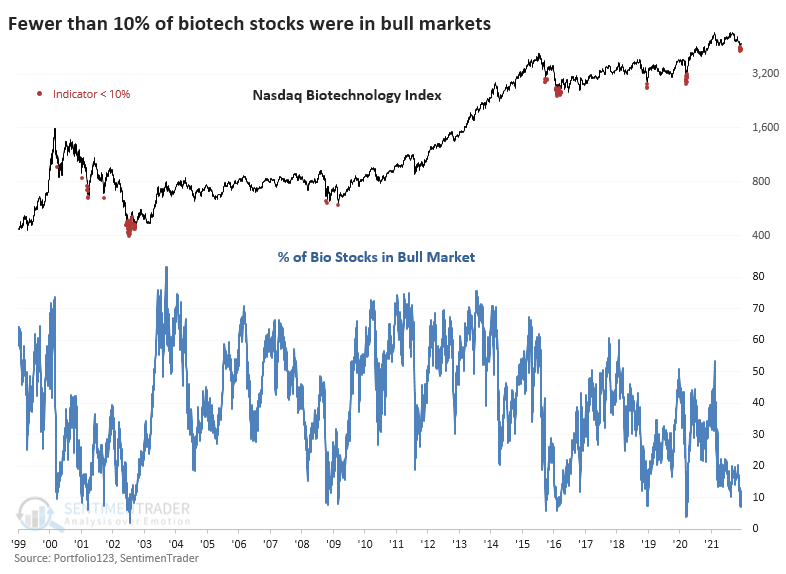
Combining all these metrics into a composite, it recently dipped below 20%, recording a level of oversold behavior in the bottom 1% of all days.

Stat box

Over the past 10 days, an average of 17 more Consumer Staples stocks rose versus declined. That's in the top 15 reading among all days in the past 22 years. After the others, the Staples sector rose over the next 2 months every time but once.


Combining trend-following methods for interest rates

Jay continued his look at using some simple trend-following methods applied to interest rates. This time, he combined his previous methods into one.

To measure the efficiency of the Combined Indicator, let's use the following methodology:

  • Add changes in yield points if the Combined Indicator reading is +3
  • Subtract changes in yield points if the Combined Indicator reading is 0

The chart below displays the cumulative gain/loss in yield points ONLY when the Combined Indicator reading is +3 or 0.

Using simple trend following methods for interest rates

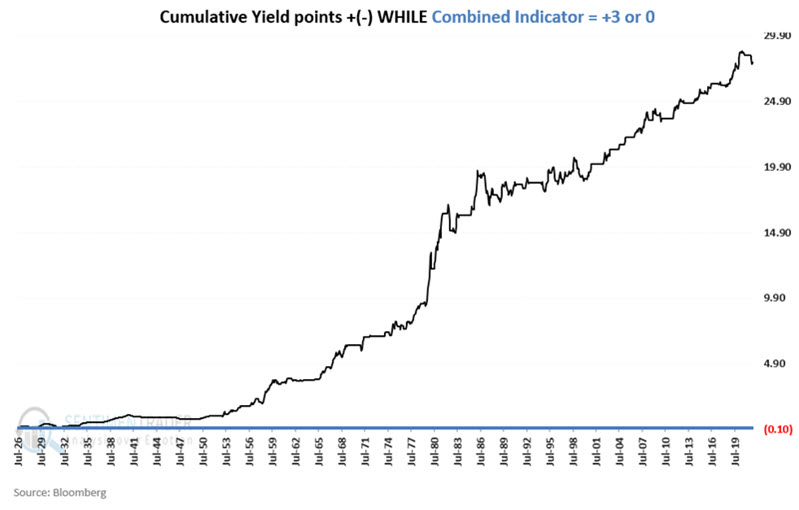
Interest rates tend to rise when the combined indicator = +3 and tend to decline when the combined indicator = 0.  The first takeaway is that investors should avoid long-term bonds and stick to shorter-term securities (or floating rate debt, or avoid bonds altogether) when the combined indicator = +3.  The second takeaway is that investors seeking maximum gains can extend maturities when the combined indicator = 0, which is where it was at the end of November.

DATA &
TECHnologies
IndicatorEdge
‍
BackTestEdge
‍
Other Tools
‍
DataEdge API
RESEARCH
reports
Research Solution
‍
Reports Library
‍
actionable
Strategies
Trading Strategies
‍
Smart Stock Scanner
‍
FREE
RESOUrCES
Simple Backtest
Calculator
Simple Seasonality
Calculator
The Kelly Criterion
Calculator
Sentiment Geo Map
‍
Public Research Reports
‍
Free Webinar
COMPANY
‍
About
‍
Meet our Team
‍
In the News
‍
Testimonials
‍
Client Success Stories
Pricing
Bundle pricing
‍
Announcements
‍
FAQ
© 2024 Sundial Capital Research Inc. All rights reserved.
Setsail Marketing
TermsPrivacyAffiliate Program
Risk Disclosure: Futures and forex trading contains substantial risk and is not for every investor. An investor could potentially lose all or more than the initial investment. Risk capital is money that can be lost without jeopardizing ones’ financial security or life style. Only risk capital should be used for trading and only those with sufficient risk capital should consider trading. Past performance is not necessarily indicative of future results.

Hypothetical Performance Disclosure: Hypothetical performance results have many inherent limitations, some of which are described below. No representation is being made that any account will or is likely to achieve profits or losses similar to those shown; in fact, there are frequently sharp differences between hypothetical performance results and the actual results subsequently achieved by any particular trading program. One of the limitations of hypothetical performance results is that they are generally prepared with the benefit of hindsight. In addition, hypothetical trading does not involve financial risk, and no hypothetical trading record can completely account for the impact of financial risk of actual trading. for example, the ability to withstand losses or to adhere to a particular trading program in spite of trading losses are material points which can also adversely affect actual trading results. There are numerous other factors related to the markets in general or to the implementation of any specific trading program which cannot be fully accounted for in the preparation of hypothetical performance results and all which can adversely affect trading results.

Testimonial Disclosure: Testimonials appearing on this website may not be representative of other clients or customers and is not a guarantee of future performance or success.