Products
SentimenTrader Trading Tools
‍
Backtest Engine
My Trading Toolkit
Correlation Analysis
Seasonality
Indicators & Data API
‍
Proprietary Indicators & Charts
Market Data API
Strategies & Scanner
‍
50+ Trading Strategies
Smart Stock Scanner
Research Reports
‍
Research Solutions
Reports Library
Free Resources
Simple Backtest Calculator
Simple Seasonality Calculator
The Kelly Criterion Calculator
Sentiment Geo Map
Public Research Reports
Pricing
Company
About
In the News
Testimonials
Client Success Stories
Contact
Log inLoginSign up
< BACK TO ALL REPORTS

Assessing the S&P 500's quick correction

Jason Goepfert
2022-02-24
The S&P 500 has dropped into a correction, one of its swifter declines of 10% or more from a 3-year high. Gold is entering a soft spot.

The world's most benchmarked index falls into a correction

The S&P 500 has finally endured a drawdown of more than 10% from its most recent multi-year high. For brevity's sake, we use the commonly accepted definition of calling this a correction.

This ended the S&P's 11th-longest streak of hanging within 10% of its high.

After the S&P fell into a correction following a long absence, it tended to bounce back, especially over the next 1-4 weeks. At only 33 days removed from its most recent multi-year high, it seems like this has been a quick about-face among investors. But it's not far below the median number of days it took for the S&P to cycle into a correction.

The S&P takes an average of 36 days to cycle into a correction

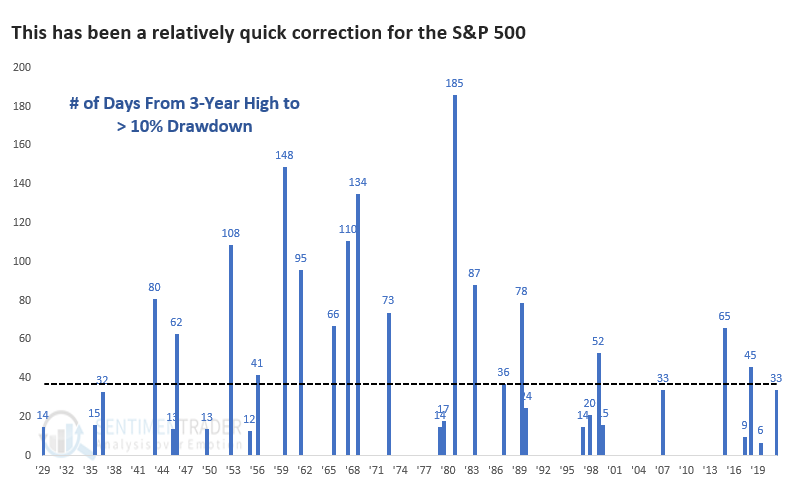
Again, the S&P tended to bounce after quick corrections as dip-buyers finally found their chance to jump on what had been an excellent trend. Returns after these corrections were better over the medium- to long-term.

We also took a look at the index's average price path, depending on whether the correction ended up morphing into a bear market or not.

Stat box

Heavy selling on Wednesday pushed 100% of S&P 500 Technology sector stocks below their 10-day moving averages. That's only the 37th day in 22 years this has happened.


A gold soft spot

For years gold has been touted by some as the ultimate inflation hedge. Yet despite the massive spike in inflation in the last year, gold has not made great headway.

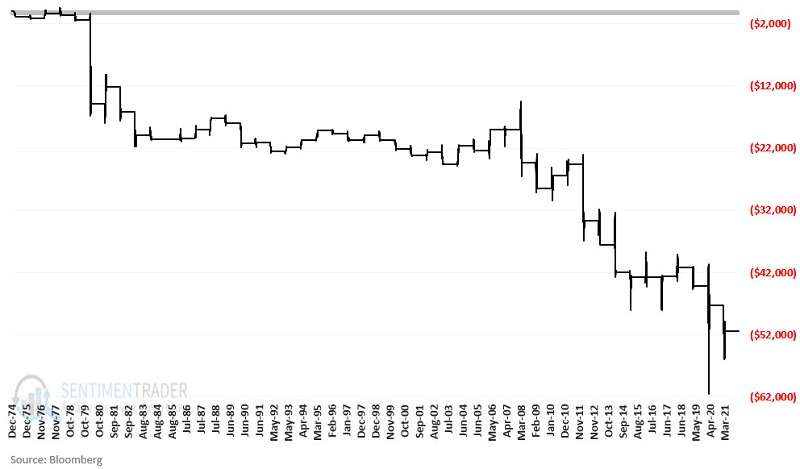
Jay noted that a period of seasonal strength is about to end, a period of seasonal weakness is about to begin, and a period of seasonal "blah" (for lack of a better term) extends for the next several months. 

One seasonal period to pay attention to begins the close of the 18th trading day of February and extends for a little more than a month. The chart below displays the cumulative hypothetical $ +(-) achieved by holding a long position in gold futures only during this period each year since 1975.

Gold is entering a seasonal weak spot

PRODUCTS
SentimenTrader
Trading Tools
Indicators & Data API
‍
Strategies & Scanner
‍
Research Reports
FREE
RESOUrCES
Simple Backtest
Calculator
Simple Seasonality
Calculator
The Kelly Criterion
Calculator
Sentiment Geo Map
‍
Public Research Reports
‍
Pricing
Bundle pricing
‍
Announcements
‍
FAQ
COMPANY
‍
About
‍
In the News
‍
Testimonials
‍
Client Success Stories
CONTACT
‍
General Inquiries
‍
Media Inquiries
‍
Financial Professionals Inquiries
‍
© 2025 Sundial Capital Research Inc. All rights reserved.
Setsail Marketing
TermsPrivacyAffiliate Program
Risk Disclosure: Futures and forex trading contains substantial risk and is not for every investor. An investor could potentially lose all or more than the initial investment. Risk capital is money that can be lost without jeopardizing ones’ financial security or life style. Only risk capital should be used for trading and only those with sufficient risk capital should consider trading. Past performance is not necessarily indicative of future results.

Hypothetical Performance Disclosure: Hypothetical performance results have many inherent limitations, some of which are described below. No representation is being made that any account will or is likely to achieve profits or losses similar to those shown; in fact, there are frequently sharp differences between hypothetical performance results and the actual results subsequently achieved by any particular trading program. One of the limitations of hypothetical performance results is that they are generally prepared with the benefit of hindsight. In addition, hypothetical trading does not involve financial risk, and no hypothetical trading record can completely account for the impact of financial risk of actual trading. for example, the ability to withstand losses or to adhere to a particular trading program in spite of trading losses are material points which can also adversely affect actual trading results. There are numerous other factors related to the markets in general or to the implementation of any specific trading program which cannot be fully accounted for in the preparation of hypothetical performance results and all which can adversely affect trading results.

Testimonial Disclosure: Testimonials appearing on this website may not be representative of other clients or customers and is not a guarantee of future performance or success.