Another week, another speculative record
In late August and early September, we focused heavily on the actions of options traders, because it seemed to represent a clear and present danger. While markets as a whole held up okay in the aftermath, there were pockets of heavy losses, 10% or more.
The action of these traders seems to once again be triggering a sense of excessive speculation.
Last week, the smallest of options traders, those trading 10 contracts or fewer, picked up their call buying. When we look at the raw number of contracts that small traders are buying, it's astounding. Parabolic is the only accurate term.
A reasonable person would suggest, "Well, maybe they bought a lot of put options, too." It wasn't the case, though - the net difference between calls and puts bought to open is even more extreme.
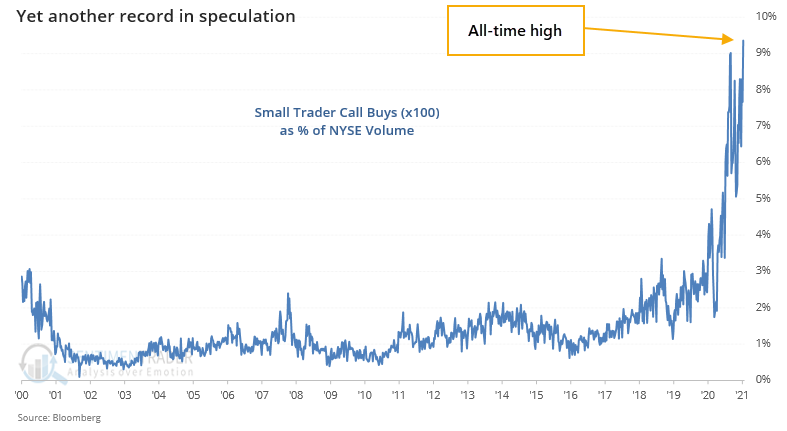
Just as troubling, this activity has become more and more of a factor. If we adjust the options volume to account for an equivalent number of shares, then we can get a rough comparison to overall market volume. And for the first time, the activity of these small traders was the equivalent of more than 9% of NYSE volume, exceeding even what we saw at the end of August.

We focus so heavily on small traders because they tend to be the most consistent contrary indicator at extremes, and because they've become such a driving force, particularly in the options market. The buying of call options from the smallest of traders remains near the highest levels ever as a proportion of all option volume.
What else we're looking at
- A complete look at the activity of options traders, especially the smallest ones
- Where we stand in terms of total options premiums spent on speculative activities
- What this means for potential dealer inventory and Gamma Exposure
- Taking a comprehensive look at a strong seasonal bias in mid-cap stocks
- Earnings reports are starting to come in, and Wall Street is expecting higher prices
- What a "risk-on" composite of relative ratios is telling us about the health of investors' appetite right now
| Stat Box In the energy sector, 100% of stocks are now trading above their 200-day moving averages. This is the first time since May 2011 that there have been such widespread uptrends. |
Sentiment from other perspectives
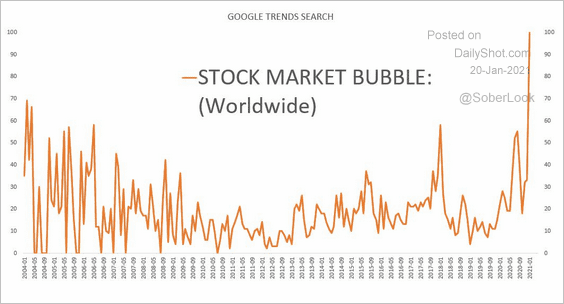
Can markets be in a bubble if everyone thinks it's a bubble? It's a meta question that shouldn't be a question at all, because history says the definitive answer is "yes." Source: Daily Shot

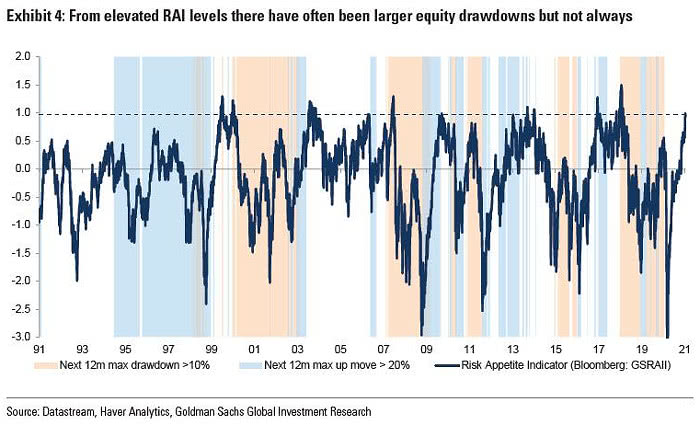
If it's a bubble, then there's money to be made (for a while), so models of sentiment have reached the upper levels of their ranges, like the Risk Appetite Index. When it's above 1, like now, there is a tendency to see a drawdown of > 10% over the next 12 months. Source: Goldman Sachs

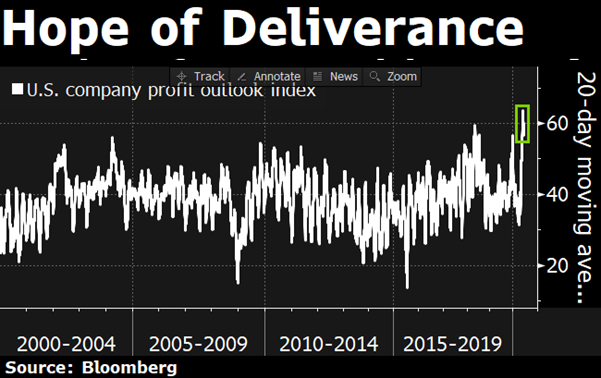
What's not to like? Stocks are hitting highs and analysts are upping earnings forecasts like crazy. They just hit a record high. Source: Bloomberg TV


