Data &
Technology
Research
Reports
Report Solutions
Reports Library
Actionable
Strategies
Free
Resources
Simple Backtest Calculator
Simple Seasonality Calculator
The Kelly Criterion Calculator
Sentiment Geo Map
Public Research Reports
Free Webinar
Pricing
Company
About
Meet Our Team
In the News
Testimonials
Client Success Stories
Contact
Log inLoginSign up
< BACK TO ALL REPORTS

Another jump in stocks cut in half

Jason Goepfert
2022-01-25
More than 42% of Nasdaq stocks are now down 50% from their highs. There is a worrying signal in crude oil as sentiment retreats from a high level.

Even more Nasdaq stocks get cut in half

A few weeks ago, we looked at the number of stocks cut in half. It's only gotten worse.

As of Friday, 42% of stocks on the Nasdaq were down by half. That's on par with the very worst markets of the past 20 years. Since the 2008 financial crisis, only 20 days from March 12, 2020, through April 16, 2020, saw more stocks down by 50% or more from their highs.

Nasdaq stocks down 50% from their highs

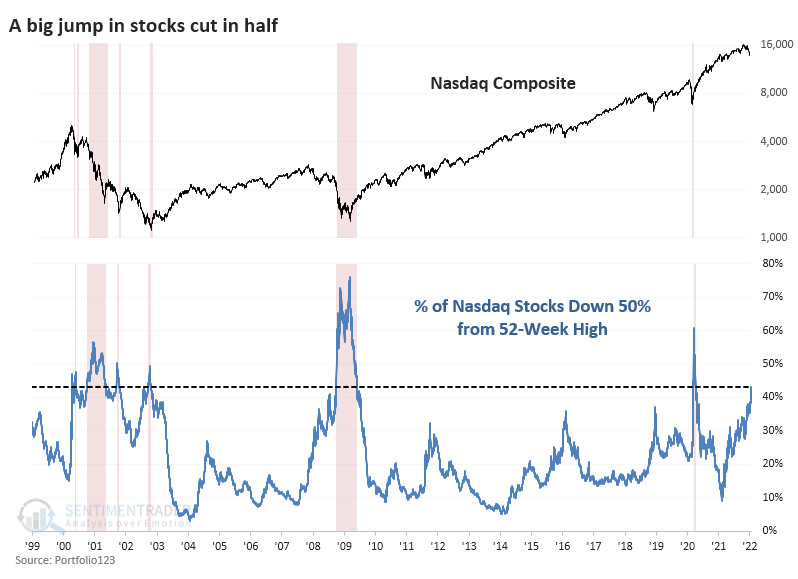
The Nasdaq Composite performed okay after any day on which 43% or more of securities had been cut in half. There were some significant losses in 2001 and 2008, though. It was a much safer bet to wait until the smoke cleared and miss trying to buy the bottom.

Curiously, relatively few stocks are down 5%, 10%, and 20% from their highs, compared to past severe declines. And while the carnage is focused on Nasdaq-listed issues, Technology stocks aren't the main drivers of the declines. A different sector has seen even worse selling pressure...

Stat box

Traders poured more than $1 billion into the GLD gold fund on Friday, the 11th time in the fund's history it saw at least a $1 billion single-day inflow. Our Backtest Engine shows that after the 10 other days, GLD showed a positive 2-month return only 2 times.


Worries about the oil market

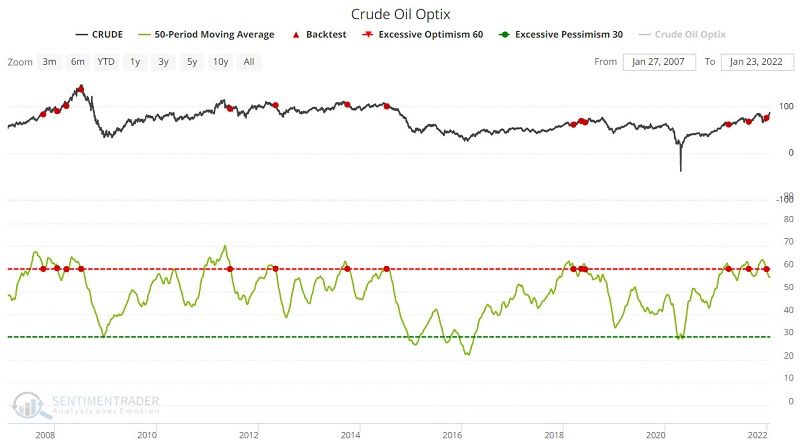
Jay showed some factors that suggest a tough time ahead for crude oil. Taken together, they do suggest that the oil market may soon become a much more volatile affair and less of a one-way street.

The chart below displays those times when the 50-day average for our crude oil Optix indicator dropped below 60. You can run this test in our Backtest Engine.

Crude oil optimism is declining from a high level

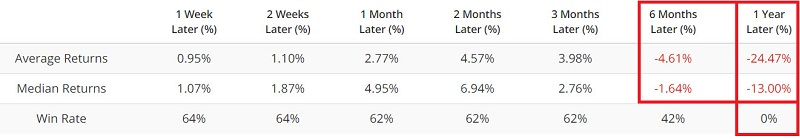
The table below displays a summary of results following previous signals. Note that results are "OK" for the first three months. After that, results tended to fall off significantly, all showing losses over the next year.

Another worrying factor is the term structure of crude oil futures, showing the relationship of the near-term futures contract to a further-out contract.

DATA &
TECHnologies
IndicatorEdge
‍
BackTestEdge
‍
Other Tools
‍
DataEdge API
RESEARCH
reports
Research Solution
‍
Reports Library
‍
actionable
Strategies
Trading Strategies
‍
Smart Stock Scanner
‍
FREE
RESOUrCES
Simple Backtest
Calculator
Simple Seasonality
Calculator
The Kelly Criterion
Calculator
Sentiment Geo Map
‍
Public Research Reports
‍
Free Webinar
COMPANY
‍
About
‍
Meet our Team
‍
In the News
‍
Testimonials
‍
Client Success Stories
Pricing
Bundle pricing
‍
Announcements
‍
FAQ
© 2024 Sundial Capital Research Inc. All rights reserved.
Setsail Marketing
TermsPrivacyAffiliate Program
Risk Disclosure: Futures and forex trading contains substantial risk and is not for every investor. An investor could potentially lose all or more than the initial investment. Risk capital is money that can be lost without jeopardizing ones’ financial security or life style. Only risk capital should be used for trading and only those with sufficient risk capital should consider trading. Past performance is not necessarily indicative of future results.

Hypothetical Performance Disclosure: Hypothetical performance results have many inherent limitations, some of which are described below. No representation is being made that any account will or is likely to achieve profits or losses similar to those shown; in fact, there are frequently sharp differences between hypothetical performance results and the actual results subsequently achieved by any particular trading program. One of the limitations of hypothetical performance results is that they are generally prepared with the benefit of hindsight. In addition, hypothetical trading does not involve financial risk, and no hypothetical trading record can completely account for the impact of financial risk of actual trading. for example, the ability to withstand losses or to adhere to a particular trading program in spite of trading losses are material points which can also adversely affect actual trading results. There are numerous other factors related to the markets in general or to the implementation of any specific trading program which cannot be fully accounted for in the preparation of hypothetical performance results and all which can adversely affect trading results.

Testimonial Disclosure: Testimonials appearing on this website may not be representative of other clients or customers and is not a guarantee of future performance or success.