Data &
Technology
Research
Reports
Report Solutions
Reports Library
Actionable
Strategies
Free
Resources
Simple Backtest Calculator
Simple Seasonality Calculator
The Kelly Criterion Calculator
Sentiment Geo Map
Public Research Reports
Free Webinar
Pricing
Company
About
Meet Our Team
In the News
Testimonials
Client Success Stories
Contact
Log inLoginSign up
< BACK TO ALL REPORTS

An 85% Chance That Stocks Won't Suffer a Pullback

Jason Goepfert
2021-11-01
From now through year-end, the S&P 500 has shown a very positive bias with low drawdowns.

It is not a secret that the 4th quarter tends to be good for stock market investors, particularly beginning in late October. Jay examined one specific period and measured the results.

The chart below displays the Annual Seasonal Trend for the S&P 500 Index.

The S&P 500's seasonality is positive

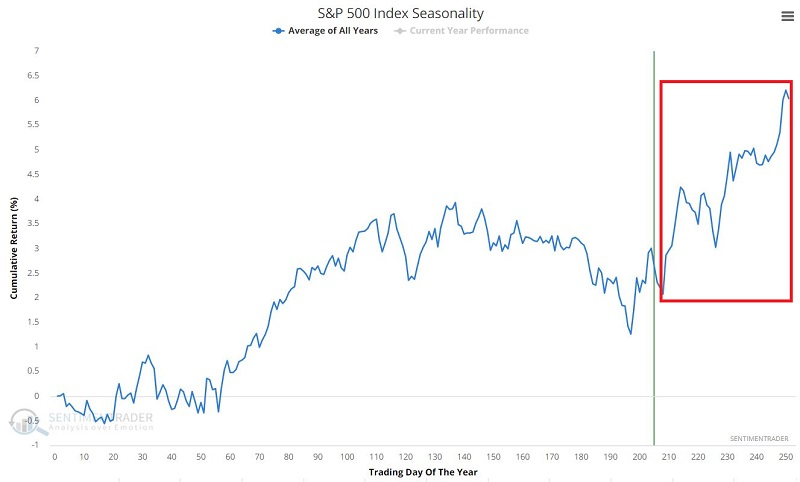
As you can see in the chart above, the market appears to show seasonal strength from Trading Day of Year (TDY) #208 through the end of the year. So that will be our test - buying the S&P 500 at the close of TDY #208 and selling at the close of the last trading day of the year.

We will start our test in 1953 (because before 1953, the NYSE was open for a few hours on Saturday). The chart below displays the year-by-year results in column form.

Most years see the S&P 500 rise this time of year

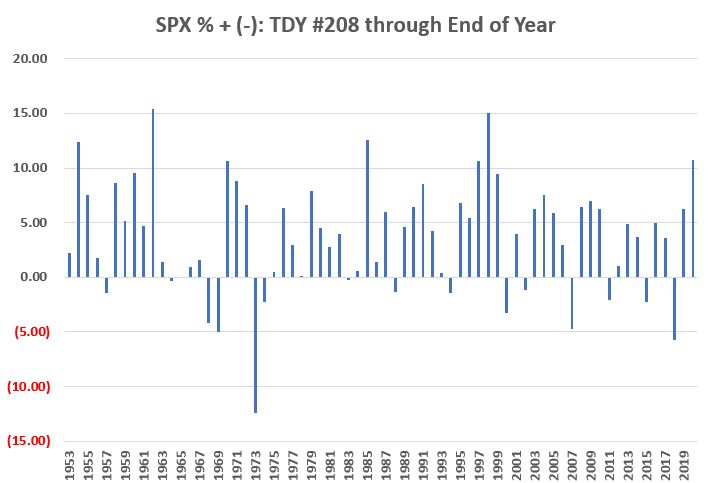
Even more impressive than the consistency was the tendency to see small drawdowns. 

  • 41.8% of all years saw a drawdown of LESS THAN -1% (a dip).
  • 85.1% of all years saw a drawdown of LESS THAN -5% (a pullback).
  • 95.5% of all years saw a drawdown of LESS THAN -10% (a correction).

It's the most wonderful time of the year for stock investors.


What else we're looking at

  • More details on S&P 500 upcoming seasonality
  • Another look at breadth in Brazilian stocks and a way to trade it using options
  • A unique look at breadth underlying the S&P 500's recent advance

Stat box

With another $2 billion inflow on Friday, traders flooded the SPY fund with an average of $1.3 billion of inflows each day last week. That's the 7th-highest amount of 2021.

Etcetera

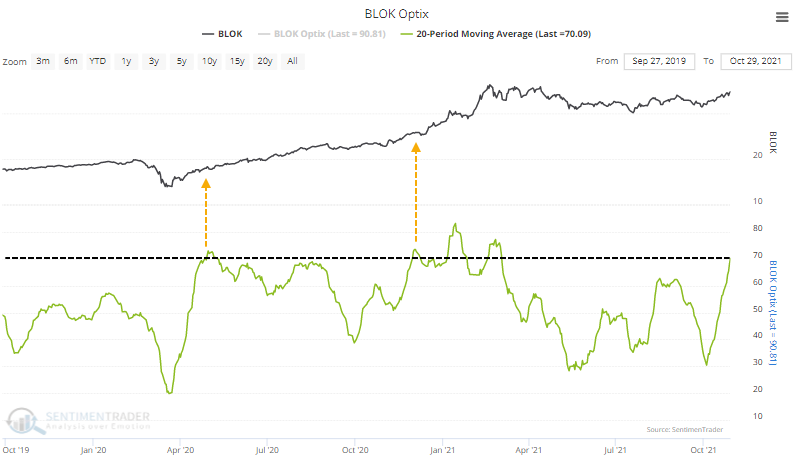
Off the 'chain. Enthusiasm for all things crypto has pushed the 20-day Optimism Index for the BLOK blockchain fund above 70% for only the 3rd time. Unlike most markets, when enthusiasm was high in this fund the last two times, its uptrend accelerated instead of decelerated.

Optimism is very high in the BLOK blockchain fund

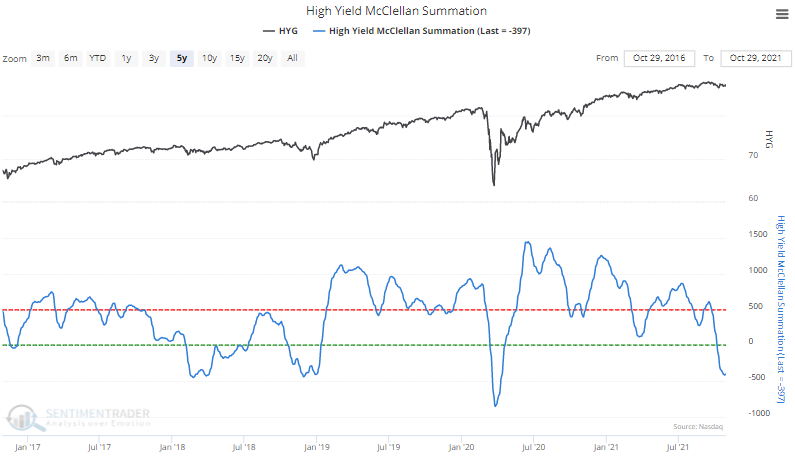
Junky action in junk bonds. Selling pressure has been fairly heavy in high-yield bonds. The McClellan Summation Index for the high-yield bond market is nearing -500 for only the 3rd time in the past 5 years.

The McClellan Summation Index for high-yield bonds is oversold

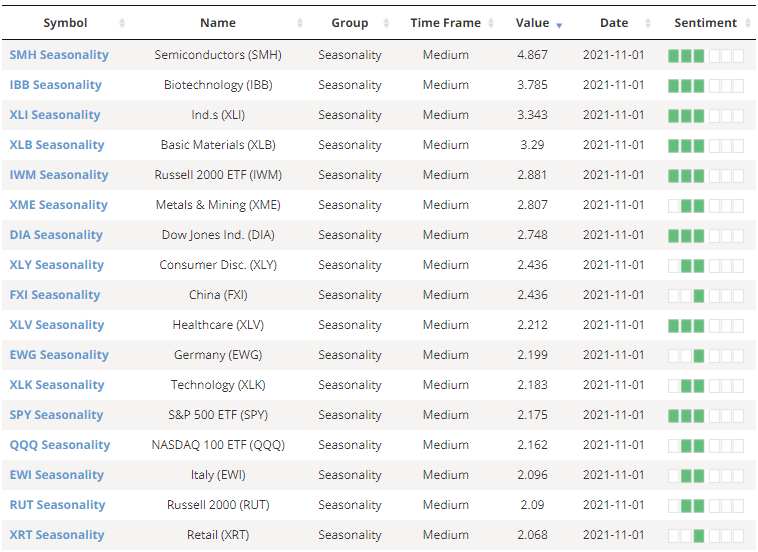
Nice time of year. Out of 46 different funds for which we track seasonality, 17 of them show an average return of more than +2% during November. High-beta groups like Semiconductors and Biotechnology lead the positive seasonal bias.

Many ETFs show strong seasonal gains in November

DATA &
TECHnologies
IndicatorEdge
‍
BackTestEdge
‍
Other Tools
‍
DataEdge API
RESEARCH
reports
Research Solution
‍
Reports Library
‍
actionable
Strategies
Trading Strategies
‍
Smart Stock Scanner
‍
FREE
RESOUrCES
Simple Backtest
Calculator
Simple Seasonality
Calculator
The Kelly Criterion
Calculator
Sentiment Geo Map
‍
Public Research Reports
‍
Free Webinar
COMPANY
‍
About
‍
Meet our Team
‍
In the News
‍
Testimonials
‍
Client Success Stories
Pricing
Bundle pricing
‍
Announcements
‍
FAQ
© 2024 Sundial Capital Research Inc. All rights reserved.
Setsail Marketing
TermsPrivacyAffiliate Program
Risk Disclosure: Futures and forex trading contains substantial risk and is not for every investor. An investor could potentially lose all or more than the initial investment. Risk capital is money that can be lost without jeopardizing ones’ financial security or life style. Only risk capital should be used for trading and only those with sufficient risk capital should consider trading. Past performance is not necessarily indicative of future results.

Hypothetical Performance Disclosure: Hypothetical performance results have many inherent limitations, some of which are described below. No representation is being made that any account will or is likely to achieve profits or losses similar to those shown; in fact, there are frequently sharp differences between hypothetical performance results and the actual results subsequently achieved by any particular trading program. One of the limitations of hypothetical performance results is that they are generally prepared with the benefit of hindsight. In addition, hypothetical trading does not involve financial risk, and no hypothetical trading record can completely account for the impact of financial risk of actual trading. for example, the ability to withstand losses or to adhere to a particular trading program in spite of trading losses are material points which can also adversely affect actual trading results. There are numerous other factors related to the markets in general or to the implementation of any specific trading program which cannot be fully accounted for in the preparation of hypothetical performance results and all which can adversely affect trading results.

Testimonial Disclosure: Testimonials appearing on this website may not be representative of other clients or customers and is not a guarantee of future performance or success.