
A useful bond trend-following indicator that hides in plain sight

Key points
- Equity Risk Premium is an indicator that has long been well-known to stock market investors
- Much lesser known is this indicator's potential utility as a bond market indicator
- A simple weekly check can offer clues to the trend of the bond market
Equity Risk Premium
The Equity Risk Premium (ERP) indicator shows the earnings yield on the S&P 500 minus the interest rate on 10-year Treasury notes. The higher the risk premium, the more attractive stocks are relative to bonds. Most investors attempt to discern trends in ERP and how they relate to stock price movements (for example).
However, we will take a different route and compare ERP to the 30-year treasury bond, as shown in the chart below.
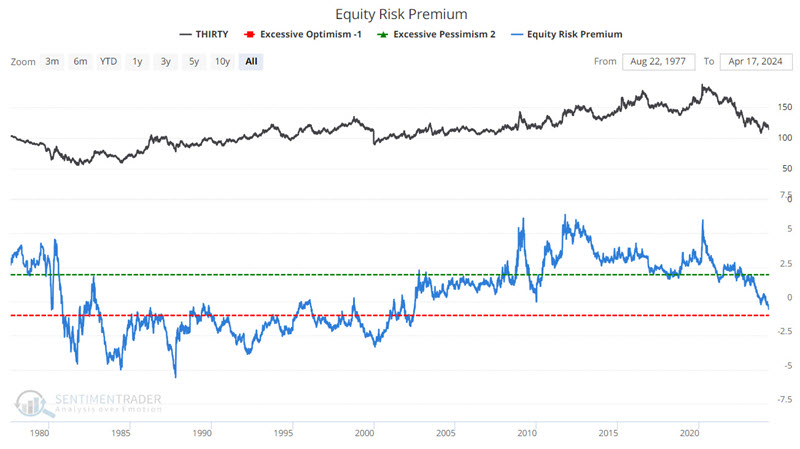
Just eyeballing the chart above reveals a reasonable degree of correlation between the two data series in the chart above. Mathematically, the two have a correlation coefficient of 67%.
Designating the trend for treasury bonds Equity Risk Premium
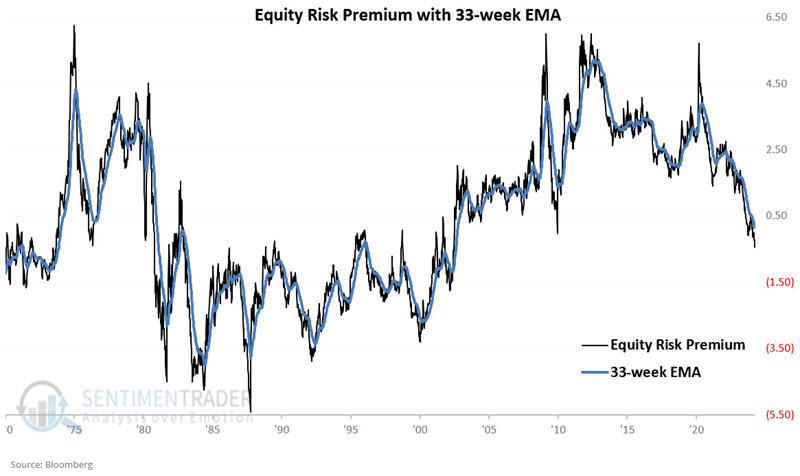
The chart below displays a weekly chart of ERP with a 33-week exponential moving average.
The chart below displays the difference between the Equity Risk Premium and its 33-week exponential moving average.
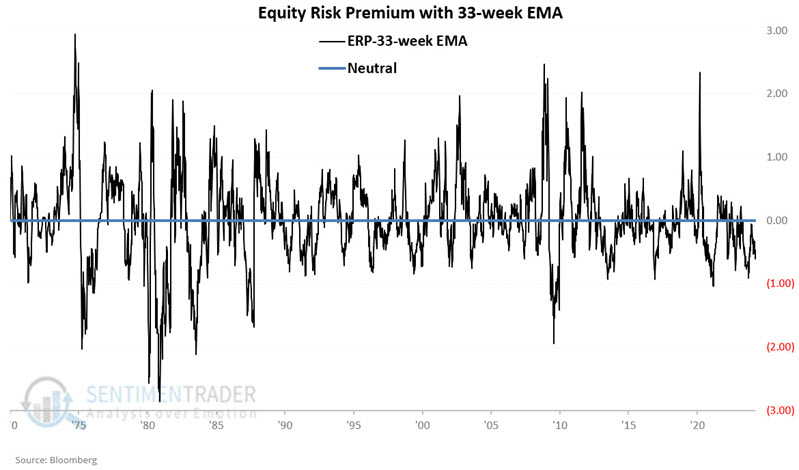
We will designate positive readings as favorable for long-term treasury bonds and negative readings as unfavorable for long-term treasury bonds.
Analyzing Results
Let's first stipulate that this approach is not intended as a standalone trading model but rather as a weight of the evidence trend-following indicator. Nevertheless, we will examine the results as if they were used as a standalone model for trading 30-year treasury bond futures. Each 1-point movement in the contract's price represents a $1,000 increase or decrease in the value of the futures contract.
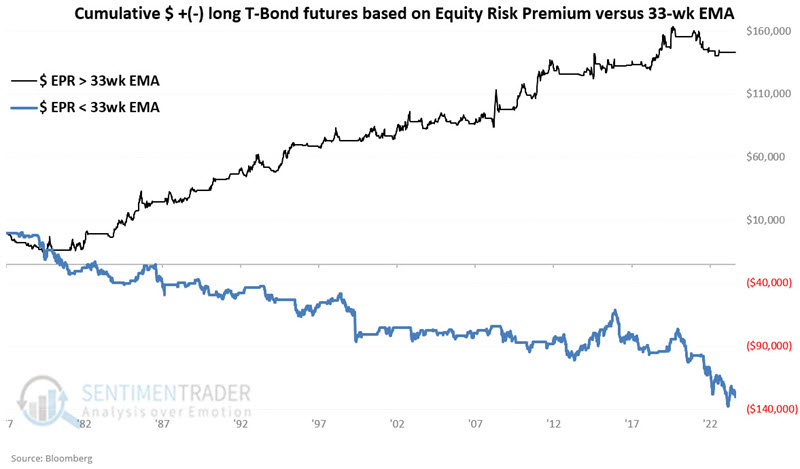
The chart below displays the hypothetical $ +(-) achieved by holding a long position in 30-year treasury bond futures only when the Equity Risk Premium closed the previous week above its 33-week exponential moving average.
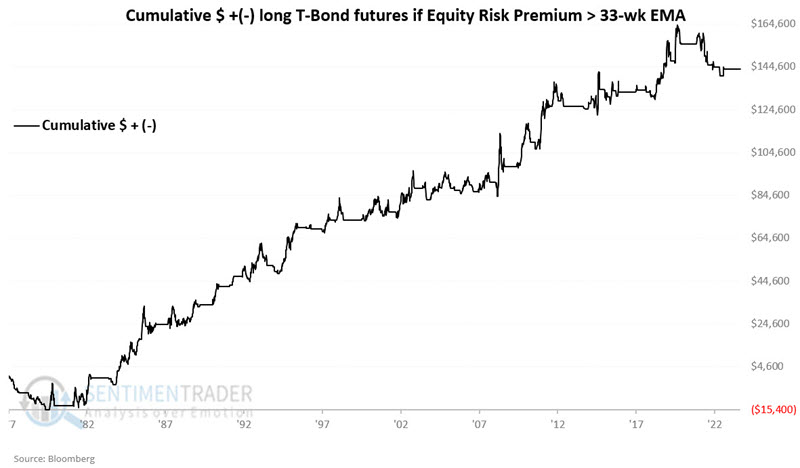
From 1977-08-26 through 2024-04-12, the hypothetical gain is +$143,569.
The following chart displays the hypothetical $ +(-) achieved by holding a long position in 30-year treasury bond futures only when the Equity Risk Premium closed the previous week below its 33-week exponential moving average.
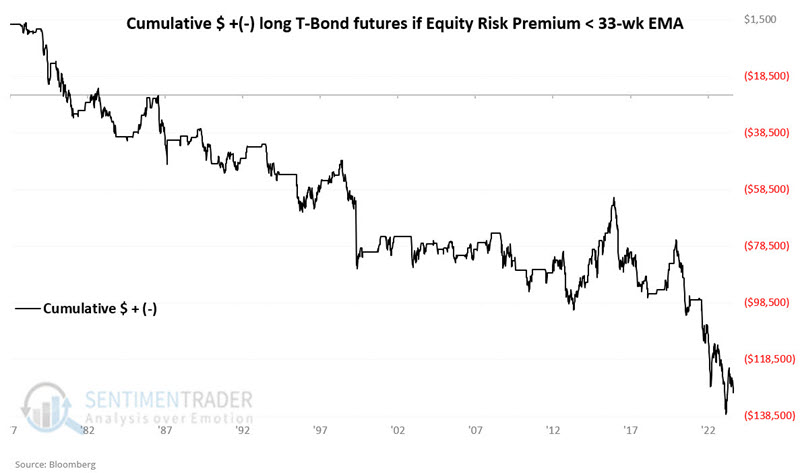
From 1977-08-26 through 2024-04-12, the hypothetical loss is -$130,312.
The chart below combines the two above to highlight the contrast - and the potential value as a trend-following indicator.
A trader wishing to play a bearish bond market would sell short treasury bond futures in real-world trading. The chart below displays the hypothetical $ +(-) from:
- Holding a long position in t-bond futures if ERP > 33wk EMA
- Holding a short position in t-bond futures if ERP < 33wk EMA
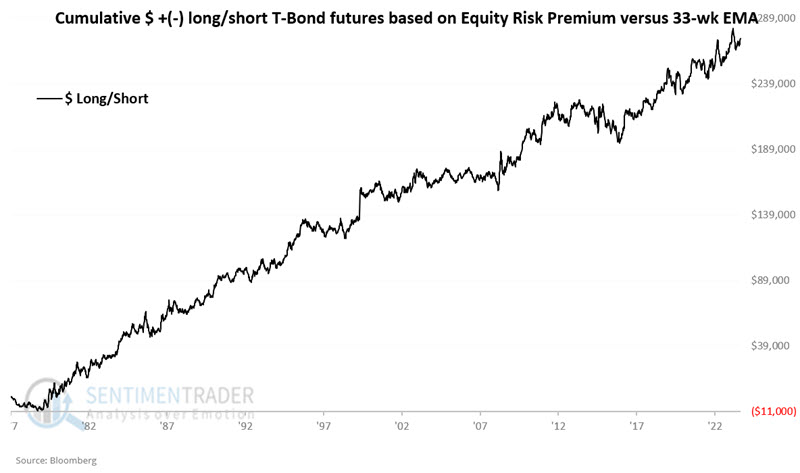
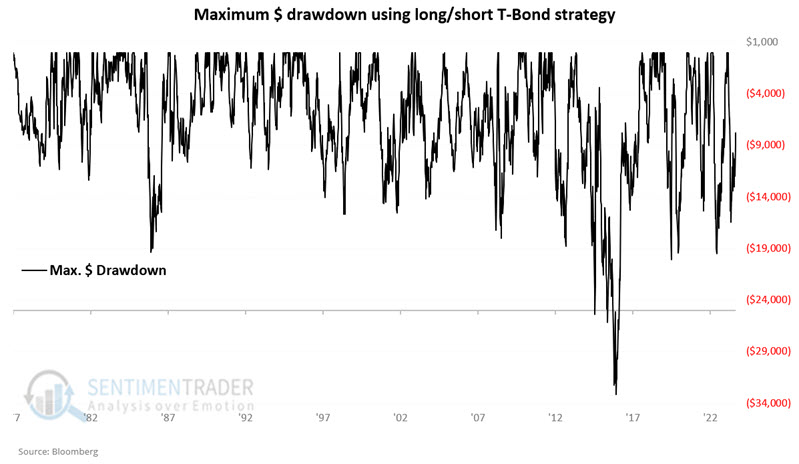
This simple method appears to do a reasonably good job of staying on the right side of the bond market. That said, anyone tempted to rely on this as a standalone trading model should note the drawdowns in the chart below - including a maximum drawdown of more than -$33K on a 1-lot of treasury bond futures.
What the research tells us…
Having a method to identify the primary trend objectively is a potentially powerful tool for any trader or investor. While far from perfect, the Equity Risk Premium appears to be a potentially helpful candidate for bond traders.