A top-heavy market tends to topple
The big winners just keep on winning, and it's starting to unnerve a lot of investors. It turns out they have a good reason for concern.
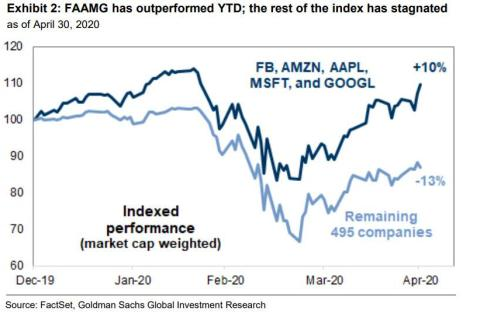
Most of us have seen some version of a chart like this from Goldman Sachs floating around:

Some combination of FAANG or FAAMG (Facebook, Amazon, Apple, Netflix - or Microsoft - and Google) has been handily beating most other stocks. And that matters, because those stocks are huge, and they're driving a big portion of the gains.
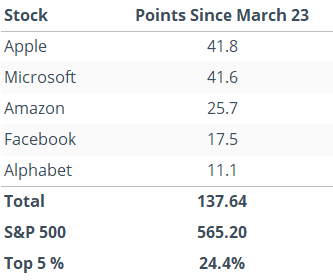
In the 35 days since the March 23 bottom, the top 5 drivers within the S&P 500 have accounted for 138 points out of the total 565 that the S&P has gained. So, only 5 stocks have accounted for more than 24% of the total point gain.

We looked at every 35-day rally off of a 52-week low over the past 30 years and compared those that were the most top-heavy versus those that were more evenly spread, meaning the top 5 stocks made up less than 20% of the S&P's gains.
There was a very stark difference between the two, with top-heavy rallies not faring well.
This is an abridged version of our recent reports and notes. For immediate access with no obligation, sign up for a 30-day free trial now.
We also looked at:
- Tables showing rallies when the top 5 stocks in the S&P accounted for more vs less than 20% of the index's gains
- What happens when the S&P 500 gets rejected hard from its 200-day moving average
- More and more stocks are triggering MACD sell signals
- The tech/finance and finance/S&P ratios are hitting true extremes

