Data &
Technology
Research
Reports
Report Solutions
Reports Library
Actionable
Strategies
Free
Resources
Simple Backtest Calculator
Simple Seasonality Calculator
The Kelly Criterion Calculator
Sentiment Geo Map
Public Research Reports
Free Webinar
Pricing
Company
About
Meet Our Team
In the News
Testimonials
Client Success Stories
Contact
Log inLoginSign up
< BACK TO ALL REPORTS

A surge of small proportions

Jason Goepfert
2020-11-10
The small-cap Russell 2000 has seen enough of a push that its 50-day moving average moved more than 8% above its 200-day average.

Out of all the major indexes, none are benefitting from the positive vaccine developments more than the Russell 2000 index of small-capitalization stocks.

Even without Monday's massive rally, it has performed well enough that its medium-term trend has jumped well above its long-term one, thanks to a kick-off surge in early October. Respected technician Helene Meisler noted that the 50-day average of the index has moved the most above its 200-day average since 2017.

Russell 2000 spread between 50 and 200 day average

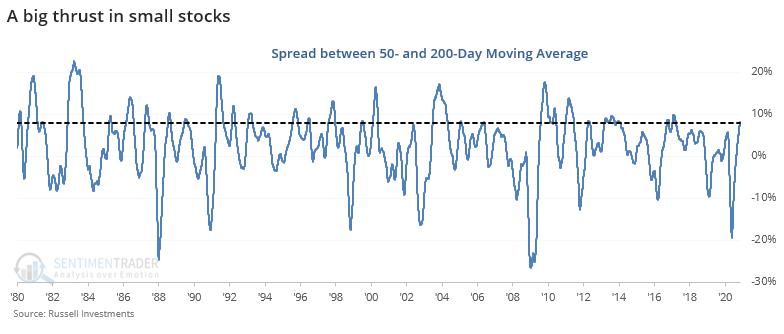
While there have been wider spreads between the two trend measures, by the time it reached 8%, it has been a good sign for the index. 

Returns were okay over the short- to medium-term but really shined over the next year. There were no losses out of the 11 signals, and the risk/reward was impressively skewed to the upside.


What else is happening

These are topics we explored in our most recent research. For immediate access with no obligation, sign up for a 30-day free trial now.

  • Russell 2000 returns after big spreads between the 50- and 200-day moving averages
  • What happened to the broader market after those signals
  • Monday's surge helped trigger another Zweig Breadth Thrust
  • The S&P 500 suffered a breakout and reversal - what that's meant for forward returns (it's probably not what you think)
  • The Dow Industrials outdid the Nasdaq 100 by more than 5%
  • For the 1st time in 8 months, the Dow hit a new intraday high

Stat Box

Energy stocks surged on Monday and are up more than 19% less than 10 days after sinking to a 6-month low. Going back to 1926, they've done this only 6 other times. After 5 of them, the sector fell back over the next 1-3 months.

Sentiment from other perspectives

We don't necessarily agree with everything posted here - some of our work might directly contradict it - but it's often worth knowing what others are watching.

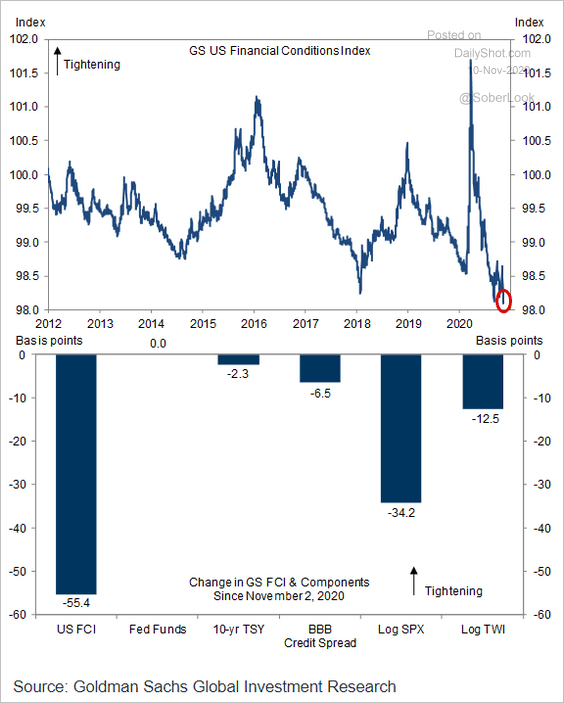
1. Investor behavior has allowed financial conditions to improve to the best in years - Goldman Sachs via Daily Shot

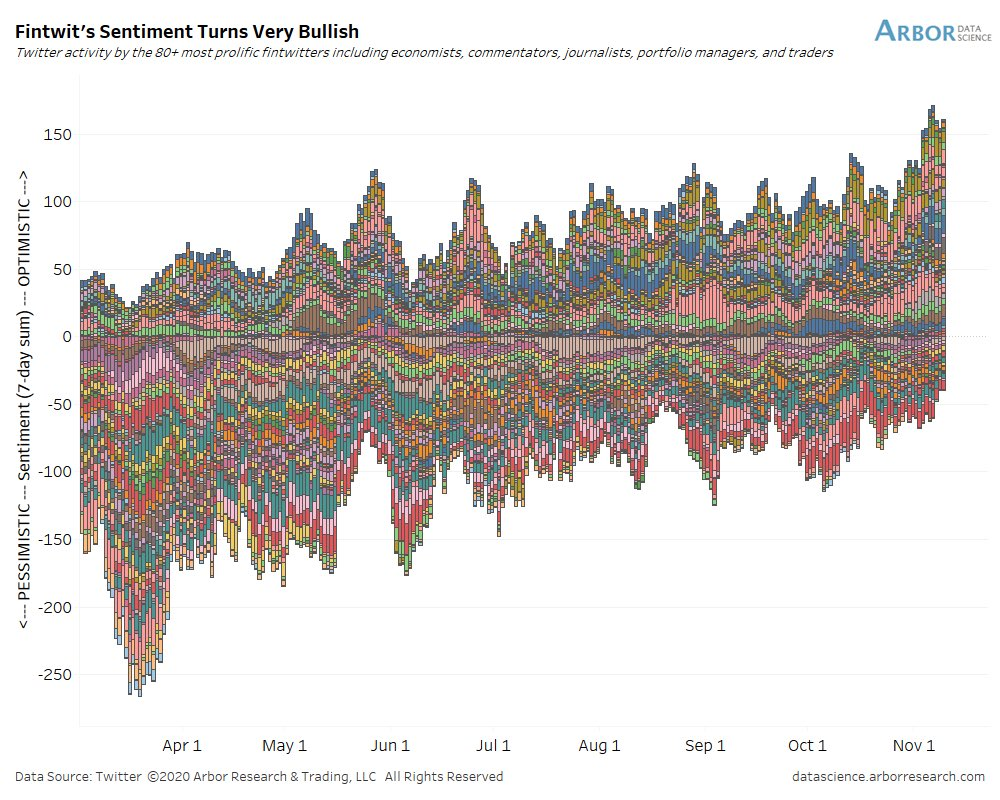
2. Investors on Twitter have never been more optimistic - Arbor Research

3. That's probably why they're buying a lot of call options - Urban Carmel

DATA &
TECHnologies
IndicatorEdge
‍
BackTestEdge
‍
Other Tools
‍
DataEdge API
RESEARCH
reports
Research Solution
‍
Reports Library
‍
actionable
Strategies
Trading Strategies
‍
Smart Stock Scanner
‍
FREE
RESOUrCES
Simple Backtest
Calculator
Simple Seasonality
Calculator
The Kelly Criterion
Calculator
Sentiment Geo Map
‍
Public Research Reports
‍
Free Webinar
COMPANY
‍
About
‍
Meet our Team
‍
In the News
‍
Testimonials
‍
Client Success Stories
Pricing
Bundle pricing
‍
Announcements
‍
FAQ
© 2024 Sundial Capital Research Inc. All rights reserved.
Setsail Marketing
TermsPrivacyAffiliate Program
Risk Disclosure: Futures and forex trading contains substantial risk and is not for every investor. An investor could potentially lose all or more than the initial investment. Risk capital is money that can be lost without jeopardizing ones’ financial security or life style. Only risk capital should be used for trading and only those with sufficient risk capital should consider trading. Past performance is not necessarily indicative of future results.

Hypothetical Performance Disclosure: Hypothetical performance results have many inherent limitations, some of which are described below. No representation is being made that any account will or is likely to achieve profits or losses similar to those shown; in fact, there are frequently sharp differences between hypothetical performance results and the actual results subsequently achieved by any particular trading program. One of the limitations of hypothetical performance results is that they are generally prepared with the benefit of hindsight. In addition, hypothetical trading does not involve financial risk, and no hypothetical trading record can completely account for the impact of financial risk of actual trading. for example, the ability to withstand losses or to adhere to a particular trading program in spite of trading losses are material points which can also adversely affect actual trading results. There are numerous other factors related to the markets in general or to the implementation of any specific trading program which cannot be fully accounted for in the preparation of hypothetical performance results and all which can adversely affect trading results.

Testimonial Disclosure: Testimonials appearing on this website may not be representative of other clients or customers and is not a guarantee of future performance or success.