
A split market as oil tumbles into a bear market

New lows spike as trends deteriorate
A new signal from a voting member in Dean's TCTM Risk Warning Model registered an alert on Tuesday.
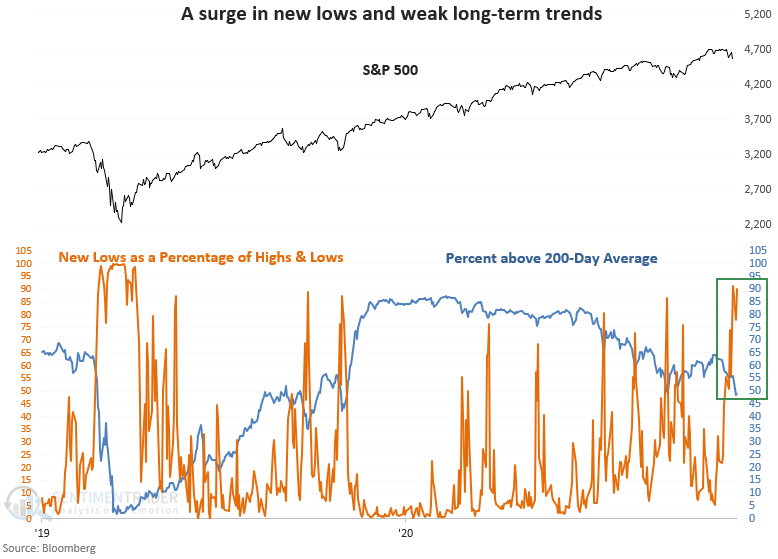
As a percentage of highs and lows, new lows have risen to the highest level since the pandemic crash. At the same time, the percentage of NYSE common stock members above their 200-day moving average has deteriorated to the lowest level in more than a year. When we compare the long-term stock trends to the price of the S&P 500, the divergence is noteworthy.
This signal triggered 25 other times over the past 93 years. After the others, future returns and win rates were weak in the 2-4 week time frame. The 1-year results look unfavorable.

| Stat box Fewer than 14% of major global equity market indexes are trading above their 50-day moving averages. This is the fewest in more than a year. |
Crude oil's new bear market
After a plunge to start the week, crude oil bounced back quickly. The selling pressure was enough to push it more than 20% below its prior 52-week high, the first bear market in nearly a year.
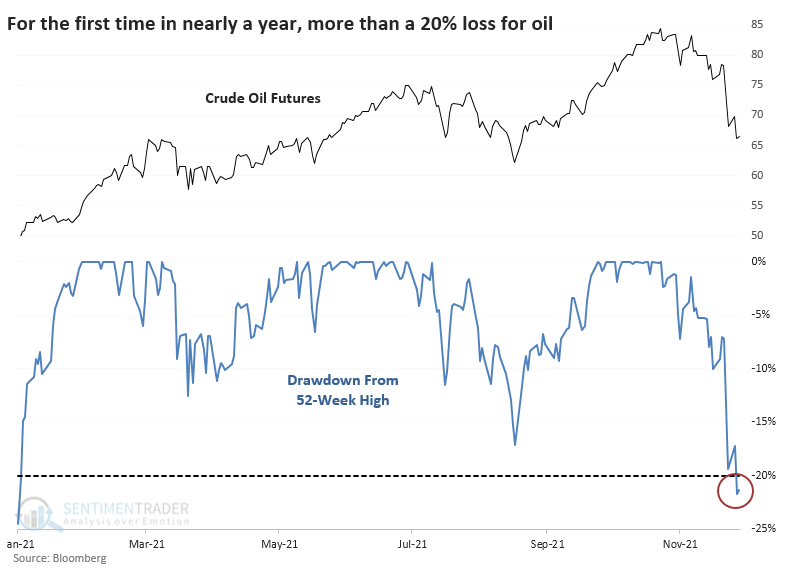
It took crude oil only 24 days to cycle from a new high to a bear market. This is relatively quick but not totally out of bounds for such a hit-or-miss market. Since 1985, there have been 12 other times when oil cycled into a bear market in under 60 days, and it was not a good sign for future returns.
There is not a perfect correlation between crude oil and the price of Energy stocks. Even so, these new bear markets in oil were not all that great of a sign for the sector, even when using total return, which includes sometimes-hefty dividend payouts.
According to Bloomberg, the currency with the most significant 60-day correlation to crude oil is the Canadian dollar. So, it's not too surprising that currency had trouble holding any gains.

What a split market looks like
Churning is a word typically used to describe a particular type of stock market activity. It refers to a period where the major market averages (Dow, S&P, Nasdaq, Russell 2000) continue to move mostly higher, while at the same time, a lot of individual stocks begin to experience weakness.
While the market appears strong on the surface, internally, there is significant weakness developing. Another phrase to describe this state of affairs is, "the Generals are leading, but the troops are not following." We have highlighted many different signs of churning in recent weeks.
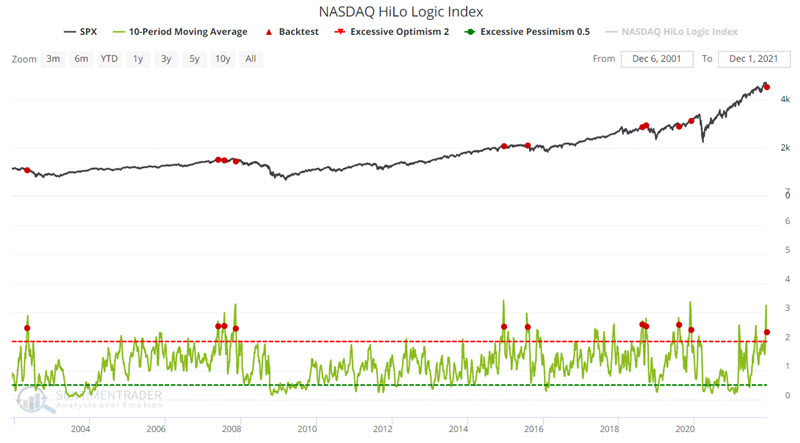
Jay used the example of one twist on the NASDAQ HiLo Logic Index to illustrate the potential for subpar index returns in the months ahead.
Norman Fosback created the HiLo Logic Index in 1979. Intended as a way to observe "split" market conditions, it looks for times when there are both a large number of 52-week highs AND 52-week lows among securities on the exchange. When there are a lot of both, the market is severely split between winners and losers, and it tends to be a negative for stocks. When there is a very low number, the market is heavily one-sided, which tends to be a positive for stocks.
For this test, we will identify those times in the past 20 years when the 10-day average of the NASDAQ HiLo Logic Index hs dropped below 2.60 for the first time in a month. The twist is that we will measure results by looking at the S&P 500 Index (essentially as a proxy for the "market").
Jay then took an in-depth look at market action following the previous signals to understand better the potential implication of the most recent signal for index investors.