Data &
Technology
Research
Reports
Report Solutions
Reports Library
Actionable
Strategies
Free
Resources
Simple Backtest Calculator
Simple Seasonality Calculator
The Kelly Criterion Calculator
Sentiment Geo Map
Public Research Reports
Free Webinar
Pricing
Company
About
Meet Our Team
In the News
Testimonials
Client Success Stories
Contact
Log inLoginSign up
< BACK TO ALL REPORTS

A Sign That Gold Miners Have Turned

Jason Goepfert
2021-08-05
The percentage of gold mining stocks trading above their 50 day moving averages is trying to curl higher from a low level.

Gold miners have been struggling to hold up with a multitude of cross-currents.

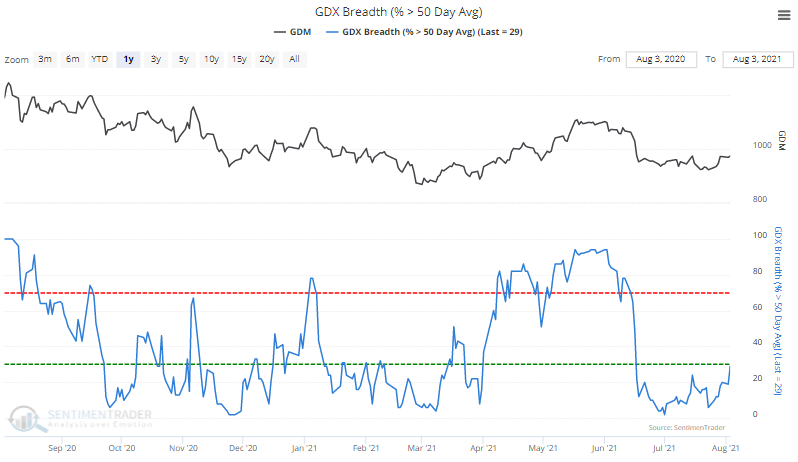
Over the past 20 days, an average of fewer than 12% of gold miners were trading above their 50-day moving average, which is now starting to curl higher.

Gold miners GDX members above 50-day moving average

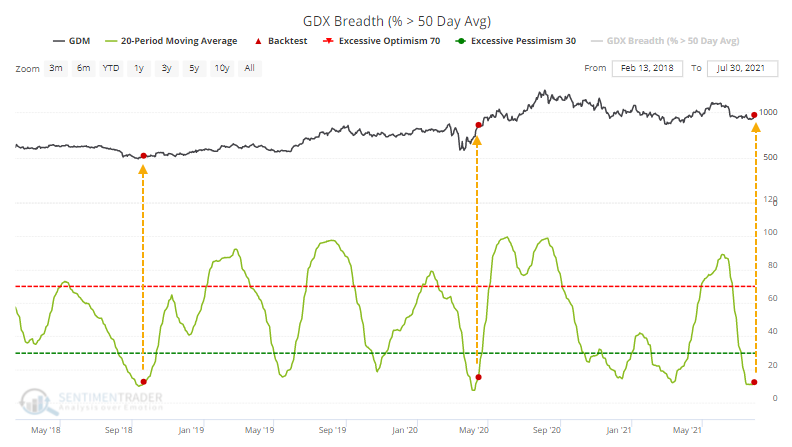
The last two times this triggered in the past few years, it preceded sustained rallies in the miners. Even lesser extremes led to further price gains.

Our Backtest Engine shows that miners often fell back in the very short-term before recovering over the next couple of months (click the Backtest Engine link to load this test).

Going back further, we can see that there was a high correlation between returns over the next two weeks and those over the next six months. The "correlation" row at the bottom of the table shows this relationship. This suggests that if buyers are interested enough to continue the nascent recovery from oversold conditions, then there is a decent probability that they will continue to do so in the months ahead.

NOTE: We update several unique breadth measures for gold mining stocks each day for subscribers.


What else we're looking at

  • Returns in gold miners following an upturn in members above their 50-day moving averages
  • What longer-term breadth metrics are showing in gold miners
  • What sentiment and seasonality are suggesting for sugar prices
  • An update on Composite Market Breadth and how it compares to past market peaks

Stat box

Among major developed markets, 100% of them have had a rising 200-day moving average for 150 consecutive trading days. That's the 5th-longest streak of positive long-term trends in the past 50 years.

Etcetera

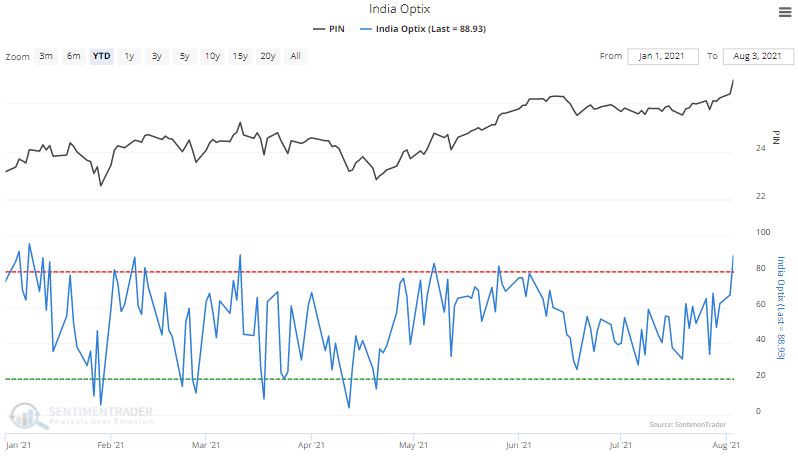
PINned. Optimism on Indian stocks soared, with the Optimism Index on the PIN fund rising to nearly 90%, the highest since March.

india pin optimism index sentiment

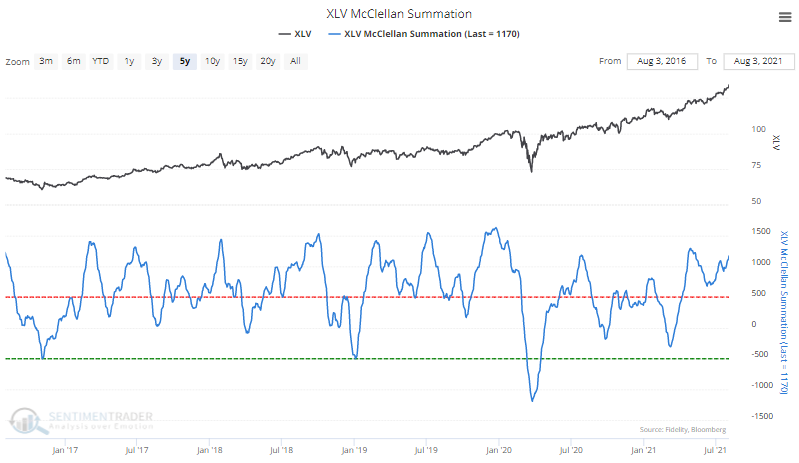
Very healthy. The McClellan Summation Index for the Health Care sector has climbed to nearly +1200, the highest in a couple of months and ranking among the highest readings in more than 20 years.

xlv health care mcclellan summation index

Minor recovery in miners. Nearly a third of gold miners are now trading above their 50-day moving averages, the most in over a month but below the threshold that typically defines solid uptrends.

gdx gold miners above 50 day moving average

DATA &
TECHnologies
IndicatorEdge
‍
BackTestEdge
‍
Other Tools
‍
DataEdge API
RESEARCH
reports
Research Solution
‍
Reports Library
‍
actionable
Strategies
Trading Strategies
‍
Smart Stock Scanner
‍
FREE
RESOUrCES
Simple Backtest
Calculator
Simple Seasonality
Calculator
The Kelly Criterion
Calculator
Sentiment Geo Map
‍
Public Research Reports
‍
Free Webinar
COMPANY
‍
About
‍
Meet our Team
‍
In the News
‍
Testimonials
‍
Client Success Stories
Pricing
Bundle pricing
‍
Announcements
‍
FAQ
© 2024 Sundial Capital Research Inc. All rights reserved.
Setsail Marketing
TermsPrivacyAffiliate Program
Risk Disclosure: Futures and forex trading contains substantial risk and is not for every investor. An investor could potentially lose all or more than the initial investment. Risk capital is money that can be lost without jeopardizing ones’ financial security or life style. Only risk capital should be used for trading and only those with sufficient risk capital should consider trading. Past performance is not necessarily indicative of future results.

Hypothetical Performance Disclosure: Hypothetical performance results have many inherent limitations, some of which are described below. No representation is being made that any account will or is likely to achieve profits or losses similar to those shown; in fact, there are frequently sharp differences between hypothetical performance results and the actual results subsequently achieved by any particular trading program. One of the limitations of hypothetical performance results is that they are generally prepared with the benefit of hindsight. In addition, hypothetical trading does not involve financial risk, and no hypothetical trading record can completely account for the impact of financial risk of actual trading. for example, the ability to withstand losses or to adhere to a particular trading program in spite of trading losses are material points which can also adversely affect actual trading results. There are numerous other factors related to the markets in general or to the implementation of any specific trading program which cannot be fully accounted for in the preparation of hypothetical performance results and all which can adversely affect trading results.

Testimonial Disclosure: Testimonials appearing on this website may not be representative of other clients or customers and is not a guarantee of future performance or success.