Data &
Technology
Research
Reports
Report Solutions
Reports Library
Actionable
Strategies
Free
Resources
Simple Backtest Calculator
Simple Seasonality Calculator
The Kelly Criterion Calculator
Sentiment Geo Map
Public Research Reports
Free Webinar
Pricing
Company
About
Meet Our Team
In the News
Testimonials
Client Success Stories
Contact
Log inLoginSign up
< BACK TO ALL REPORTS

A rare dual pullback in stocks and bonds has investors in a tizzy

Jason Goepfert
2022-02-16
Both stock and bond total returns have dropped more than 5% from their highs, an extremely rare dual pullback. Utility trends are (relatively) receding.

An extremely rare dual pullback in stocks and bonds

It's been a heckuva year for investors, and not in a good way. The overwhelming majority of investment wealth in the U.S. is tied to stocks and bonds, and both have been broadly hit. Neither asset class has provided ballast to the other.

We saw earlier this week that high-yield bonds have suffered heavy selling over the past month, on par with some of the worst declines in 15 years. It's not just junk bonds that investors are selling, though. Investment-grade bonds, municipals, Treasuries - all have suffered.

This sell-everything mentality has created an unusual situation where both stocks and bonds are losing ground simultaneously.

It's extremely rare to see both stocks and bonds in a pullback at the same time, defined as a 5% decline from a 52-week high. Starting late last week, the total return in the S&P 500 and Bloomberg U.S. Aggregate Bond Index were both more than 5% off their highs. 

It's rare to see a dual pullback in stocks and bonds

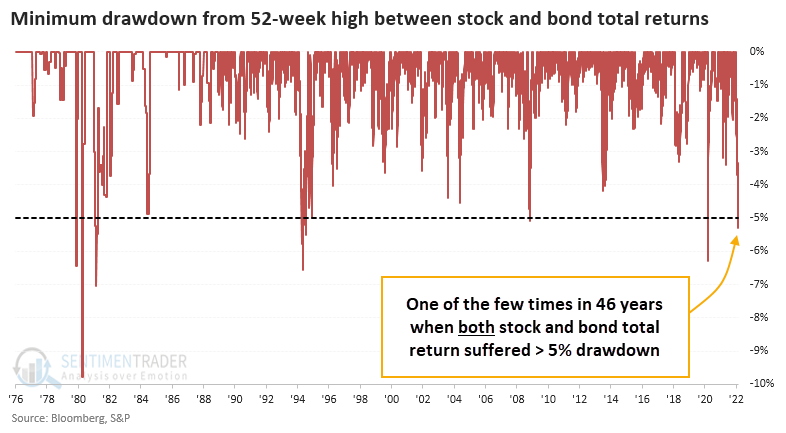
These dual pullbacks were a good sign that whatever macro concerns were driving the selling was mostly overdone. The S&P did suffer some losses in the months ahead, especially in 2008 as the final bout of panic hit markets. 

It's been mostly a tailwind for the bond market over the past 40+ years, so it's not a big surprise that the total return on the Bloomberg U.S. Bond Aggregate was mouth-watering. 

Stat box

The 50-day Optimism Index for the broad-based bond fund, BND, has dropped below 30%, the lowest optimism among all funds and markets we follow. It is the 3rd-lowest reading since the fund's inception, next to July 2013 and March 2021.


Risk-appetite is returning according to medium-term stock trends

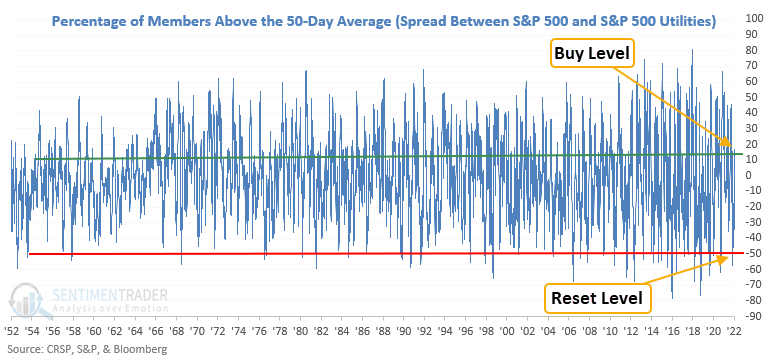
A trading model that measures the difference between medium-term uptrends for S&P 500 and S&P 500 utility sector members registered an alert on Monday at the close of trading.

Dean showed that the model identifies when the spread between members above the 50-day average reverses from -50% to greater than 11%. The reversal in medium-term uptrends suggests that the broad market is potentially transitioning from a more defensive environment to a more risk-seeking one. It might also indicate that interest-rate-sensitive stocks have succumbed to the pressure of higher rates.

Medium-term trends in the S&P are surpassing those in Utiliites

This signal triggered 35 other times over the past 68 years. After the others, S&P 500 future returns, win rates, and risk/reward profiles were excellent across all time frames, especially the 2-month window. 

DATA &
TECHnologies
IndicatorEdge
‍
BackTestEdge
‍
Other Tools
‍
DataEdge API
RESEARCH
reports
Research Solution
‍
Reports Library
‍
actionable
Strategies
Trading Strategies
‍
Smart Stock Scanner
‍
FREE
RESOUrCES
Simple Backtest
Calculator
Simple Seasonality
Calculator
The Kelly Criterion
Calculator
Sentiment Geo Map
‍
Public Research Reports
‍
Free Webinar
COMPANY
‍
About
‍
Meet our Team
‍
In the News
‍
Testimonials
‍
Client Success Stories
Pricing
Bundle pricing
‍
Announcements
‍
FAQ
© 2024 Sundial Capital Research Inc. All rights reserved.
Setsail Marketing
TermsPrivacyAffiliate Program
Risk Disclosure: Futures and forex trading contains substantial risk and is not for every investor. An investor could potentially lose all or more than the initial investment. Risk capital is money that can be lost without jeopardizing ones’ financial security or life style. Only risk capital should be used for trading and only those with sufficient risk capital should consider trading. Past performance is not necessarily indicative of future results.

Hypothetical Performance Disclosure: Hypothetical performance results have many inherent limitations, some of which are described below. No representation is being made that any account will or is likely to achieve profits or losses similar to those shown; in fact, there are frequently sharp differences between hypothetical performance results and the actual results subsequently achieved by any particular trading program. One of the limitations of hypothetical performance results is that they are generally prepared with the benefit of hindsight. In addition, hypothetical trading does not involve financial risk, and no hypothetical trading record can completely account for the impact of financial risk of actual trading. for example, the ability to withstand losses or to adhere to a particular trading program in spite of trading losses are material points which can also adversely affect actual trading results. There are numerous other factors related to the markets in general or to the implementation of any specific trading program which cannot be fully accounted for in the preparation of hypothetical performance results and all which can adversely affect trading results.

Testimonial Disclosure: Testimonials appearing on this website may not be representative of other clients or customers and is not a guarantee of future performance or success.