Data &
Technology
Research
Reports
Report Solutions
Reports Library
Actionable
Strategies
Free
Resources
Simple Backtest Calculator
Simple Seasonality Calculator
The Kelly Criterion Calculator
Sentiment Geo Map
Public Research Reports
Free Webinar
Pricing
Company
About
Meet Our Team
In the News
Testimonials
Client Success Stories
Contact
Log inLoginSign up
< BACK TO ALL REPORTS

A MoMo Market Even Better Than 2013 and 2017

Jason Goepfert
2021-08-13
For 9 straight months, no fewer than 65% of securities on the NYSE have traded above their 200-day moving averages.

Trends in 2021 have overpowered every other factor we typically consider when it comes to stocks. Sentiment hasn't mattered. Seasonality hasn't mattered. Divergences haven't mattered.

We saw earlier this week how this year has been among the best in history. It's even been remarkable for world markets. Within the universe of securities traded on the NYSE, this is the best market in over a decade and among the best in 60 years.

For nine months - 189 consecutive trading days - more than 65% of securities trading on that exchange have held above their 200-day moving averages. Even the remarkable momentum markets in 2013 and 2017 couldn't match this streak.

NYSE securities above their 200 day moving average

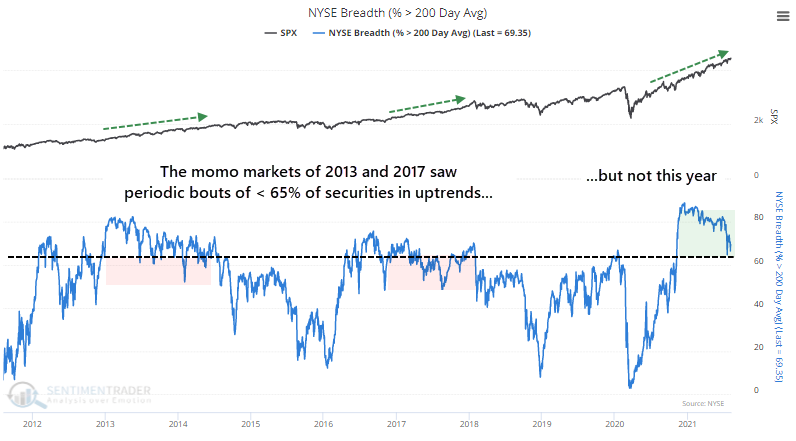
Dating back to 1927, this long of a streak has been rarely exceeded. Over the past 50 years, the only times the S&P 500 enjoyed a longer streak was when stocks began recovering following the 1970s malaise and the post-bubble bust in the early 2000s.

If we go back to 1928 and look at forward returns once we reached 189 days with more than 65% of securities above their long-term trendlines, it proved to be mostly a good sign though the medium-term of 2-3 months showed some sketchy returns.


What else we're looking at

  • Full returns in the S&P 500 following 189 days without a drop in NYSE securities above their 200-day averages
  • How sectors and factors fared after such long streaks of uptrends
  • A setup in the Japanese yen and ways to trade it using futures or a low-risk way with options
  • Another look at momentum in the Financials sector

Stat box

The S&P 500 fund, SPY, which is possibly the most important ETF in the world, has traded under 50 million shares for 7 consecutive days. This is only the 2nd time it has done so in the past 15 years, next to 8 straight days in October 2019.

Etcetera

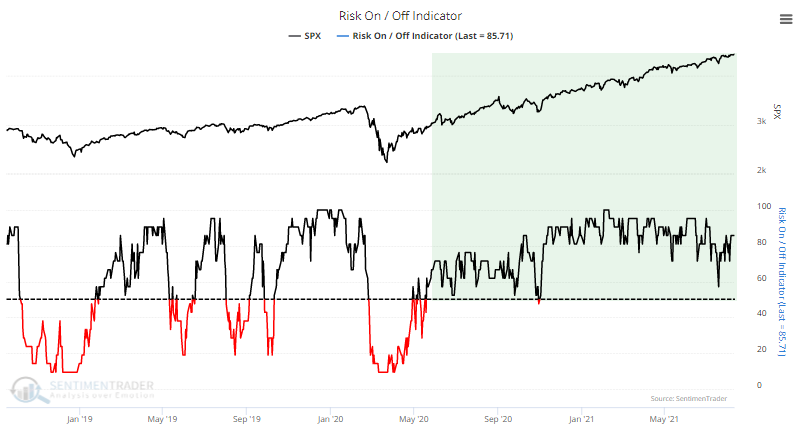
Risk-on (and on and on). It has now been over 300 days since our aggregate Risk-On Indicator has dipped much below 50%. This is the longest stretch of risk-on behavior among investors over the past 22 years.

risk on indicator

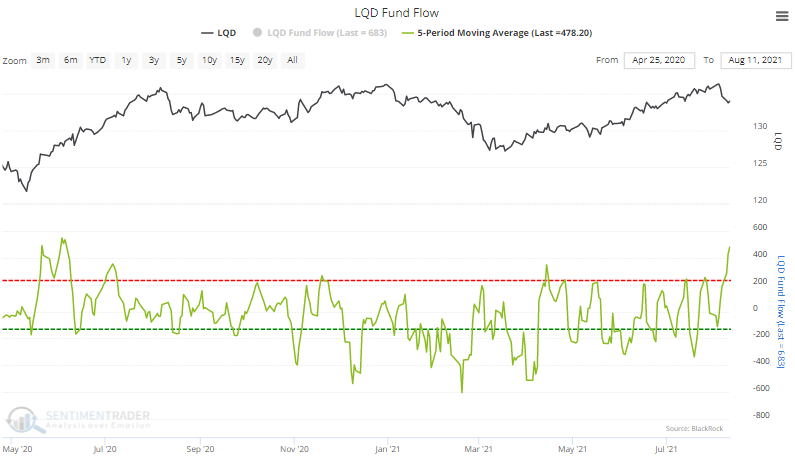
Investment worthy. Traders have been flooding into the LQD investment-grade corporate bond fund in recent days. It took in an average of more than $400 million per day over the past week, its 3rd-highest 5-day average inflow since inception.

lqd fund flow

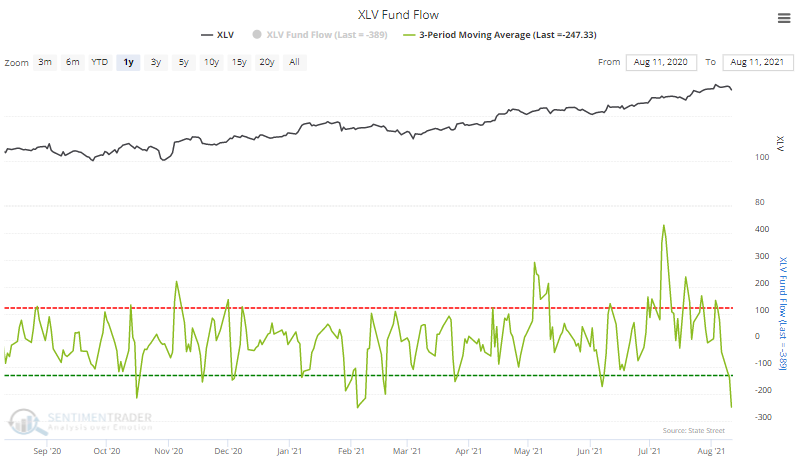
At the other end of the spectrum...Traders have been leaving the XLV Health Care fund in recent days. It lost an average of more than $250 million per day, its largest outflow of the past year.

xlv health care fund flow

DATA &
TECHnologies
IndicatorEdge
‍
BackTestEdge
‍
Other Tools
‍
DataEdge API
RESEARCH
reports
Research Solution
‍
Reports Library
‍
actionable
Strategies
Trading Strategies
‍
Smart Stock Scanner
‍
FREE
RESOUrCES
Simple Backtest
Calculator
Simple Seasonality
Calculator
The Kelly Criterion
Calculator
Sentiment Geo Map
‍
Public Research Reports
‍
Free Webinar
COMPANY
‍
About
‍
Meet our Team
‍
In the News
‍
Testimonials
‍
Client Success Stories
Pricing
Bundle pricing
‍
Announcements
‍
FAQ
© 2024 Sundial Capital Research Inc. All rights reserved.
Setsail Marketing
TermsPrivacyAffiliate Program
Risk Disclosure: Futures and forex trading contains substantial risk and is not for every investor. An investor could potentially lose all or more than the initial investment. Risk capital is money that can be lost without jeopardizing ones’ financial security or life style. Only risk capital should be used for trading and only those with sufficient risk capital should consider trading. Past performance is not necessarily indicative of future results.

Hypothetical Performance Disclosure: Hypothetical performance results have many inherent limitations, some of which are described below. No representation is being made that any account will or is likely to achieve profits or losses similar to those shown; in fact, there are frequently sharp differences between hypothetical performance results and the actual results subsequently achieved by any particular trading program. One of the limitations of hypothetical performance results is that they are generally prepared with the benefit of hindsight. In addition, hypothetical trading does not involve financial risk, and no hypothetical trading record can completely account for the impact of financial risk of actual trading. for example, the ability to withstand losses or to adhere to a particular trading program in spite of trading losses are material points which can also adversely affect actual trading results. There are numerous other factors related to the markets in general or to the implementation of any specific trading program which cannot be fully accounted for in the preparation of hypothetical performance results and all which can adversely affect trading results.

Testimonial Disclosure: Testimonials appearing on this website may not be representative of other clients or customers and is not a guarantee of future performance or success.