
A market breadth signal with a perfect record just triggered

Key points:
- The NYSE McClellan Summation Index cycled from below 100 to above 1000
- Similar improvements in market breadth resulted in a 96% win rate over the following year
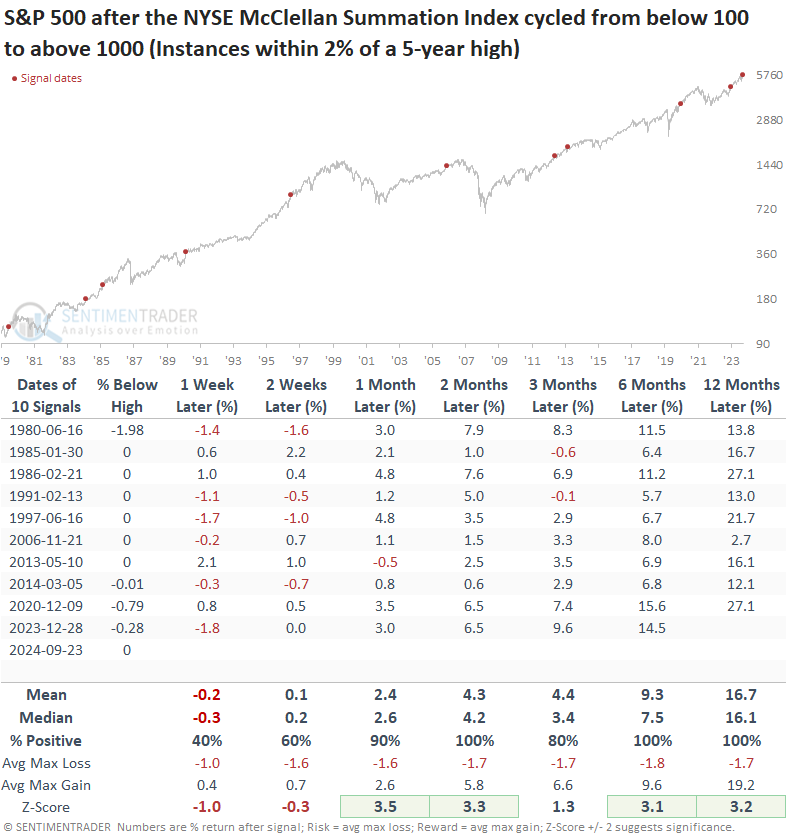
- Signals within 2% of a high have never experienced a loss over the next two, six, and twelve months
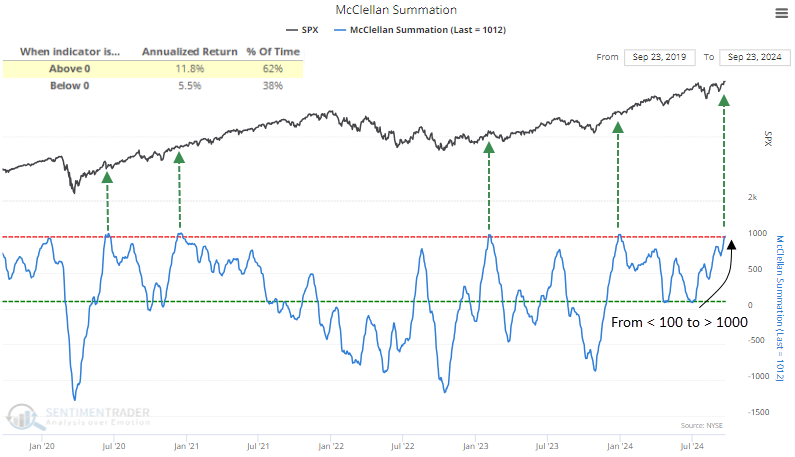
The NYSE McClellan Summation Index shifts to a good overbought condition
The McClellan Summation Index, derived from the McClellan Oscillator, is a widely followed market breadth indicator that analyzes advancing and declining issues to provide insight into a market trend's underlying strength or weakness.
When the Summation Index resides above zero, it suggests a positive breadth trend, and the S&P 500 produces an annualized return of 11.8%. Conversely, when the index falls below zero, it denotes weak breadth, with the S&P 500 returning just 5.5% annually.
An even more compelling signal is observed when the Summation Index transitions from below 100 to above 1000, a milestone it reached for the first time since December 2023. Following that signal, the S&P 500 gained 14% over six months.
Similar shifts in market breadth preceded outstanding returns
Whenever the NYSE McClellan Summation Index shifted from below 100 to above 1000, the S&P 500 exhibited exceptional returns and consistency across all time frames, but especially a year later, when it rose 96% of the time. Furthermore, returns demonstrated significance compared to random returns one to twelve months later.
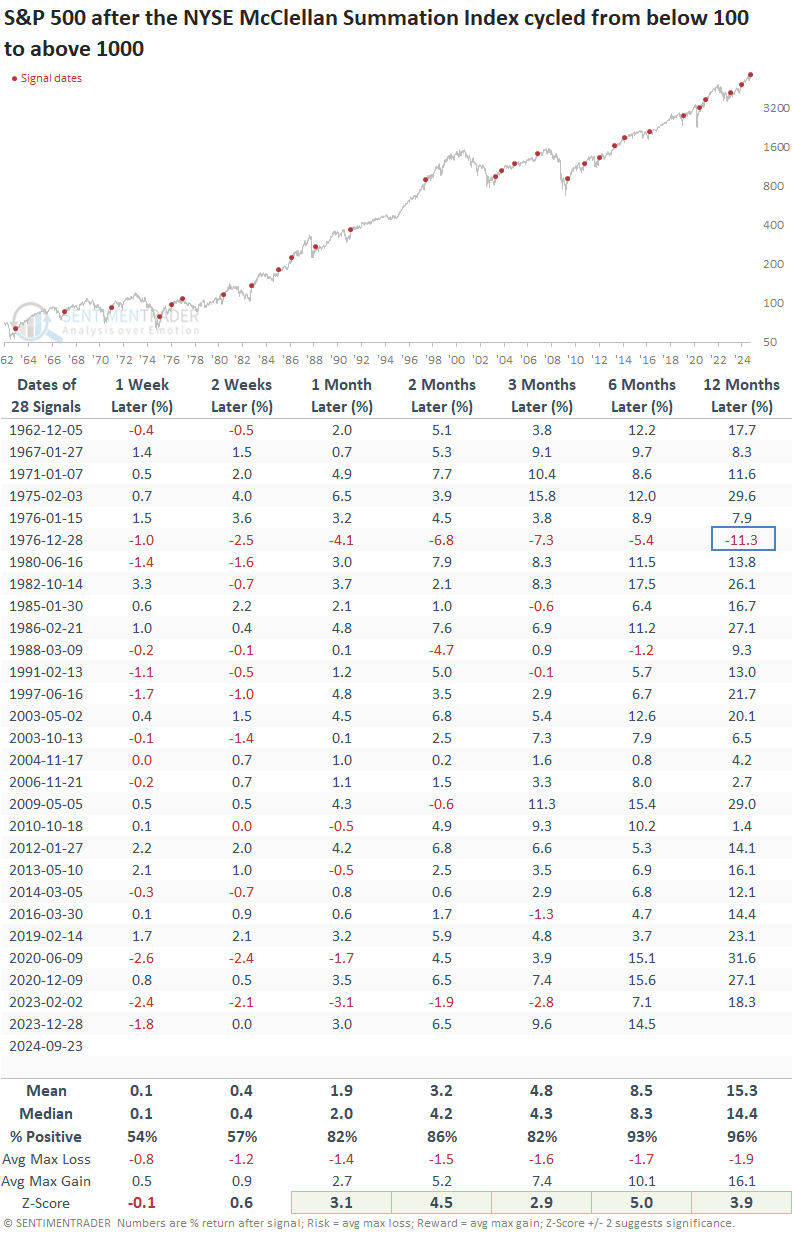
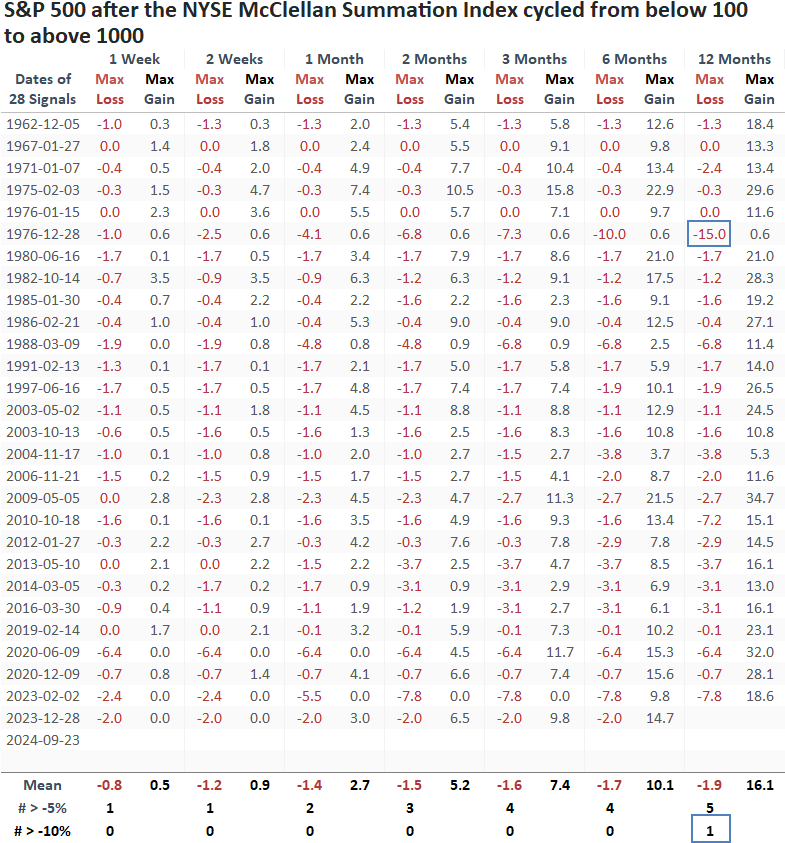
Over the following year, the S&P 500 recorded just one maximum loss greater than -10 %, an event not witnessed since 1976.
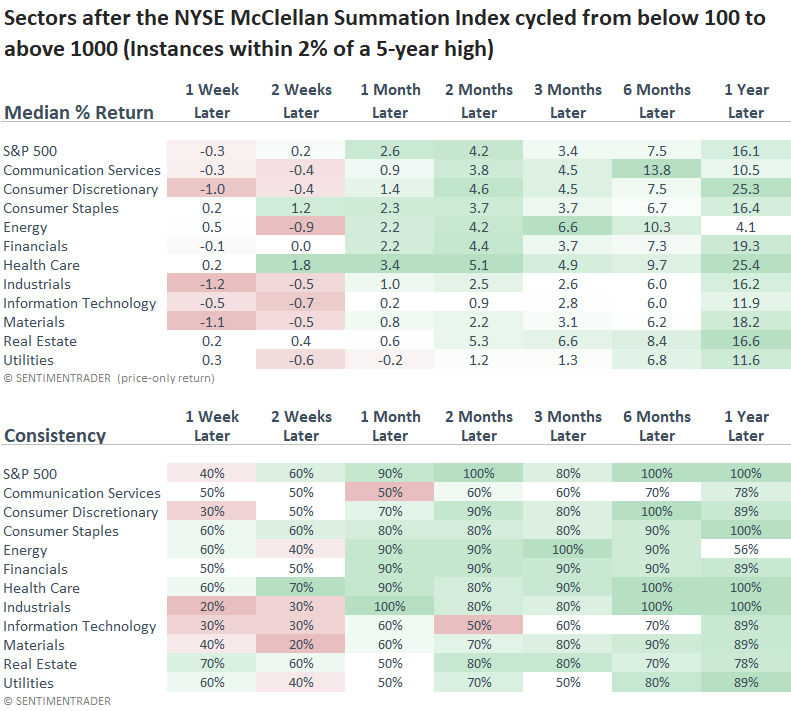
Suppose I isolate precedents that occurred with 2% of a 5-year high in the S&P 500 to assess a context similar to now. In that case, the world's most benchmarked index rose 100% of the time over the subsequent two, six, and twelve months.
Applying the signals to sectors suggests most could experience some turbulence over the next few weeks. From a medium to long-term perspective, seven groups outpaced the S&P 500 over the following year, providing plenty of opportunity.
What the research tells us...
Typically, when stock indexes consolidate, as most have since July, market breadth weakens as lagging moving averages or pivot points catch up to price. However, that's not the case now, as breadth has remained firm and even improved depending on the index or exchange. One such improvement is the McClellan Summation Index for the NYSE, as it cycled from below 100 to above 1000 over the last few months, triggering a bullish breadth signal. Similar alerts produced a 96% win rate for the S&P 500 over the subsequent year. When precedents occurred within 2% of a 5-year high, the world's most benchmarked index displayed an even more bullish outlook, rising 100% of the time over the following two, six, and twelve months.