
A historic plunge in the stock/bond ratio

Key points:
- Stocks plunged, and bonds rallied, sending the stock/bond ratio to one of the lowest points in history
- Comparable stock/bond ratio swoons produced excellent short and long-term outcomes for the S&P 500
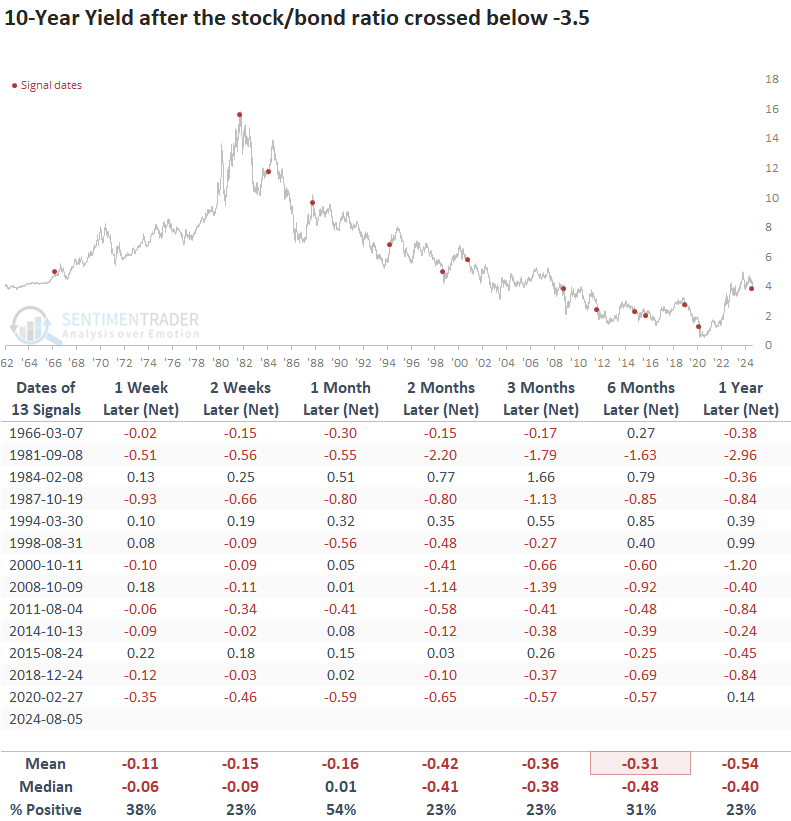
- Following similar scenarios, the 10-year yield displayed a consistent downward bias over the following year
One gauge of sentiment shows extreme fear
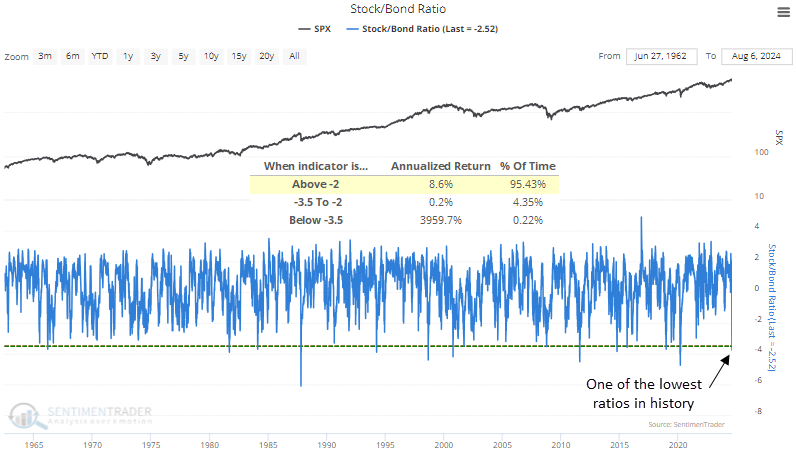
The recent yen-carry trade unwind, which some describe as a global margin call, drove the stock/bond ratio, which compares the S&P 500 against a long-dated Treasury bond, to one of its lowest points in history. Though this ratio evaluates whether stocks are undervalued or overvalued relative to bonds, it also serves as a gauge of market sentiment. Presently, the extremely low levels indicate a high degree of investor fear.
On Monday, the ratio fell to -3.75, a condition seen in less than 1% of instances since 1962. As illustrated in the chart below, periods with readings below -3.5 have yielded exceptionally high annualized returns.
While significant annualized returns based on an extreme threshold seen only a handful of times in history provide us with a general sense that a market should revert one way or the other, from a trading perspective, it's best to use a systematic approach so one can assess risk relative to reward based on time intervals.
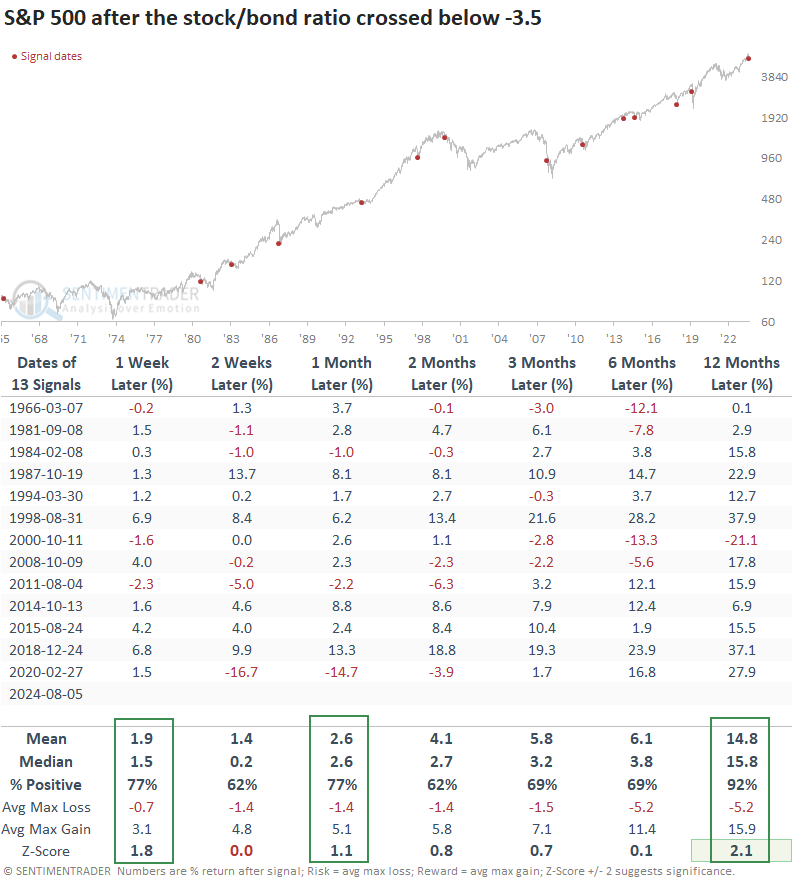
With that in mind, let's assess the outlook for the S&P 500 after the stock/bond ratio crosses below -3.5 with a reset above 0.0 to screen out repeats.
Comparable stock/bond ratio washouts preceded positive returns
Whenever the stock/bond ratio plunged beneath -3.5, panic selling in stocks in favor of buying bonds reached a climactic point. Not only did the S&P 500 bounce back in the short term, displaying a gain at some point over the next month in 12 out of 13 instances, but it also rallied 92% of the time a year later and displayed significance relative to random returns.
While the October 2000 precedent is undoubtedly a concern, given some similarities to that period, the S&P 500 rallied 5% over two months, providing traders plenty of time to manage risk.
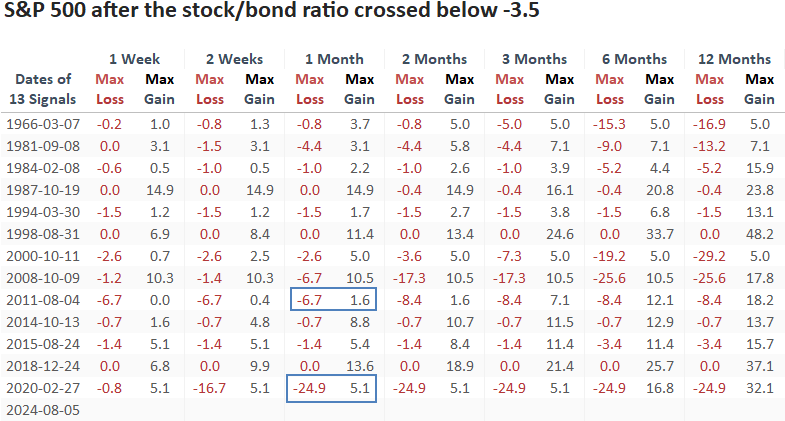
Over the following month, the maximum gain surpassed the maximum loss in 11 out of 13 instances. Additionally, during this same period, only three precedents recorded a maximum loss of more than -5%, a remarkable feat considering the challenging environment surrounding these events.
While the 1966, 1981, and 2000 precedents are undoubtedly concerning, given that these instances occurred near the outset of bear markets, traders had ample time to capture a profit before the S&P 500 rolled over.
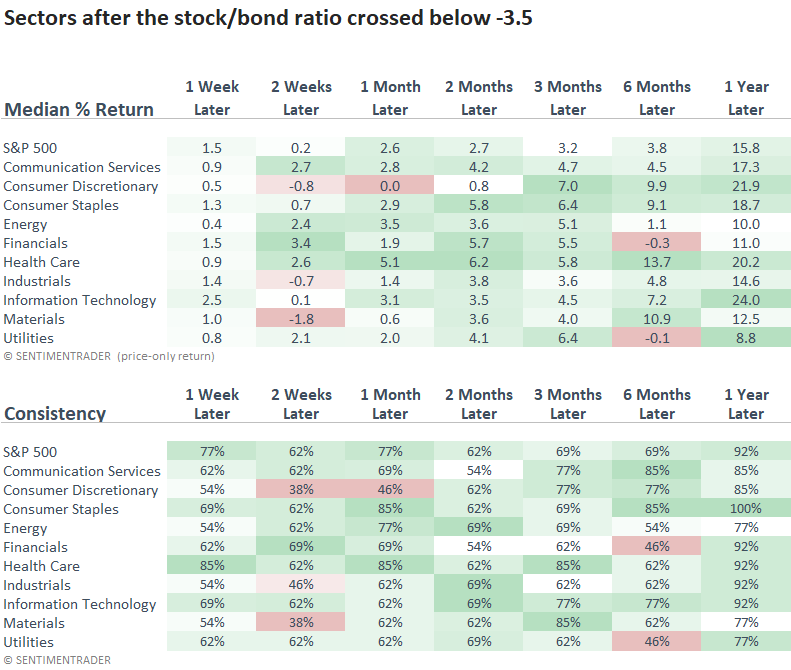
Technology outpaced the S&P 500 and all other sectors over the following year. Interestingly, defensive growth groups like Consumer Staples and Health Care also exceeded the performance of the world's most benchmarked index.
What about bonds?
Considering that most signals occurred in a secular downtrend, the 10-year yield's decline over long-term horizons is not unusual. However, I am surprised it did not revert higher in the near term.
The outcome derived from the stock/bond ratio signal lends additional support to the study I shared last week, suggesting a likely decline in yields.
What the research tells us...
The stock/bond ratio plunged to a historically low level as traders abandoned stocks in favor of bonds in a deleveraging unwind of the yen-carry trade. Following similar periods of panic-driven fear, S&P 500 returns and consistency were excellent, especially over the following month. A year later, the world's most benchmarked index rose 92% of the time. However, it was not without risk in a few cases. The bullish backdrop was aided by a favorable yield environment, with the 10-year yield falling 77% of the time over the subsequent year.