Data &
Technology
Research
Reports
Report Solutions
Reports Library
Actionable
Strategies
Free
Resources
Simple Backtest Calculator
Simple Seasonality Calculator
The Kelly Criterion Calculator
Sentiment Geo Map
Public Research Reports
Free Webinar
Pricing
Company
About
Meet Our Team
In the News
Testimonials
Client Success Stories
Contact
Log inLoginSign up
< BACK TO ALL REPORTS

A historic 3-day buying thrust is changing sentiment

Jason Goepfert
2020-03-27
The past 3 sessions have seen a record skew in positive stocks and volume. Our CNN Fear & Greed proxy model is curling higher after extreme pessimism.

A historic 3-day thrust

So far in this recovery, the S&P has clawed back more than a third of its decline, which surpasses the other post-crash scenarios. And the buying power has been historic - potentially the best 3-day stretch since at least 1940. Each of the past three sessions has seen more than 80% of issues and volume skewed toward rising stocks. 

The only days that approached this were in 1984 and 2009, preceding the kick-off of massive bull markets (though it was early in 2009). If we relax the parameters to look for any 3-day stretch when the minimum Up Issues and Up Volume were at least 75%, then we get a few more signals. 

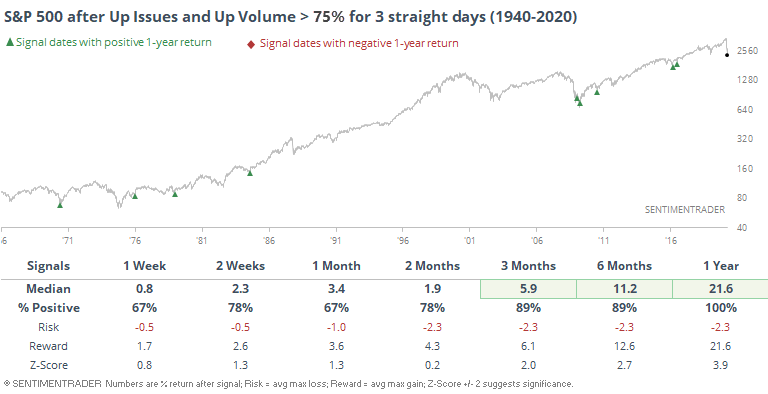
Buyers are doing what they need to do to change sentiment and increase the likelihood the worst has already been seen.


Sentiment is curling

Sentiment was extremely pessimistic over the past few weeks regardless of how you look at it. You would know this even without looking at any indicator: a 35% crash in just a few weeks is enough to make anyone panic.

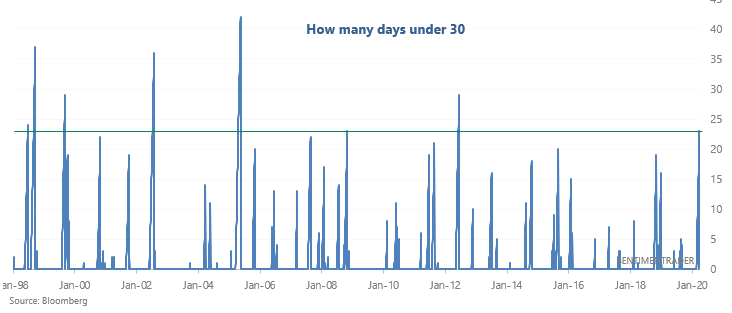
And now that the stock market is rebounding, sentiment is starting to back off from extreme pessimism levels. Our proxy model of the CNN Fear & Greed Index is moving higher after spending a long time below 30.

The S&P's forward returns over the next few weeks and months when this happened in the past were mixed. Sometimes the post-crash rally still had more room to run, but sometimes the rally was mostly over and the stock market continued to fall: 

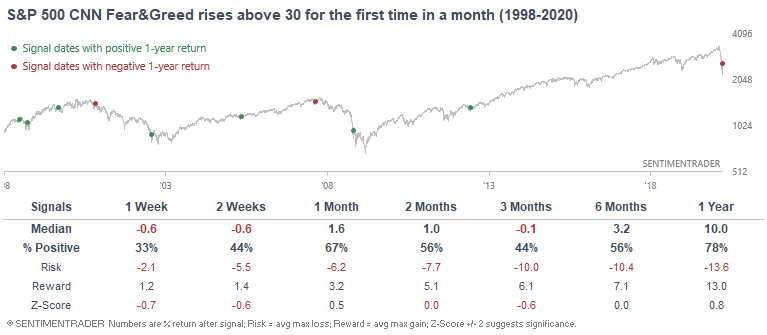
Most of the negative longer-term returns came when stocks were relatively close to their highs, unlike now.

This is an abridged version of our recent reports and notes. For immediate access with no obligation, sign up for a 30-day free trial now.

We also looked at:

  • The McClellan Oscillator and Summation Index are turning up
  • The Dow and S&P are surpassing other post-crash knee-jerk rebounds
  • Breadth over the past few sessions has been truly historic
  • Looking at other post-crash rebound patterns
  • Most stocks are now in short-term uptrends - what that means
  • An update on stocks throwing off MACD buy signals
DATA &
TECHnologies
IndicatorEdge
‍
BackTestEdge
‍
Other Tools
‍
DataEdge API
RESEARCH
reports
Research Solution
‍
Reports Library
‍
actionable
Strategies
Trading Strategies
‍
Smart Stock Scanner
‍
FREE
RESOUrCES
Simple Backtest
Calculator
Simple Seasonality
Calculator
The Kelly Criterion
Calculator
Sentiment Geo Map
‍
Public Research Reports
‍
Free Webinar
COMPANY
‍
About
‍
Meet our Team
‍
In the News
‍
Testimonials
‍
Client Success Stories
Pricing
Bundle pricing
‍
Announcements
‍
FAQ
© 2024 Sundial Capital Research Inc. All rights reserved.
Setsail Marketing
TermsPrivacyAffiliate Program
Risk Disclosure: Futures and forex trading contains substantial risk and is not for every investor. An investor could potentially lose all or more than the initial investment. Risk capital is money that can be lost without jeopardizing ones’ financial security or life style. Only risk capital should be used for trading and only those with sufficient risk capital should consider trading. Past performance is not necessarily indicative of future results.

Hypothetical Performance Disclosure: Hypothetical performance results have many inherent limitations, some of which are described below. No representation is being made that any account will or is likely to achieve profits or losses similar to those shown; in fact, there are frequently sharp differences between hypothetical performance results and the actual results subsequently achieved by any particular trading program. One of the limitations of hypothetical performance results is that they are generally prepared with the benefit of hindsight. In addition, hypothetical trading does not involve financial risk, and no hypothetical trading record can completely account for the impact of financial risk of actual trading. for example, the ability to withstand losses or to adhere to a particular trading program in spite of trading losses are material points which can also adversely affect actual trading results. There are numerous other factors related to the markets in general or to the implementation of any specific trading program which cannot be fully accounted for in the preparation of hypothetical performance results and all which can adversely affect trading results.

Testimonial Disclosure: Testimonials appearing on this website may not be representative of other clients or customers and is not a guarantee of future performance or success.