
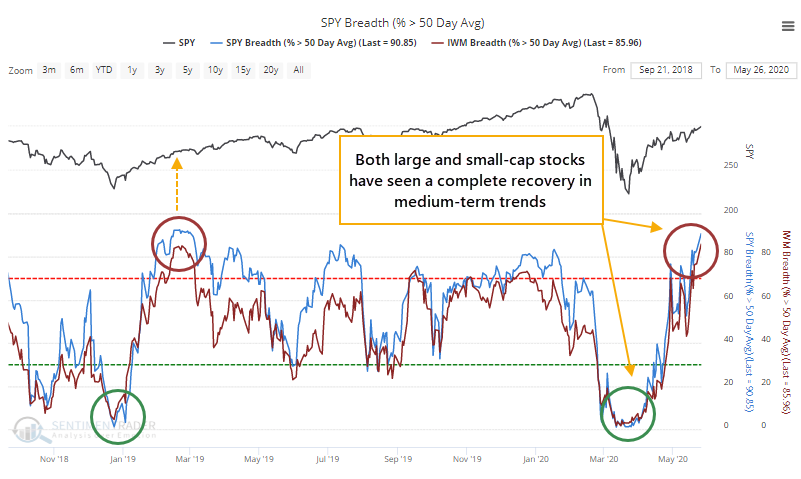
A complete recovery in medium-term trends

Starting on March 26, we started spending a lot of time on two major factors that strongly suggested we were not seeing "just another bear market rally." Namely, there was a historic level of widespread buying pressure and prices had retraced more of the decline than bear market rallies typically do.
By mid-April, we went over another type of breadth thrust that nearly triggered, but didn't quite. Based on traditional ways of looking at things, stocks still hadn't really achieved terminal velocity, the kind of slam-dunk, no-questions-asked sustained buying pressure that has signaled the all-clear in past rallies. Again, that's only looking at things in a traditional way.
That argument is getting more difficult to make. With Tuesday's jump, an overwhelming number of stocks have at least moved into medium-term uptrends. As Troy shows in a premium note, the percentage of stocks above their 50-day moving averages has spiked across indexes, both domestic and overseas. As the rally gets closer and closer to lasting for 50 days, it's natural to see more and more stocks close above their 50-day averages.
Looking at the most benchmarked index in the world, fewer than 10% of stocks were trading above their averages 35 days ago and now more than 90% of them are. When it cycles from one extreme to the other like this, it has preceded further medium-term gains every time and the risk/reward ratio was ridiculously positive.
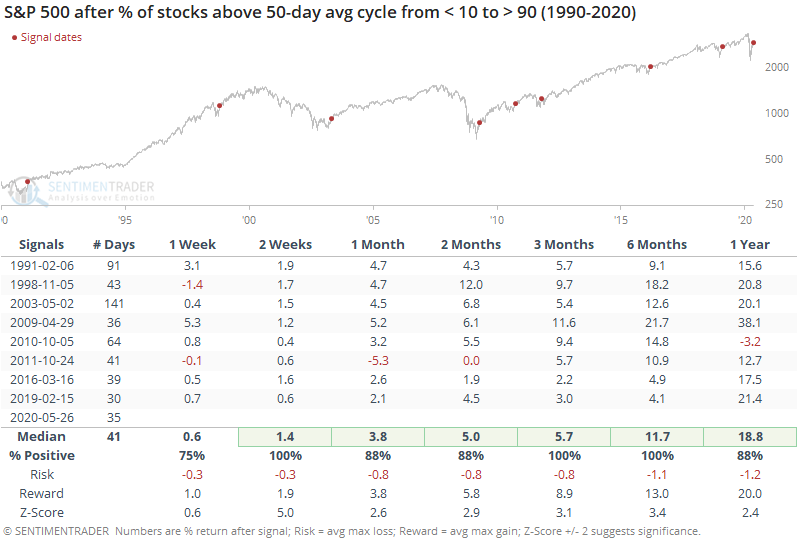
This is the 2nd-fastest that so many stocks have cycled from one extreme to the other, exceeded only by February 2019. It took slightly longer in April 2009 and March 2016. All three of those were tremendous kick-off rallies.
There is some concern that so many stocks are above their 50-day averages but fewer than 40% are yet above their 200-days. In the above table, April 2009 saw only 31% of stocks above their 200-day averages at the time, and October 2011 saw 44%. All the others had more than 50% of members above their long-term averages, so perhaps it's a modest concern but the evidence is limited.
It's not just large-caps, which get most of the attention. There are more stocks in the Russell 2000 than the S&P 500 (duh) so it's harder for that index to see such extremes, even though they tend to be more volatile. Still, within that index, fewer than 15% of stocks were above their 50-day averages, and now more than 85% are.
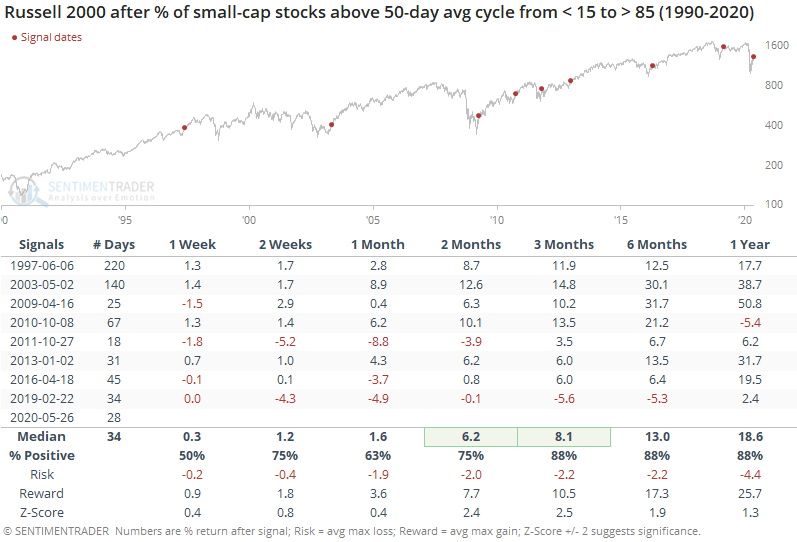
As Troy noted in his post, very high readings in this measure have led to some rocky returns for the Russell, especially in recent years. And its record after cycling from one extreme to the other wasn't quite as good as the S&P's.
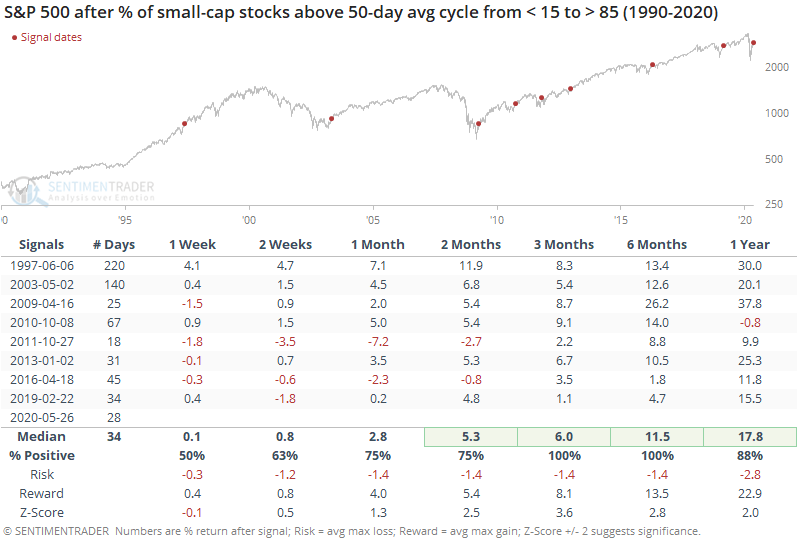
If we look at how the S&P did after those extremes in small-cap stocks, again it was impressive. The dates were slightly different but mostly the same general time frames as the first table.
Even among indexes across the world, we're seeing longer-term recoveries. The 20-day average of countries with a rising 200-day moving average has just started to curl up from zero. Going back to 1987, this has only happened 3 other times, all lasting recoveries.
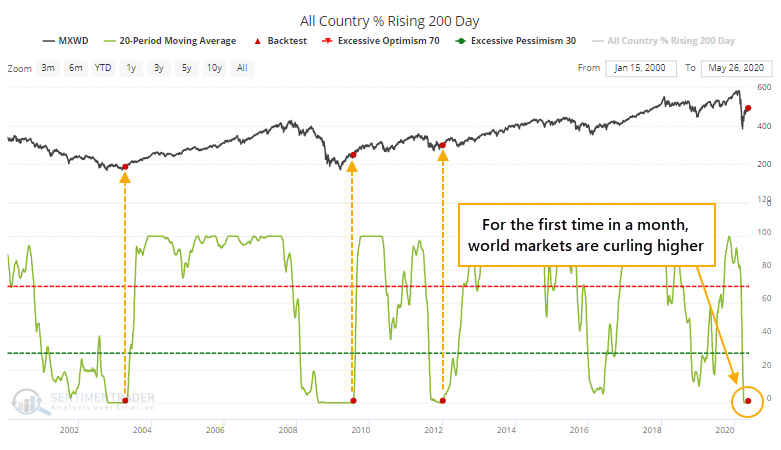
It's extremely hard to ignore the positive implications of this, even though we haven't seen much of the digestion that normally comes after an initial recovery.
So, how do we reconcile that against some of the negatives that have popped up, especially the surge in speculative activity? Sometimes, we simply can't. There are a couple of times in most years when everything we look at tilts a certain direction, which makes having high confidence in an outlook "easy." This is not one of those times. We'd still give more weight to the negatives over the short- to medium-term but the positives medium- to long-term.