
A closer look at what corporate insiders are doing

Key Points
- Corporate insiders (executives and board managers) are often privy to knowledge regarding the prospects for their own company
- When they act in a concerted manner, it typically conveys important information
- Insiders are required to report when they buy or sell shares of their own company in the open market
- We utilize a Bloomberg database that tracks only open-market insider buying and selling
- These results are updated once a week on our website, typically after Monday's close
Measuring insider transactions
There are different ways to measure insider activity.
- Buys - looks only at open-market buy transactions by insiders
- Sells - looks only at open-market sell transactions by insiders
- Buy/Sell Ratio - looks at the ratio of buying and selling
- Insider Velocity - looks at the 4-week rate-of-change in insider buying and subtracts the 4-week rate-of-change in insider selling for a given stock or all stocks in a given index
The key points
Here are the key overarching points to know regarding insider buying and selling:
- Heavy insider buying is considered a stronger signal than heavy insider selling because insiders typically only buy if they have confidence that their company (and by extension, the stock) will perform well over the next 12-24 months
- However, when insider selling for a given index or stock dries up to a significantly low level, that also tends to portend positive results in the not too distant future.
First the caveats
The Bloomberg database is the cleanest database we could find. The one drawback is that this database goes back only as far as 2010.
During the life of this database, there have been some clear underlying themes that may not repeat precisely in the years ahead (tech primarily bullish, energy mostly bearish until the last year). So, the magnitude and persistency may not be the same in the years ahead. Still, the history of insider transactions is pretty consistent - i.e., heavy insider buying typically precedes higher stock prices and vice versa. That said:
- Insiders are not infallible
- Insiders are typically not short-term traders and often are early with their transactions
- It can sometimes take 12-24 months before the expected price action comes to fruition after a concentrated bout of insider buying or selling
With those caveats in mind, let's look at relevant recent trends.
Corporate Insider Buy/Sell Ratio
This indicator shows a ratio of the total number of corporate insiders of S&P 500 companies that have bought shares on the open market during the past six months versus those that have sold shares.
The chart below displays all dates when the Corporate Insider Buy/Sell Ratio - SPX crossed above 0.089.
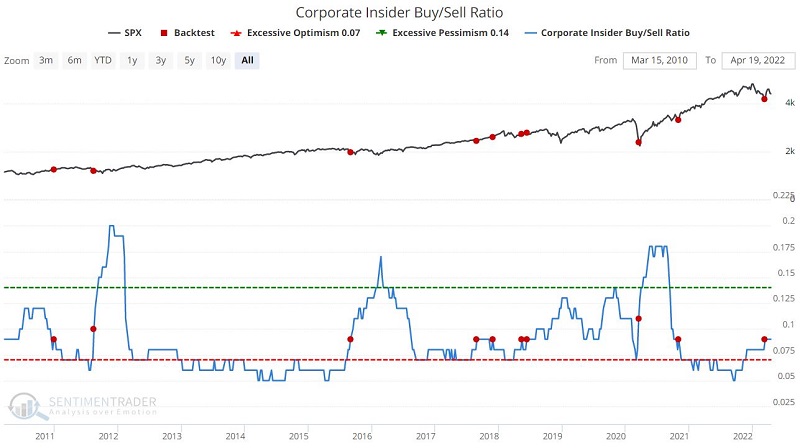
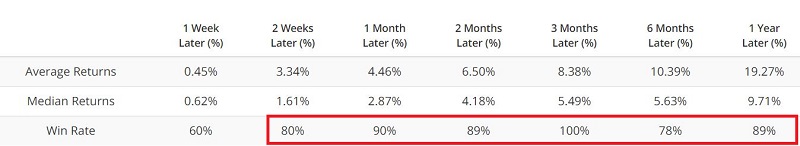
The most recent favorable signal occurred on 3/14/2022.
Corporate Insider Buy/Sell Ratio - NDX
This indicator shows a ratio of the total number of corporate insiders of Nasdaq 100 companies that have bought shares on the open market during the past six months versus those that have sold shares.
The chart below displays all dates when the Corporate Insider Buy/Sell Ratio - NDX crossed above 0.079.
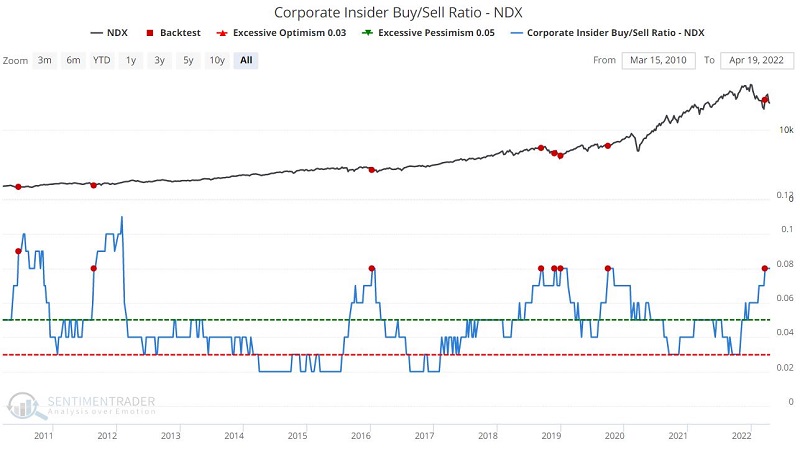
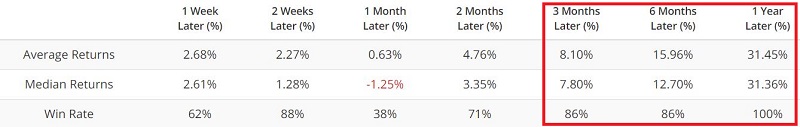
The most recent favorable signal occurred on 3/21/2022.
Now let's turn our attention to areas where insider selling has dried up recently.
Corporate Insider Sells - NDX
This indicator shows the total number of corporate insiders of Nasdaq 100 companies that have sold shares on the open market during the past six months. The chart below displays all dates when the Corporate Insider Sells - NDX was below 440.
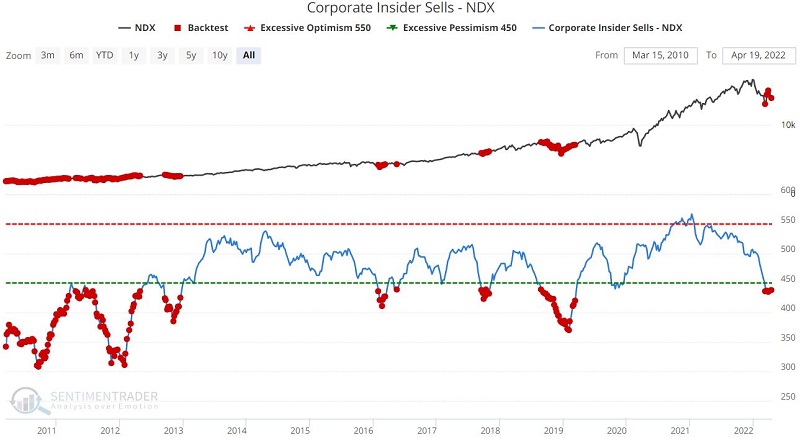
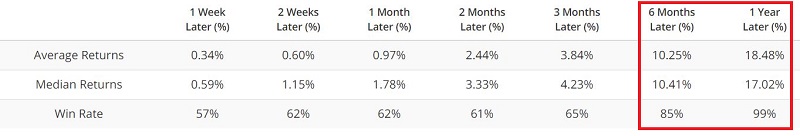
This indicator has been below 440 during four of the last six weeks starting on 3/14/2022.
Corporate Insider Sells - XLK
This indicator shows the total number of corporate insiders of companies covered by the XLK (Technology Select Sector SPDR Fund) ETF that have sold shares on the open market during the past six months.
The chart below displays all dates when the Corporate Insider Sells - XLK was below 380.
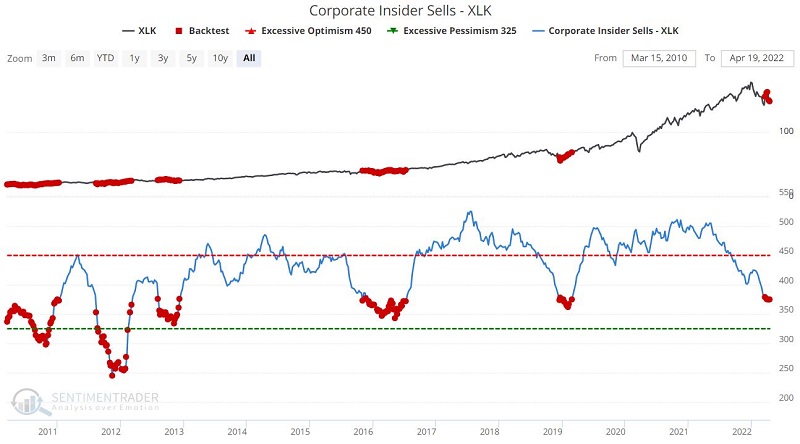
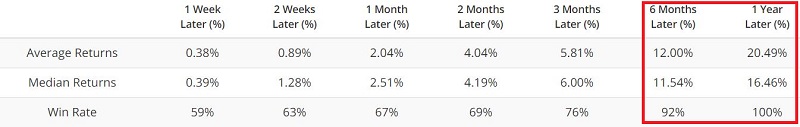
This indicator has been below 380 during each week starting on 3/21/2022.
Corporate Insider Sells - XLV
This indicator shows the total number of corporate insiders of companies covered by the XLV (Health Care Select Sector SPDR Fund) ETF that have sold shares on the open market during the past six months.
The chart below displays all dates when the Corporate Insider Sells - XLV was below 280.
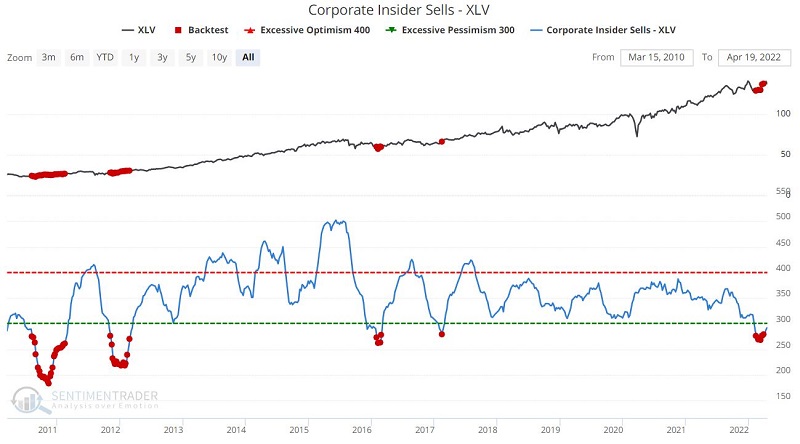
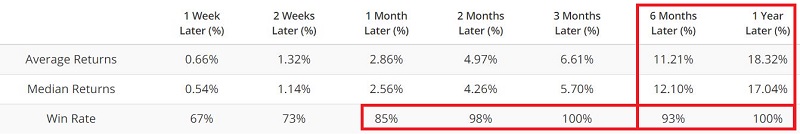
This indicator was below 280 for five straight weeks from 2/14/2022 through 3/28/2022.
Corporate Insider Sells - XLY
This indicator shows the total number of corporate insiders of companies covered by the XLY (Consumer Discretionary Select Sector SPDR Fund) ETF that have sold shares on the open market during the past six months.
The chart below displays all dates when the Corporate Insider Sells - XLY was below 190.
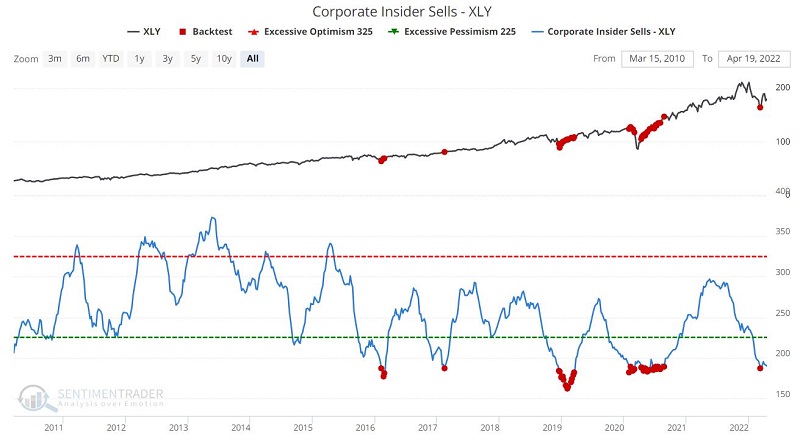
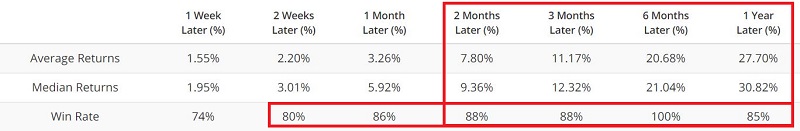
This indicator was below 190 during the week of 3/14/2022.
Corporate Insider Sells - XLE
This shows the total number of corporate insiders of companies covered by the XLE (Energy Select Sector SPDR Fund) ETF that have sold shares on the open market during the past six months.
The chart below displays all dates when the Corporate Insider Sells - XLE was above 85.
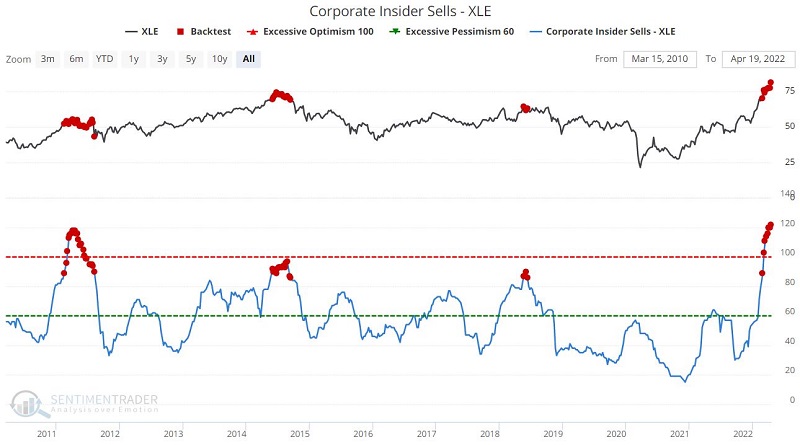
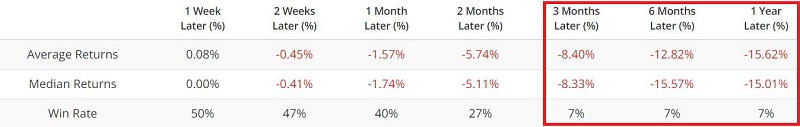
This indicator has been above 85 every week since 2/28/2022.
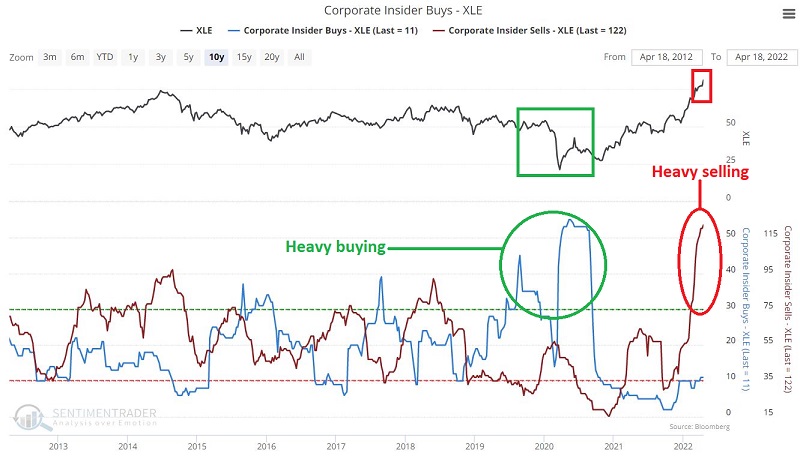
Unlike the other tests above, the energy sector has seen a great deal of concentrated insider selling, as corporate executives have used the substantial advance in energy shares to unload stock. Does this mean that energy stocks are doomed to decline in the next 12-24 months? Not necessarily. Nevertheless, the surge in selling shown in the chart above and the absence of buying displayed below suggest a potential slowing of the torrid pace of advance in energy shares.
The chart below overlays XLE insider buying (blue line) and XLE insider selling (brown line). Note that energy insiders loaded up on shares in 2019 and especially in 2020 and are using the recent advance to unload in a fashion not seen in the previous 12 years.
What the research tells us…
The information above suggests better days ahead for the technology, health care, and consumer discretionary sectors and the broader S&P 500 Index and Nasdaq 100 Index. It also casts a shadow on the energy sector.
The information above is likely discomforting to a lot of investors. The conventional wisdom is that tech has had its day in the sun, reached an overbought level, and now the bubble has popped, and tech is destined to languish at best or plunge at worst. But that outlook does not comport with technology corporate insiders buying heavily (and selling very little). Much of the same is true for the other sectors and indexes. Rising inflation, higher interest rates, high valuations, and weak price action by the major indexes make it hardly "feel" like a time to be loading up on shares.
And maybe it is not. Remember, insiders are not infallible. Still, the recent action of insiders might give an investor pause before shouting, "sell everything!"