
Winds of change

Key Points
- No asset class ever enjoys a permanent advantage over any other asset class
- Turning points in asset class relationships are nearly impossible to identify until after the fact
- Fortunately, once a new trend develops, it typically takes a long time to play out
- This tendency creates opportunities for investors who are willing to act decisively when trends change
Assessing the big picture
The purpose of this piece is to highlight a variety of asset class relationship trends that may be in the process of changing. Each screenshot below is a relative strength chart depicting the movement in each relationship over the last five years. A rising trend means that the first asset listed is outperforming and vice versa.
Commodities versus stocks
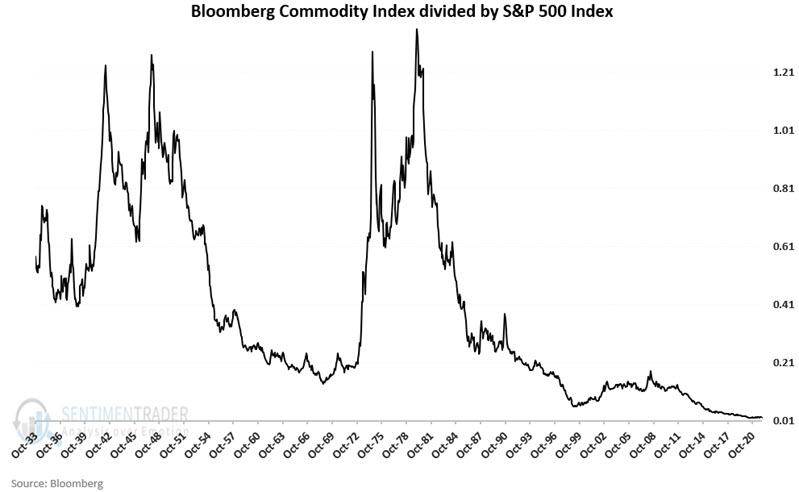
Commodities have been the "dogs" of the investment markets since topping out way back in July 2008. But as mentioned at the outset, nothing lasts forever in the financial markets. The chart below displays the Bloomberg Commodity Index divided by the S&P 500 Index since 1933(??). There are two key things to note:
- This relationship engages in significant trends in both directions over time
- The relationship is still near its all-time low despite the significant rally in commodities over the last year
- Nothing is ever guaranteed, but the results in the chart above suggest that commodities are due to outperform stocks in the years ahead significantly
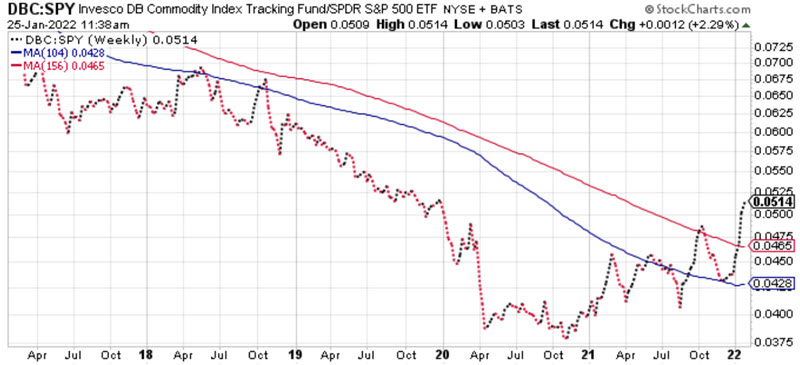
Each 5-year relative strength chart below is courtesy of StockCharts and includes a 104-week and 156-week (i.e., 2-year and 3-year) moving average.
The chart below displays DBC (Invesco DB Commodity Tracking Fund ETF) versus SPY (SPDR S&P 500 ETF). We see the first signs of a trend reversal at the far right starting in October 2021. If what the chart below shows is, in fact, the beginning of a new trend favoring commodities, the chart above suggests that trend could be substantial and could last for several years.
Value versus Growth
The chart below displays the performance of an index of value stocks relative to an index of growth stocks since 1926.
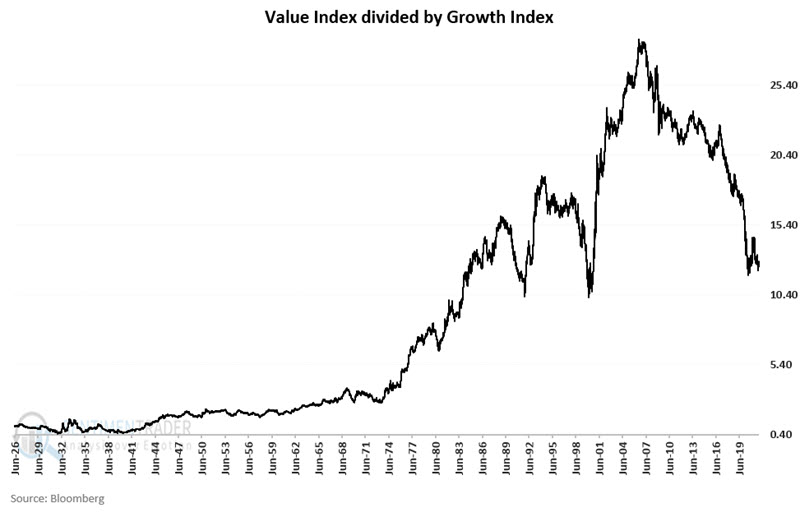
There are several things to note in the chart above:
It is technically accurate to assert that value has significantly outperformed growth since 1926
However:
- There are large swings back and forth, and either index can outperform for years at a time
- Growth has vastly outperformed since 2006
- The history displayed suggests that the current trend favoring growth will not last forever
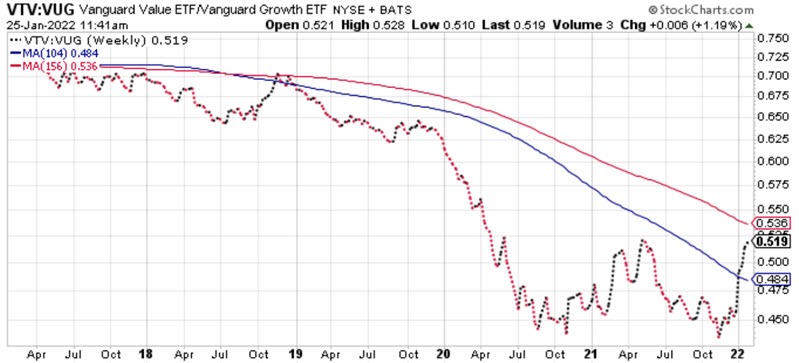
The chart below displays VTV (Vanguard Value ETF) versus VUG (Vanguard Growth ETF). After significantly underperforming for all of 2019 and 2020, value finally shows signs of staging a reversal.
If history is a guide, value stocks will outperform growth stocks when the next bear market unfolds.
See this article for information on an objective approach to tracking growth versus value.
Low Volatility versus Momentum stocks
The chart below displays SPLV (Invesco S&P 500 Low Volatility ETF) versus MTUM (iShares MSCI USA Momentum Factor ETF). Typically, momentum stocks outperform during bullish market conditions, and low volatility stocks outperform during bearish market conditions. Because of this tendency, the recent reversal is concerning, however, it remains to be seen how this ultimately plays out. The chart shows two times when this ratio tried previously to break out and failed.

Energy versus the Total Stock Market
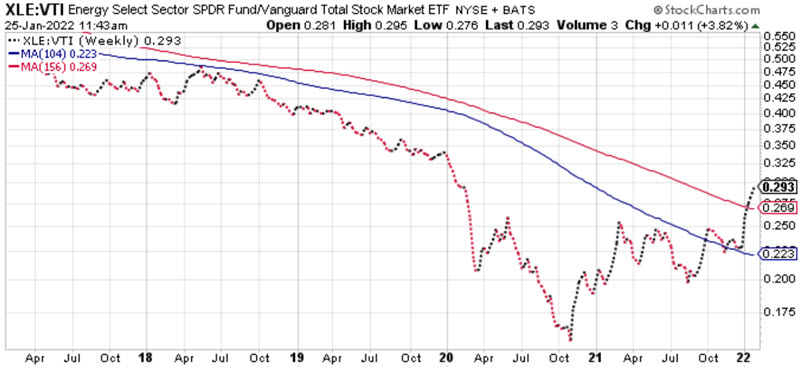
The chart below displays XLE (Energy Select Sector SPDR ETF) versus VTI. Energy became the most hated sector of all time before bouncing in late 2020. Historically, hated sectors tend to enjoy long bull runs once the tide turns. While nothing will ever move in a straight line, we should not be surprised to see the traditional energy sector outperform in the years ahead.
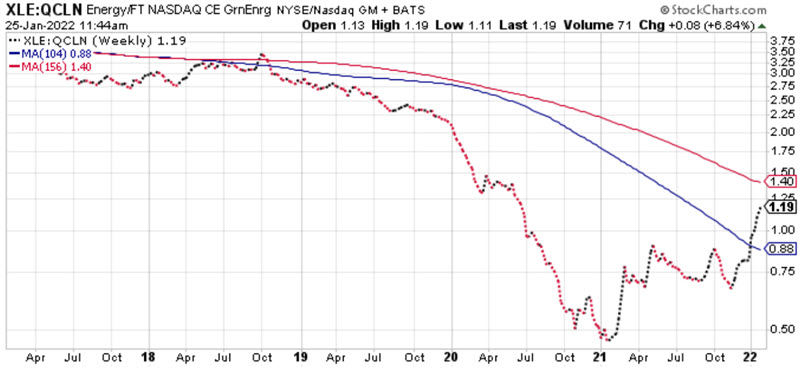
Speaking of energy, it is interesting to note that the traditional energy sector appears to be turning the tide against the "green energy" sector after significantly underperforming from late 2018 through early 2021. The chart below displays XLE versus QCLN (First Trust NASDAQ Clean Edge Green Energy Index Fund) as proxies for the traditional energy and green energy sectors.
Short-term bonds versus long-term bonds
Interest rates rising from a low level is the worst-case scenario for bond investors. But the reality is that in an actual rising rate environment, short-term bonds offer the advantage of reinvesting more often at ever higher rates, unlike long-term bonds that lock in a particular yield for an extended time. This fact is not lost on investors. If rates are perceived to be rising, investors will favor short-term bonds over long-term bonds. This gets reflected in the relationship between short-term and long-term bond vehicles.
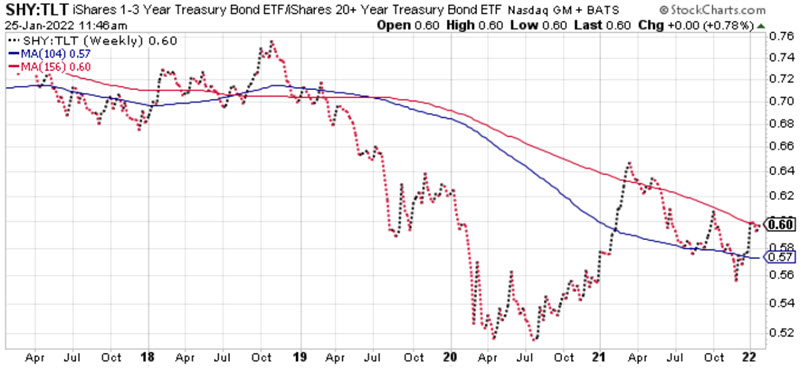
The chart below displays SHY (iShares 1-3 Year Treasury Bond ETF) versus TLT (iShares 20+ Year Treasury Bond ETF). This relationship has favored TLT for many years but has attempted to reverse since mid-2020. Suppose interest rates embark on a rising trend in the years ahead. In that case, investors should look for short-term bonds to significantly outperform long-term bonds (although their absolute returns may be less than stellar until interest rates reach a meaningful level).
Small-cap value versus large-cap growth
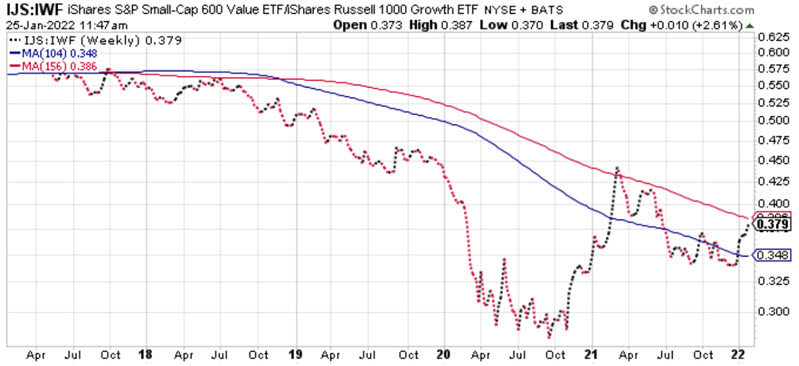
One more "wind of change" that may be blowing involves the small-cap value asset class, particularly relative to large-cap growth - which was "King of the Hill" for several years. The chart below displays IJS (iShares S&P Small-Cap 600 Value ETF) versus IWF (iShares Russell 1000 Growth). It is likely too soon to outright declare a trend reversal in place. But we should not be surprised if a new long-term trend favoring small-cap value unfolds.
What the research tells us...
Buying and holding major stock market index fund or ETFs paid off handsomely from the Covid-panic low in early 2020 through late 2021. But evidence suggests that index investors may "ride a rollercoaster" for some time from here. As a result, investors who want to make money going forward will likely need to focus more closely on identifying which asset classes are performing the best and be more open to making portfolio changes as new trends unfold.