
This Measure Suggests the IPO Bubble Has Popped

Has the IPO bubble popped?
After a multi-month bounce and consolidation phase, the Renaissance IPO Index formed a significant intermediate-term top last week. IPOs represent one of the more speculative areas of the market, especially in the last few decades as the percentage of unprofitable companies coming public has surged.
One has to wonder what, if any, message can we gain from the balloon popping. Are the speculative pockets of the market like IPOs starting to discount peak liquidity as the fiscal and monetary accommodation can't last forever?
When Dean applied a relative strength indicator to the IPO/S&P 500 ratio to assess relative performance, the weakness in IPOs really stands out. The indicator in the chart below counts the number of IPO Index 42-day relative lows versus the S&P 500 index in the last 15 days. A high count reflects severe underperformance.
The count reached 7 late last week.
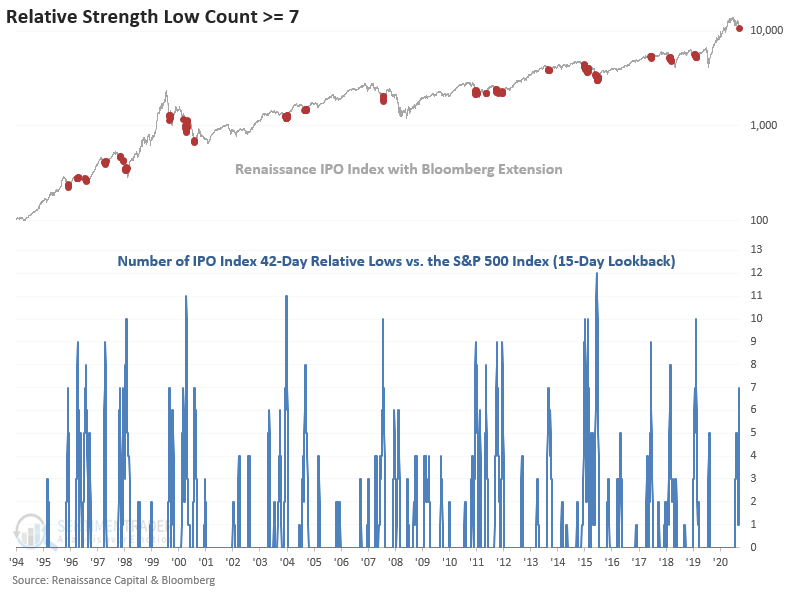
When the relative low count reaches 7 after the IPO Index registered a 252-day high, forward performance in the IPO Index is weak in the 2-4 week timeframe with z-scores that suggest significance.

| Stat Box On Friday, more than 32% of stocks in the S&P 500 hit a 52-week high. According to our Backtest Engine, only 6 days in the past 20 years have seen more new highs, with all of them leading to a decline over the next month. |
What else we're looking at
- Full details on IPO performance after relative weakness signals
- Also how IPOs performance relative to the broader market
- What the Risk Level on gold means for the Japanese yen, and the Nikkei 225
- What happens after a spike in 52-week highs among stocks in the S&P 500