Indicators &
Backtest Tools
Research
Reports
Report Solutions
Reports Library
Strategies
& Scanner
Free
Resources
Simple Backtest Calculator
Simple Seasonality Calculator
The Kelly Criterion Calculator
Sentiment Geo Map
Public Research Reports
Free Webinar
Pricing
Company
About
In the News
Testimonials
Client Success Stories
Contact
Log inLoginSign up
< BACK TO ALL REPORTS

The Sentiment Cycle has moved out of the Discouragement phase

Jason Goepfert
2020-09-30
When we take a more rigorous look at the typical Sentiment Cycle, we can see that stocks never really endured the Discouragement phase, rather investors moved right into Returning Confidence. That has positive implications for the medium-term, but the long-term is questionable.

Where are we in the typical Sentiment Cycle?

It's an important question, and one of the most-asked ones. The biggest problem with answering is that it's entirely subjective. Scroll through a recent poll by respected technician Helene Meisler and the responses are all over the place.

A popular heuristic is to use some version of the Cycle popularized by Justin Mamis in his 1999 book, The Nature of Risk.

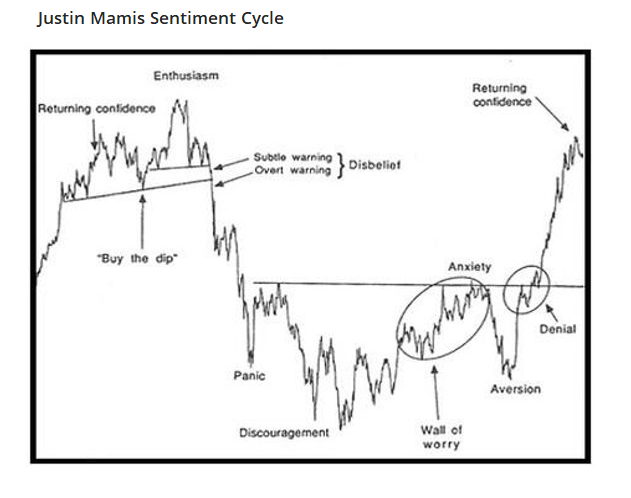
There are essentially 4 major parts to the cycle:

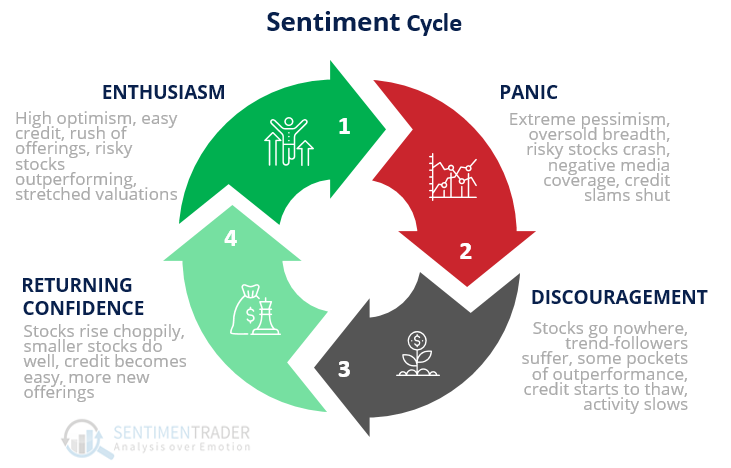
1. Enthusiasm - High optimism, easy credit, rush of offerings, risky stocks outperforming, stretched valuations

2. Panic - Extreme pessimism, oversold breadth, risky stocks crash, negative media coverage, credit slams shut

3. Discouragement - Stocks go nowhere, trend-followers suffer, some pockets of outperformance, credit starts to thaw, activity slows

4. Returning Confidence - Stocks rise choppily, smaller stocks do well, credit becomes easy, more new offerings

The Mamis chart encompasses the price path of U.S. stocks from roughly May 1990 through March 1991. When we overlay that against the past 200 days, we can get a rough sense of where we might be now.

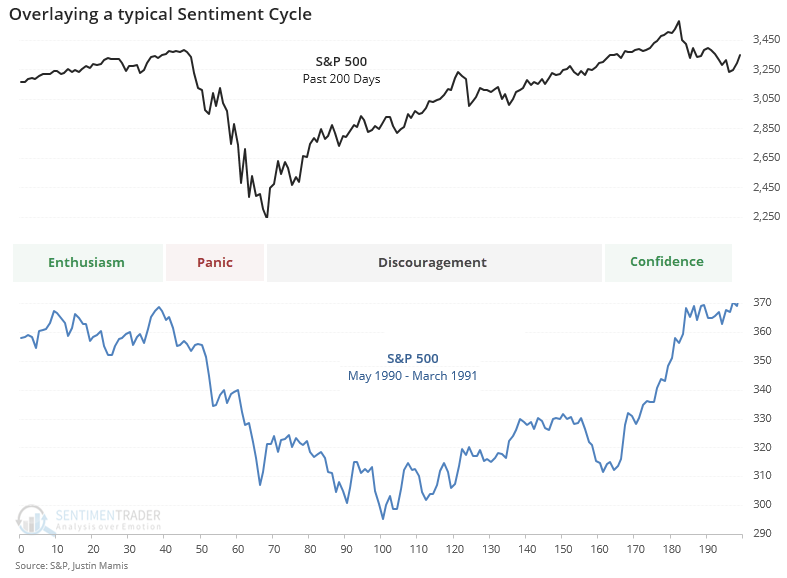
Based on eyeballing the chart, it looks like we're in the Returning Confidence part of the Cycle. There are some problems with this, like the fact that there are absolutely no rules when it comes to how long each of these phases can last. When we looked at this in April, a compelling case could be made that we were in the Discouragement phase, but investors pretty much went from Panic to Returning Confidence.

If we go back to 1928 and compare all periods to that 1990-1991 cycle, then we can see what kind of correlation we have to each part of the cycle. When we do that, we get the following estimates for where we are in the Cycle through early September:

1. Enthusiasm: -0.05

2. Panic: +0.08

3. Discouragement: +0.11

4. Returning Confidence: +0.69

The correlations range from -1.0 (perfect opposite) to +1.0 (perfect symmetry). So, clearly, there is a strong probability that Returning Confidence is where we are.

If we assume that's where we are, then let's see what happens next (if only it were that easy). Below, we can see every date when the Returning Confidence correlation peaked above +0.69, which it did a few weeks ago.

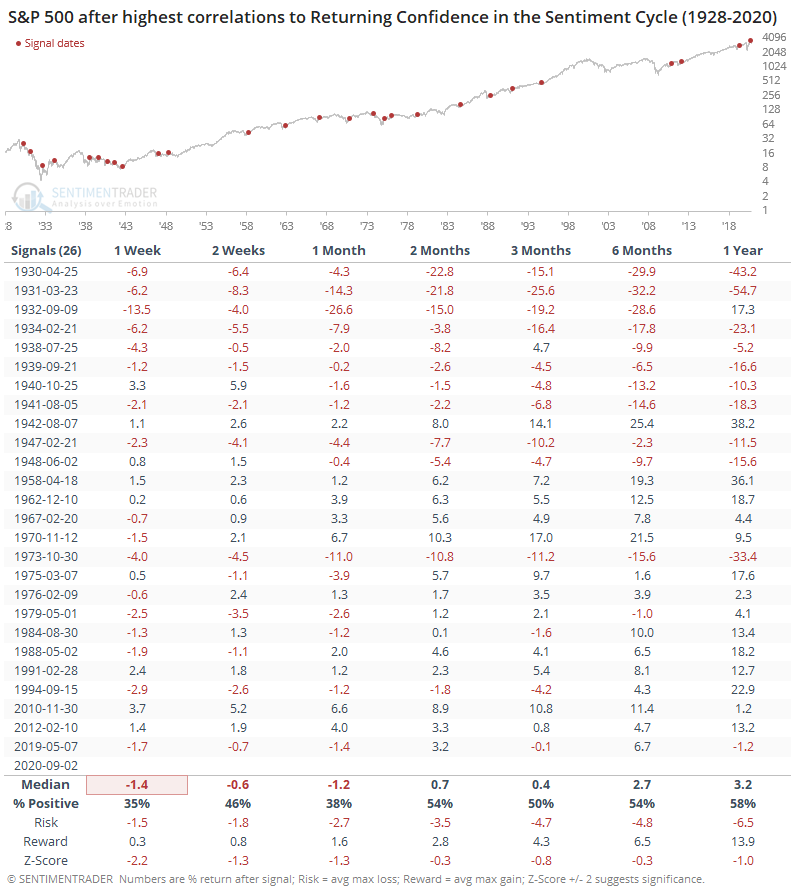
Returns were not great, but that's mostly due to pre-1950. If we focus on more recent markets, then it shows a drastic difference.

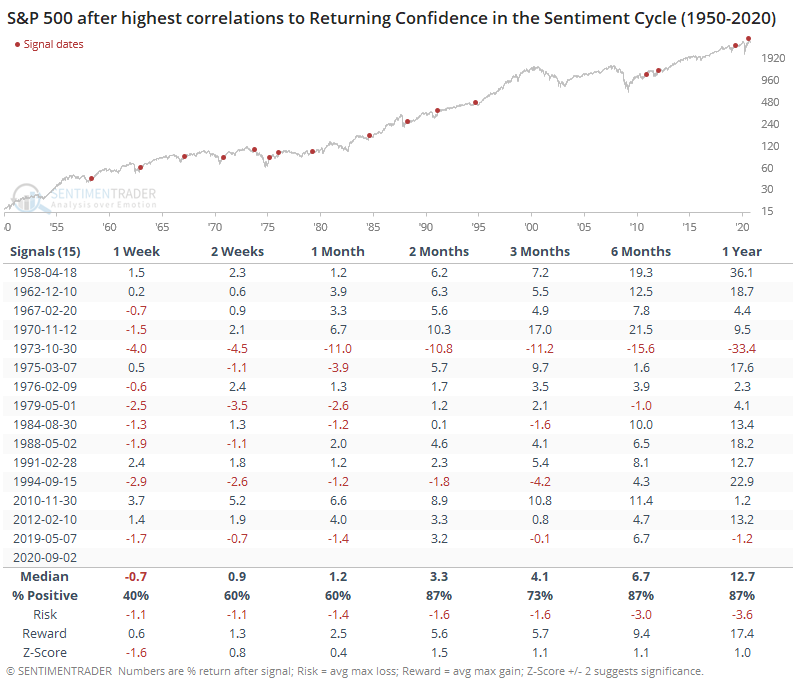
There wasn't much notable about the shorter-term, but from 2 months and beyond, returns were well above random, with good risk/reward ratios. The only major failure out of the 15 signals was in October 1973, and it was a big one.

This is an imprecise look at a subjective concept, but we've used the Sentiment Cycle a lot over the years and found it to be a good guide, as long as it's not taken as gospel. On a medium-term time frame, this should be a good sign. It helps to include other factors besides just a price analog, though, and from a longer-term point of view (1 year+), there is a strong case to be made that we're still enjoying the Enthusiasm part of the Cycle.

Sorry, you don't have access to this report

Upgrade your subscription plan to get access
Go to Dasboard
Indicators & Backtest Tools
IndicatorEdge
‍
BackTestEdge
‍
Other Tools
‍
DataEdge API
RESEARCH
reports
Research Solution
‍
Reports Library
‍
Strategies & Scanner
Trading Strategies
‍
Smart Stock Scanner
‍
FREE
RESOUrCES
Simple Backtest
Calculator
Simple Seasonality
Calculator
The Kelly Criterion
Calculator
Sentiment Geo Map
‍
Public Research Reports
‍
Free Webinar
COMPANY
‍
About
‍
In the News
‍
Testimonials
‍
Client Success Stories
Pricing
Bundle pricing
‍
Announcements
‍
FAQ
© 2025 Sundial Capital Research Inc. All rights reserved.
Setsail Marketing
TermsPrivacyAffiliate Program
Risk Disclosure: Futures and forex trading contains substantial risk and is not for every investor. An investor could potentially lose all or more than the initial investment. Risk capital is money that can be lost without jeopardizing ones’ financial security or life style. Only risk capital should be used for trading and only those with sufficient risk capital should consider trading. Past performance is not necessarily indicative of future results.

Hypothetical Performance Disclosure: Hypothetical performance results have many inherent limitations, some of which are described below. No representation is being made that any account will or is likely to achieve profits or losses similar to those shown; in fact, there are frequently sharp differences between hypothetical performance results and the actual results subsequently achieved by any particular trading program. One of the limitations of hypothetical performance results is that they are generally prepared with the benefit of hindsight. In addition, hypothetical trading does not involve financial risk, and no hypothetical trading record can completely account for the impact of financial risk of actual trading. for example, the ability to withstand losses or to adhere to a particular trading program in spite of trading losses are material points which can also adversely affect actual trading results. There are numerous other factors related to the markets in general or to the implementation of any specific trading program which cannot be fully accounted for in the preparation of hypothetical performance results and all which can adversely affect trading results.

Testimonial Disclosure: Testimonials appearing on this website may not be representative of other clients or customers and is not a guarantee of future performance or success.