Data &
Technology
Research
Reports
Report Solutions
Reports Library
Actionable
Strategies
Free
Resources
Simple Backtest Calculator
Simple Seasonality Calculator
The Kelly Criterion Calculator
Sentiment Geo Map
Public Research Reports
Free Webinar
Pricing
Company
About
Meet Our Team
In the News
Testimonials
Client Success Stories
Contact
Log inLoginSign up
< BACK TO ALL REPORTS

The best small-over-big start in 20 years

Jason Goepfert
2021-02-24
Small-cap stocks have put in one of their best-ever performances relative to large-cap stocks through mid-February. It's the first time they've beat large-caps by more than 10% in 22 years. Historically, this meant further gains shorter-term, but over the medium-term, those gains petered out.

It's been a heck of a year already for small-cap stocks. The Russell 2000 has enjoyed a typical year's worth of gains, and it's only February.

As the Wall Street Journal notes:

Smaller companies are more tied to the domestic economy than their large-cap counterparts, which make more money overseas. Economically sensitive sectors such as energy, materials and banking also account for more of the Russell 2000 than larger indexes. These cyclical groups were battered by the pandemic but are now powering markets to records.

Makes sense. But the last time small stocks got off to such a roaring start relative to large stocks was in the year 2000, not exactly an auspicious precedent.

Using the total return on small-cap stocks versus large-cap stocks going back to 1926, this is indeed the best relative performance for small stocks since 2000, even though it's far from their best-ever.

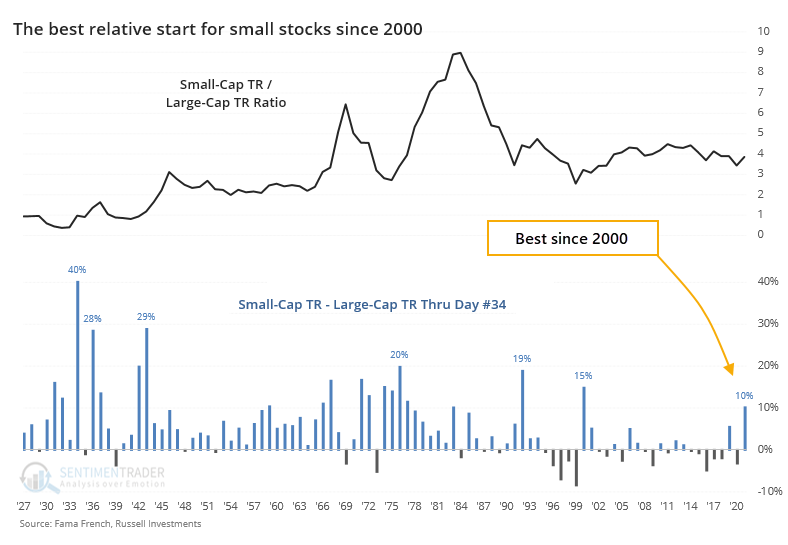
As for what it means, the table below shows forward returns in small stocks after every time they beat large stocks by at least 10% through trading day #34, roughly mid-February.

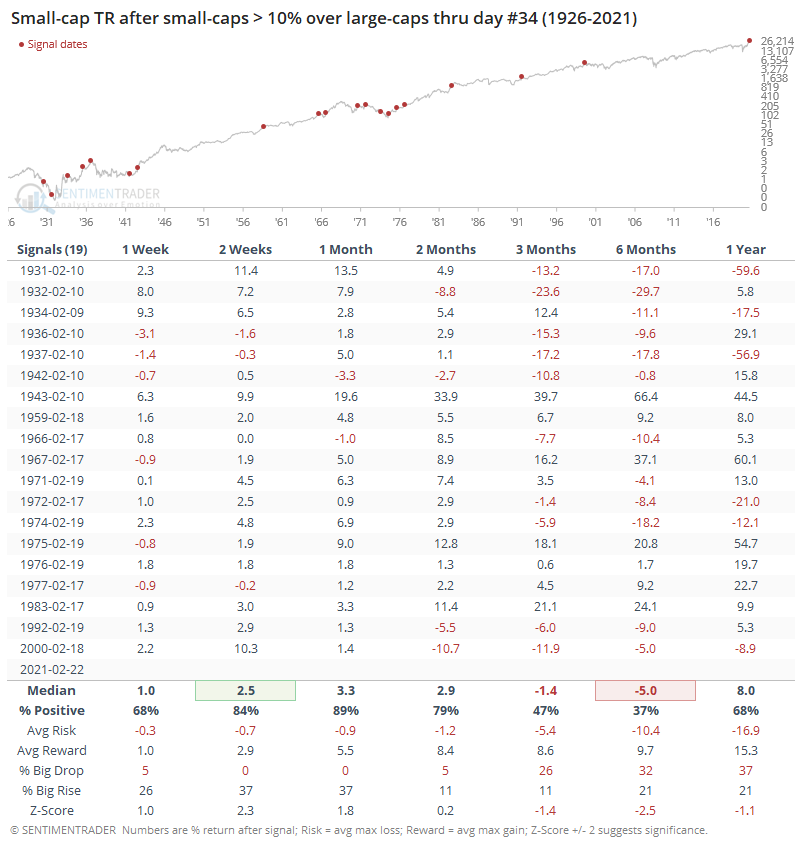
There was a pretty good tendency for the momentum to continue in the shorter-term, with positive returns through about the middle of March nearly 90% of the time - there were only 2 losses out of the 19 signals. Then it got hairy. By 6 months later, small stocks showed a positive return only 37% of the time.

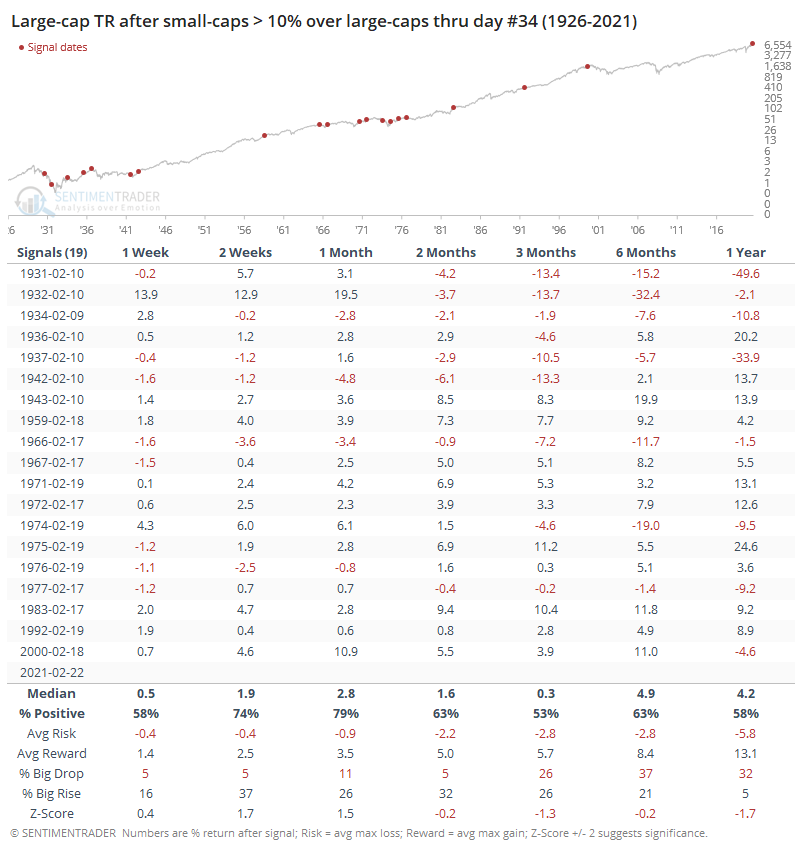
How about large-caps? Well, they showed worse short-term returns but held on better longer-term.

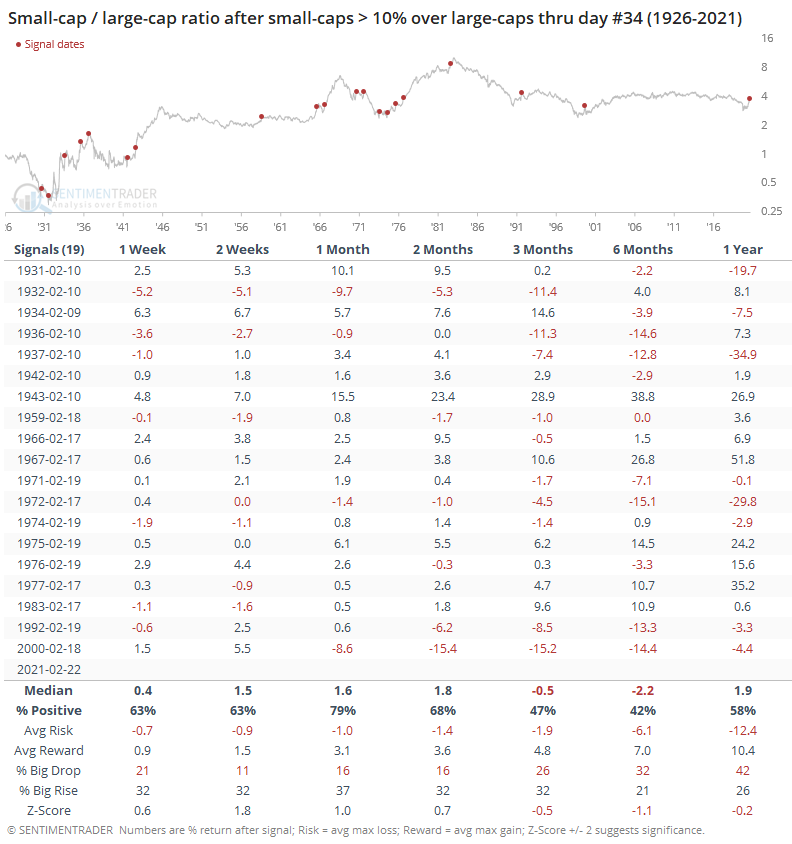
This means that the ratio of small-caps to large-caps tended to keep rising shorter-term, and tended to decline over the medium-term.

There are lots of theories about why small stocks are doing so much better than their big brothers in 2021, and most of them make sense. But markets aren't logical. If we go by what history suggests, then smaller stocks may keep beating bigger ones over the shorter-term due to momentum, but over the medium-term, mean-reversion has been a stronger influence.

Sorry, you don't have access to this report

Upgrade your subscription plan to get access
Go to Dasboard
DATA &
TECHnologies
IndicatorEdge
‍
BackTestEdge
‍
Other Tools
‍
DataEdge API
RESEARCH
reports
Research Solution
‍
Reports Library
‍
actionable
Strategies
Trading Strategies
‍
Smart Stock Scanner
‍
FREE
RESOUrCES
Simple Backtest
Calculator
Simple Seasonality
Calculator
The Kelly Criterion
Calculator
Sentiment Geo Map
‍
Public Research Reports
‍
Free Webinar
COMPANY
‍
About
‍
Meet our Team
‍
In the News
‍
Testimonials
‍
Client Success Stories
Pricing
Bundle pricing
‍
Announcements
‍
FAQ
© 2024 Sundial Capital Research Inc. All rights reserved.
Setsail Marketing
TermsPrivacyAffiliate Program
Risk Disclosure: Futures and forex trading contains substantial risk and is not for every investor. An investor could potentially lose all or more than the initial investment. Risk capital is money that can be lost without jeopardizing ones’ financial security or life style. Only risk capital should be used for trading and only those with sufficient risk capital should consider trading. Past performance is not necessarily indicative of future results.

Hypothetical Performance Disclosure: Hypothetical performance results have many inherent limitations, some of which are described below. No representation is being made that any account will or is likely to achieve profits or losses similar to those shown; in fact, there are frequently sharp differences between hypothetical performance results and the actual results subsequently achieved by any particular trading program. One of the limitations of hypothetical performance results is that they are generally prepared with the benefit of hindsight. In addition, hypothetical trading does not involve financial risk, and no hypothetical trading record can completely account for the impact of financial risk of actual trading. for example, the ability to withstand losses or to adhere to a particular trading program in spite of trading losses are material points which can also adversely affect actual trading results. There are numerous other factors related to the markets in general or to the implementation of any specific trading program which cannot be fully accounted for in the preparation of hypothetical performance results and all which can adversely affect trading results.

Testimonial Disclosure: Testimonials appearing on this website may not be representative of other clients or customers and is not a guarantee of future performance or success.