Data &
Technology
Research
Reports
Report Solutions
Reports Library
Actionable
Strategies
Free
Resources
Simple Backtest Calculator
Simple Seasonality Calculator
The Kelly Criterion Calculator
Sentiment Geo Map
Public Research Reports
Free Webinar
Pricing
Company
About
Meet Our Team
In the News
Testimonials
Client Success Stories
Contact
Log inLoginSign up
< BACK TO ALL REPORTS

Tech stocks have run over financials, industrials

Jason Goepfert
2020-06-22
Tech stocks have been a darling among investors, who have shunned financials and industrials, heaping scorn on old school investors like Warren Buffett. This preference for tech has pushed those shares to a near-record weight of the S&P 500 relative to other sectors, exceeded only by 1999-2000.

There is no doubt that the pandemic panic has been good to some corners of the market, particularly technology-related stocks. And their share prices have reflected it.

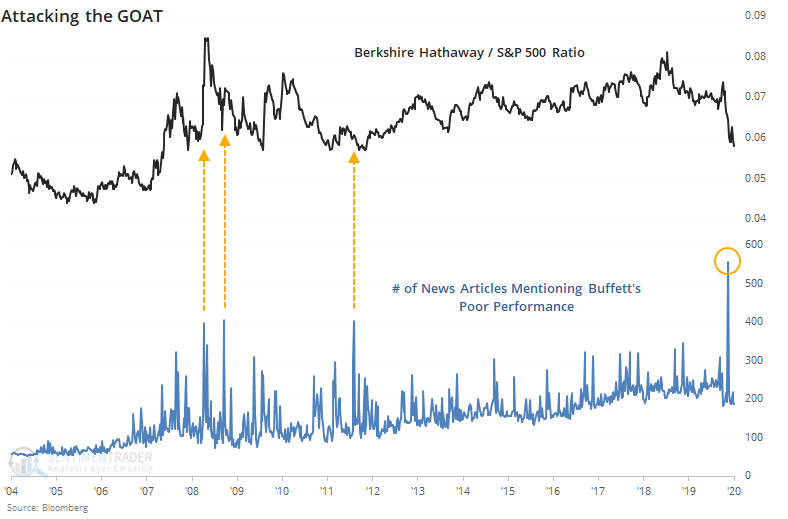
Other stocks, including industrials and financials, have struggled. It's no wonder that scorn heaped on Warren Buffett is the highest ever, thanks to conglomerates like Berkshire Hathaway being heavily invested in both sectors. Below, we can see the total number of news articles mentioning some kind of most likely derogatory mention of Buffett including terms like BAD YEAR, CRUSHED, LOSE, LOST, TOUCH, LOST TOUCH, OLD, RETIRE, PERFORMANCE, UNDERPERFORM.

The difference in investor preferences toward tech and away from other sectors has pushed the weights of these sectors to multi-decade extremes, or nearly so.

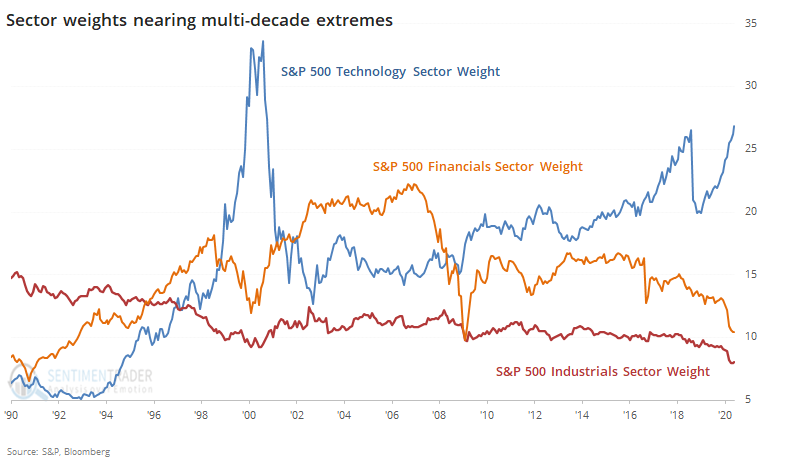
The tech sector now makes up 27% of the weight of the S&P 500. That has been exceeded only by the bubble stretch from late 1999 through the fall of 2000. Financials have sunk to barely 10% of the S&P, nearly the lowest since 1992, eclipsed only by February 2009 when it accounted for only 9.8% of the index. Industrials have been a consistently less important part of the S&P, but 2020 has been a real killer, and the sector now makes up only 8% of the index, the smallest influence in 30 years.

If we look at the spreads between the weight of technology versus financials, we can see just how stark the difference is relative to history.

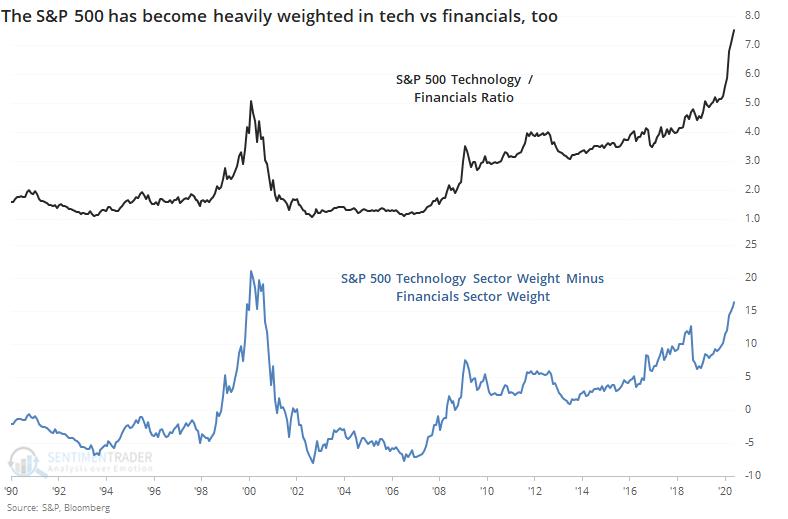
Tech stocks now have 16% more weight in the S&P than financials do, a spread that has been exceeded only once in 30 years, from December 1999 through October 2000.

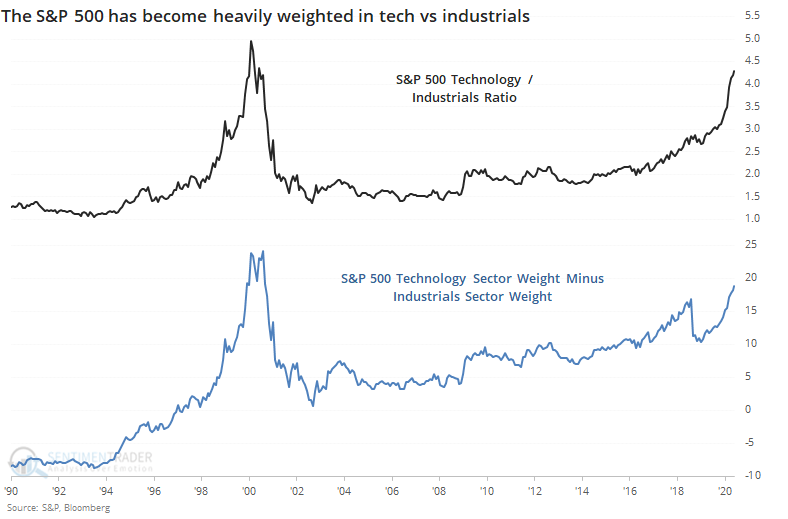
It's virtually the same picture for industrials.

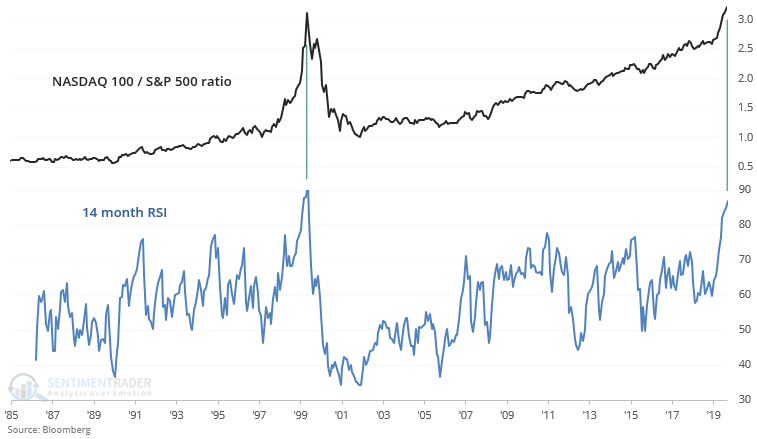
If we just look at the ratio between the Nasdaq 100 (dominated by the big tech firms driving the broader Nasdaq indexes higher) versus the entire S&P 500, the monthly Relative Strength Index (RSI) has been exceeded only one other time, as Troy showed in a premium note. The current reading can only be matched by December 1999 through February 2000.

There is no guarantee that we have to repeat history, if only in rhyme. Maybe the pandemic has fundamentally altered how consumers and investors will view the world. We don't bet on "maybe", rather we'd prefer to let history be a guide and look for times when multiple factors line up. And they're lining up now to suggest that tech's run, relative to other parts of the market, in particular, is likely becoming exhausted.

Sorry, you don't have access to this report

Upgrade your subscription plan to get access
Go to Dasboard
DATA &
TECHnologies
IndicatorEdge
‍
BackTestEdge
‍
Other Tools
‍
DataEdge API
RESEARCH
reports
Research Solution
‍
Reports Library
‍
actionable
Strategies
Trading Strategies
‍
Smart Stock Scanner
‍
FREE
RESOUrCES
Simple Backtest
Calculator
Simple Seasonality
Calculator
The Kelly Criterion
Calculator
Sentiment Geo Map
‍
Public Research Reports
‍
Free Webinar
COMPANY
‍
About
‍
Meet our Team
‍
In the News
‍
Testimonials
‍
Client Success Stories
Pricing
Bundle pricing
‍
Announcements
‍
FAQ
© 2024 Sundial Capital Research Inc. All rights reserved.
Setsail Marketing
TermsPrivacyAffiliate Program
Risk Disclosure: Futures and forex trading contains substantial risk and is not for every investor. An investor could potentially lose all or more than the initial investment. Risk capital is money that can be lost without jeopardizing ones’ financial security or life style. Only risk capital should be used for trading and only those with sufficient risk capital should consider trading. Past performance is not necessarily indicative of future results.

Hypothetical Performance Disclosure: Hypothetical performance results have many inherent limitations, some of which are described below. No representation is being made that any account will or is likely to achieve profits or losses similar to those shown; in fact, there are frequently sharp differences between hypothetical performance results and the actual results subsequently achieved by any particular trading program. One of the limitations of hypothetical performance results is that they are generally prepared with the benefit of hindsight. In addition, hypothetical trading does not involve financial risk, and no hypothetical trading record can completely account for the impact of financial risk of actual trading. for example, the ability to withstand losses or to adhere to a particular trading program in spite of trading losses are material points which can also adversely affect actual trading results. There are numerous other factors related to the markets in general or to the implementation of any specific trading program which cannot be fully accounted for in the preparation of hypothetical performance results and all which can adversely affect trading results.

Testimonial Disclosure: Testimonials appearing on this website may not be representative of other clients or customers and is not a guarantee of future performance or success.