
Ringing in Spring with AMD

As you may be aware, I am fan of seasonality. I especially like it in commodities - particularly those that have a relatively regular production or planting pattern (i.e., patterns that repeat). I also like it when applied to indexes and sectors. I am a bit more dubious of using seasonality with individual stocks, primarily for the reason that I have seen so many well known (at one time) companies cease to exist over the years. The reality is that no company is guaranteed to last forever. All that being said, there are exceptions to every rule. Take AMD for instance.
Ticker AMD
Don't get me wrong. As a member of the "technology-related" sector - and an extremely competitive sector at that - AMD is always one major wrong move away from massive - and potentially permanent - trouble. But it does seem to have some cyclicality to it, one period in particular. Let's take a closer look at this period and then examine a couple of potential ways to play.
Before proceeding, let me point out - as always - that what follows is not any sort of "recommended trade." Anytime I highlight example trades it is solely for the purpose of illustrating different ways to potentially take advantage of a particular opportunity and to help you develop your own ability to:
- Spot opportunity
- Exploit opportunity
Ringing In Early Spring
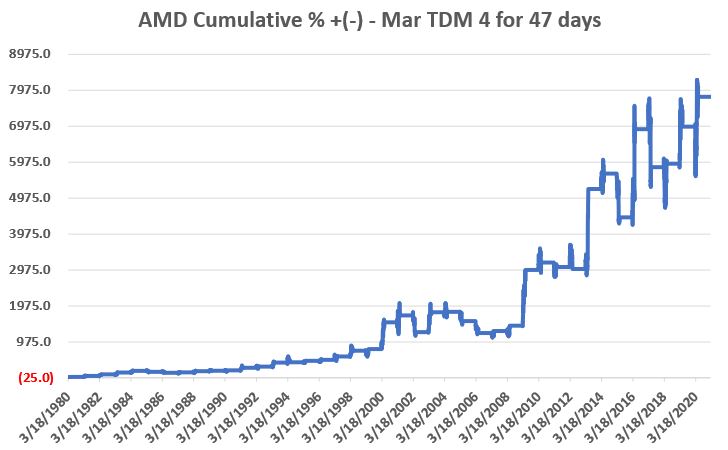
The "seasonally favorable" period we will analyze begins at the close of the 4th trading day of March and extends for 47 trading days. This year that period extends form the close on 3/4/21 through the close on 5/11/2021. The chart below displays the hypothetical cumulative percentage gain or loss achieved by holding AMD during this 47-day period every year since the stock started trading in 1980.
The table below displays the relevant facts and figures.
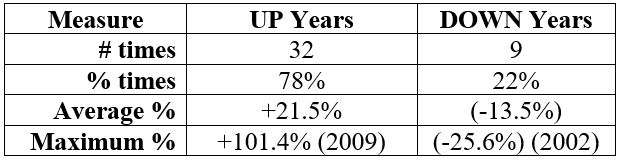
Obviously, this is nowhere close to a "sure thing". But with a high winning percentage and an average gain that is larger than the average loss, the historical numbers suggest there may be some sort of "edge" here.
The chart below displays a bar chart of AMD. In terms of what this chart displays, a trader can pretty much see whatever they "want" to see:
- One trader will look at this chart and see a stock that is "oversold" and once again attempting to "test support"
- Another trader will see a stock on the verge of a major breakdown after a 6-month topping formation
- Interestingly (at least in my market-addled mind), still another trader may be put off by the apparent "bottom-picking" nature of this situation. But remember, the catalyst for this trade is seasonality, not price action.
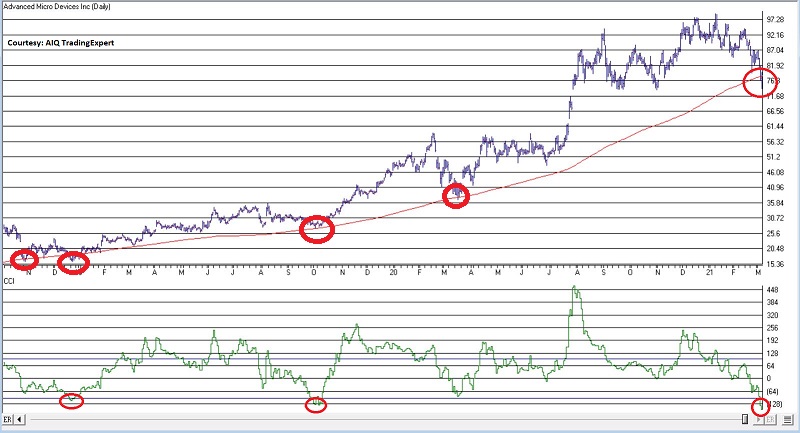
I will offer no opinion whatsoever. I will merely point out that it is valid to think that a confluence of a favorable seasonal period AND a successful test of a major moving average might appeal to some - though certainly not all - traders. It is also reasonable to believe that a lot of traders might hesitate to drop $7,800+ to buy 100 shares of a stock that is potentially on the "edge of the precipice."
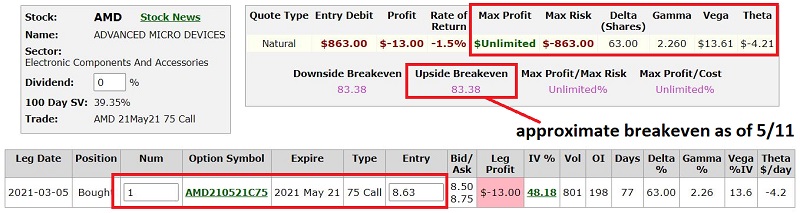
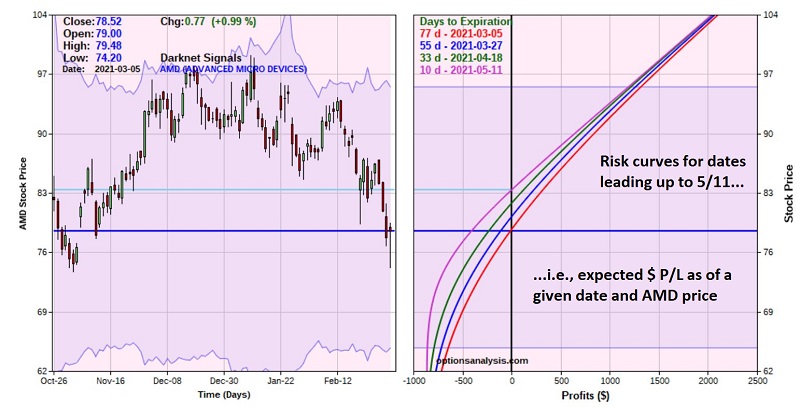
This situation might present an opportunity for using what is typically referred to as the "stock replacement strategy" using options. Because the seasonally favorable period ends on 5/11 one can consider May options which expire on 5/21. One potential example appears below. The figure below displays the particulars and the chart below that displays the risk curves (which display the expected $ return at any given price for AMD stock as of a given date leading up to May 11).
The Good News:
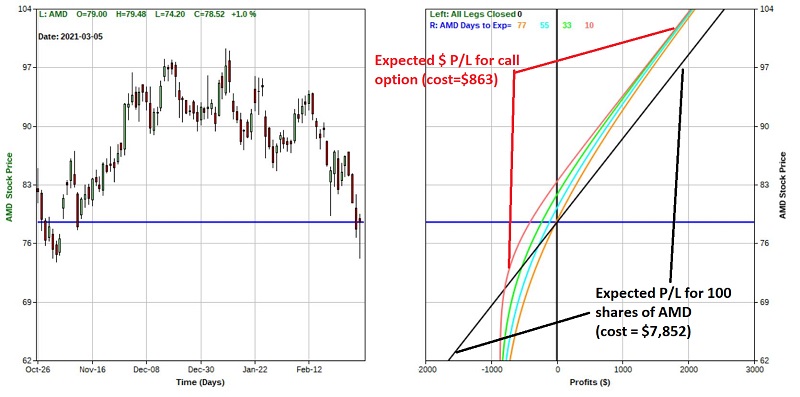
- This position costs only $862 to enter, compared to buying 100 shares of AMD at $78.52, which costs $7,852
- This position will move dollar for dollar with the stock above the breakeven price
- $862 is the most a call option buyer could lose even if AMD stock falls apart completely between now and mid-May
The Bad News:
- Because we are paying time premium the breakeven price as of May 11 is roughly $83.38 (this could change if implied volatility rises or falls significantly between now and then), which is roughly 6% above the current price of the stock.
A comparison of the risk curves for this trade through 5/11 (10 days prior to option expiration) versus holding 100 shares of stock appears in the risk curve chart below.
The Decision Tree
From here a trader must make choices regarding AMD:
- Make a trade or don't make a trade
If the choice is "make a trade":
- Buy stock shares
- Buy a call option (and then decide which expiration month/strike price call option to buy)
- OR, use a different option strategy
The reality is that there are no "right" or "wrong" answers - except in hindsight. So, for any potential opportunity the first decision is whether to participate or to wait for the next opportunity.
From there the question is how best to allocate capital and how best to manage risk.
Same as it ever was...