Products
SentimenTrader Trading Tools
‍
Backtest Engine
My Trading Toolkit
Correlation Analysis
Seasonality
Market Prediction
Indicators & Data API
‍
Proprietary Indicators & Charts
Market Data API
Strategies & Scanner
‍
50+ Trading Strategies
Smart Stock Scanner
Smart Option Scanner
Research Reports
‍
Research Solutions
Reports Library
Free Resources
Simple Backtest Calculator
Simple Seasonality Calculator
The Kelly Criterion Calculator
Sentiment Geo Map
Public Research Reports
Education
Sentiment Indicators
Technical Indicators
Pricing
Company
About
In the News
Testimonials
Client Success Stories
Contact
Log inLoginSign up
< BACK TO ALL REPORTS

More signs of a recovery in cyclical industries

Dean Christians
2023-07-14
With 50% of cyclical sub-industry groups up 40% or more from their 1-year lows and the percentage of Industrial sector stocks in a bear market falling below 5%, the recovery in economically sensitive industries suggests stocks can go higher over the next year.

Key points:

  • The percentage of cyclical industries that have risen by more than 40% from their 1-year lows reached 50%
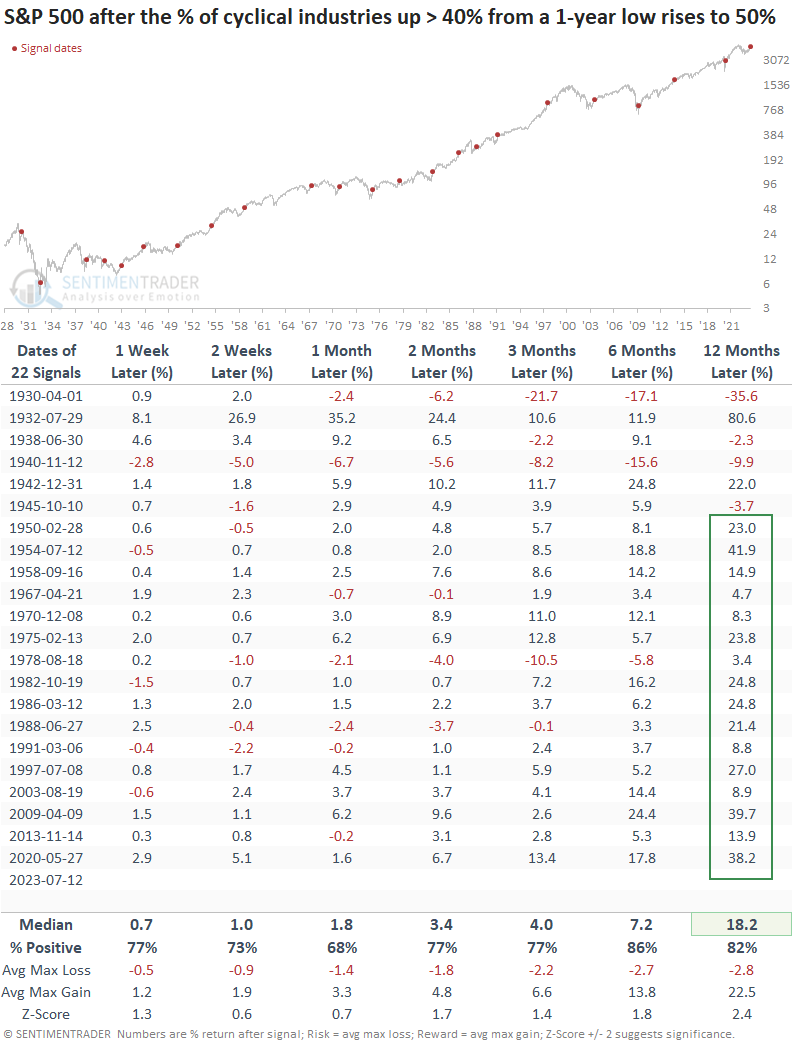
  • After similar recoveries, the S&P 500 was higher every time a year later since 1945
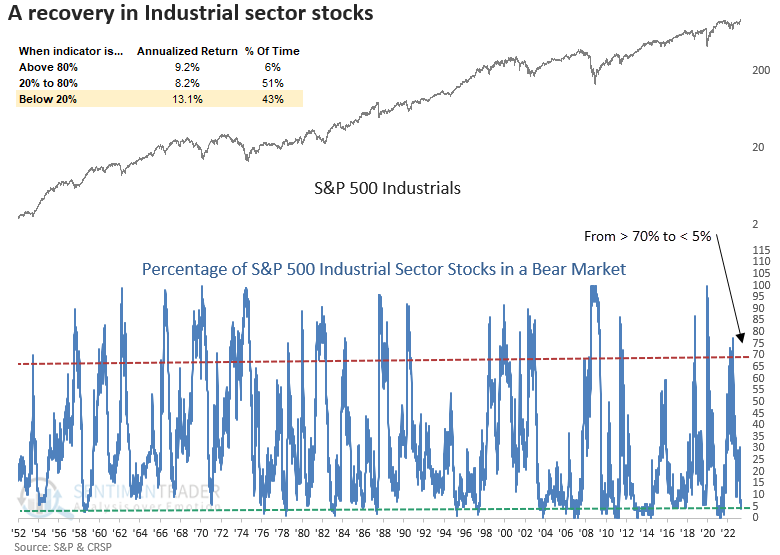
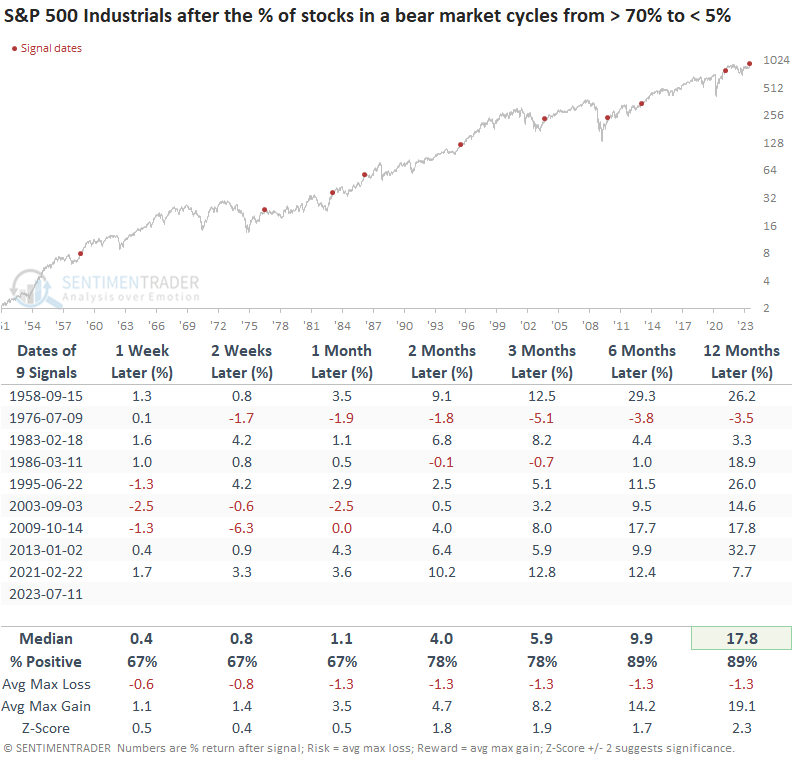
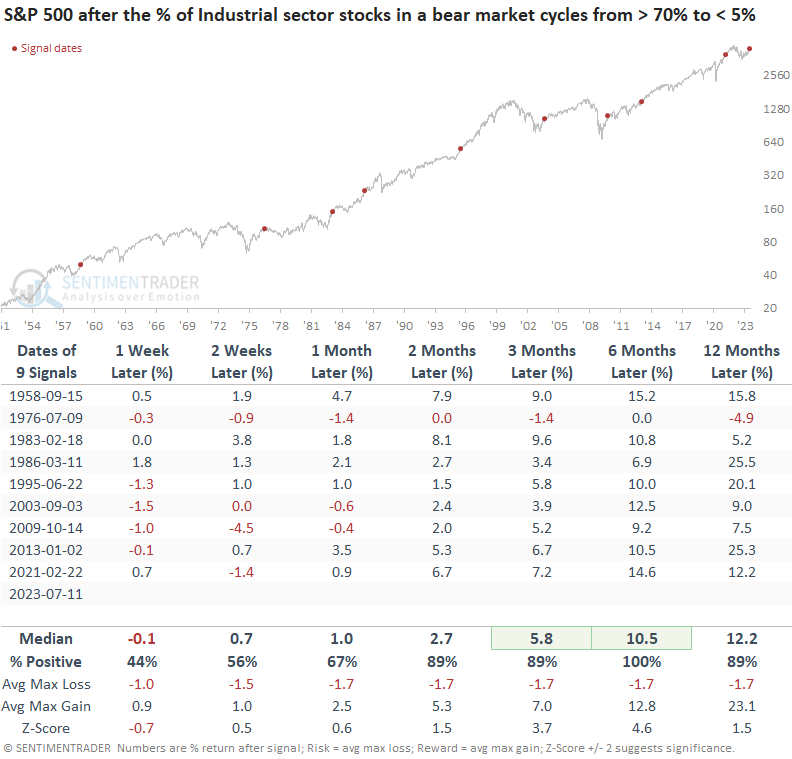
  • Industrial stocks in a bear market have cycled from greater than 70% to less than 5%

Price trends for economically sensitive cyclical industries continue to improve

Whether Consumer Discretionary, Industrials, or cyclical sub-industries, a preponderance of evidence in groups that are more sensitive to changes in the business cycle continues to build in support of the bullish case for stocks.

The latest indicator to trigger a bullish alert is the percentage of cyclical sub-industry groups up more than 40% from their respective 1-year lows. When this measure hits or exceeds 50%, stocks have historically risen at a 15% annualized rate.

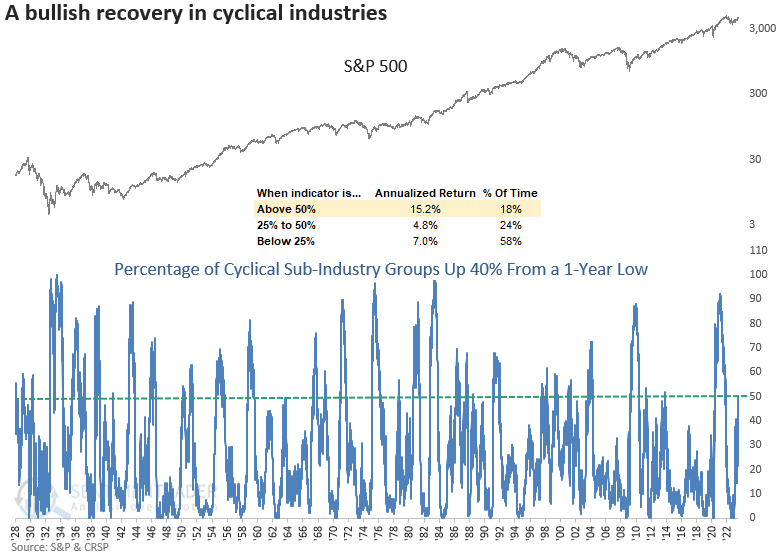
The cyclical sub-industry composite is comprised of 31 groups covering autos, housing, travel, banking, construction, transportation, semiconductors, and several others.

Similar recoveries in cyclical groups preceded solid returns

When 50% or more sub-industry groups increase by greater than 40% from their respective 1-year lows, the bullish price momentum for the world's most benchmarked index continues. A year later, the S&P 500 was higher 82% of the time, with the last unprofitable signal coming in 1945. And only three signals occurred in a bear market, all prior to 1942.

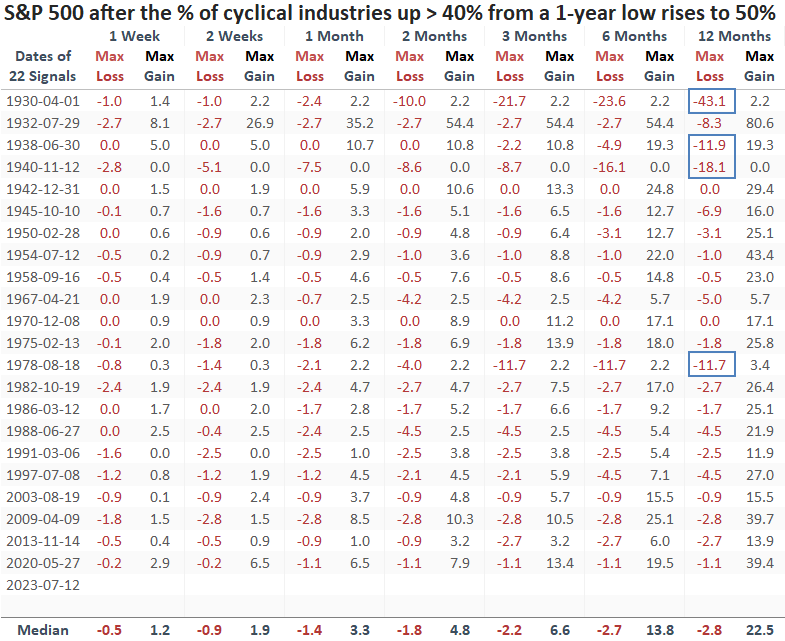
A year later, the max loss exceeded -10% in only 4 out of 22 cases, with all but one coming before 1942.

Only a handful of Industrial sector stocks remain in a bear market

The percentage of Industrial sector stocks in a bear market cycled from greater than 70% to less than 5% for only the 10th time since 1958. 

Annualized returns are solid when fewer than 20% of stocks are in a bear market.

The favorable price momentum in the Industrials sector will likely continue for the foreseeable future. A year later, the sector was higher in all, but one case, and that negative precedent was minimal at only -3.5%.

When I apply the signals to the S&P 500, the outlook for the broad market also looks bullish, with no losses over the subsequent six-month period.

What the research tells us...

An overwhelming amount of evidence continues to stack up on the bullish side of the ledger, suggesting stocks have transitioned to a new uptrend. With 50% of cyclical sub-industry groups soaring by 40% or more from their 1-year lows and the percentage of Industrial sector stocks in a bear market declining below 5%, the resurgence observed in economically sensitive groups provides a positive outlook for stocks over the next year.

PRODUCTS
SentimenTrader
Trading Tools
Indicators & Data API
‍
Strategies & Scanner
‍
Research Reports
FREE
RESOUrCES
Simple Backtest
Calculator
Simple Seasonality
Calculator
The Kelly Criterion
Calculator
Sentiment Geo Map
‍
Public Research Reports
‍
Education
Sentiment Indicators
‍
Technical Indicators
‍
Pricing
Bundle pricing
‍
FAQ
‍
Announcements
‍
COMPANY
‍
About
‍
In the News
‍
Testimonials
‍
Client Success Stories
CONTACT
‍
General Inquiries
‍
Media Inquiries
‍
Financial Professionals Inquiries
‍
© 2026 Sundial Capital Research Inc. All rights reserved.
Setsail Marketing
TermsPrivacyAffiliate Program
Risk Disclosure: The information and tools provided are for research and analytical purposes only and are not intended as investment advice. Market analysis involves uncertainty, and outcomes may differ from expectations. Users should conduct their own due diligence and consider their individual circumstances before making any financial decisions. Past performance is not necessarily indicative of future results.

Hypothetical Performance Disclosure: Hypothetical performance results have many inherent limitations, some of which are described below. No representation is being made that any account will or is likely to achieve profits or losses similar to those shown; in fact, there are frequently sharp differences between hypothetical performance results and the actual results subsequently achieved by any particular trading program. One of the limitations of hypothetical performance results is that they are generally prepared with the benefit of hindsight. In addition, hypothetical trading does not involve financial risk, and no hypothetical trading record can completely account for the impact of financial risk of actual trading. for example, the ability to withstand losses or to adhere to a particular trading program in spite of trading losses are material points which can also adversely affect actual trading results. There are numerous other factors related to the markets in general or to the implementation of any specific trading program which cannot be fully accounted for in the preparation of hypothetical performance results and all which can adversely affect trading results.

Testimonial Disclosure: Testimonials appearing on this website may not be representative of other clients or customers and is not a guarantee of future performance or success.