Investors Intelligence % Bull's 3-Month Low

When I opened my email from Investors Intelligence this morning to review the latest survey data, the subject had the following headline.
"Bulls fall to a three-month low."
Whenever I see print or television statements about new market information, the coder in me gets to work.
Let's take a look at the subject line from Investors Intelligence to see if we can find any useful information.
Chart and Signal Performance
If one bought the S&P 500 on each three-month low in the % Bull's survey and held it for ten weeks (best optimization), a total of 349 trades would have occurred since 1970. Please note, I did not screen out for repeats. By not screening out for repeats, I removed some of the subjectivity from the study. Results are inline to slightly better across most timeframes.


Chart and Signal Performance with Second Condition
The most recent 3-month low in the % Bull's data occurred within two weeks of a 52-week high for the S&P 500 Index. Let's take a look at the results when I add that condition to the code. The total signals go from 349 to 56. The short-term performance is slightly better than the study period and remains healthy in the 6-12 month timeframe.


Chart and Signal Performance with Second and Third Condition
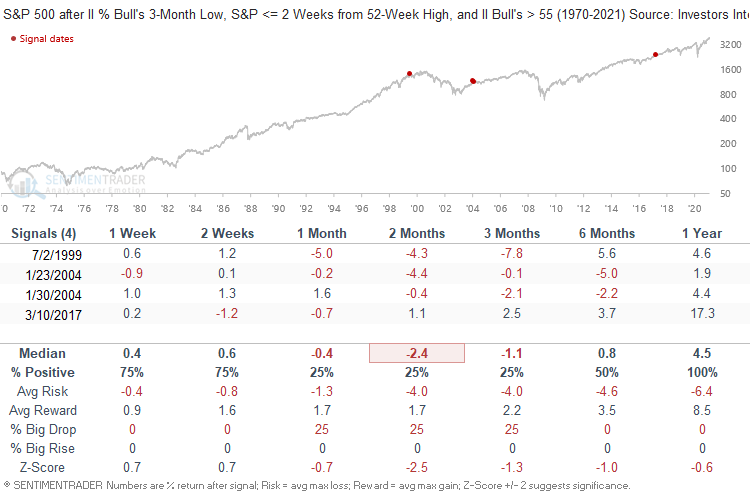
Let's now add one final condition to the study. The most recent signal not only occurred within two weeks of a high but also with the % Bull's survey above 60. Please note, a condition of >= 60% returned no instances. Therefore, I eased the condition level to 55%. As always, it's difficult to gain much of an information edge from such a small sample size.


