Hang Seng Index - Six Month Low Reversal

Chinese stocks have been in the news as several local currency indexes and U.S. dollar-based ETFs have registered significant corrections or outright bear market drawdowns.
In a note on 9/22/21, Jason shared several studies that showed that the Hang Seng Index was nearing a historic washout.
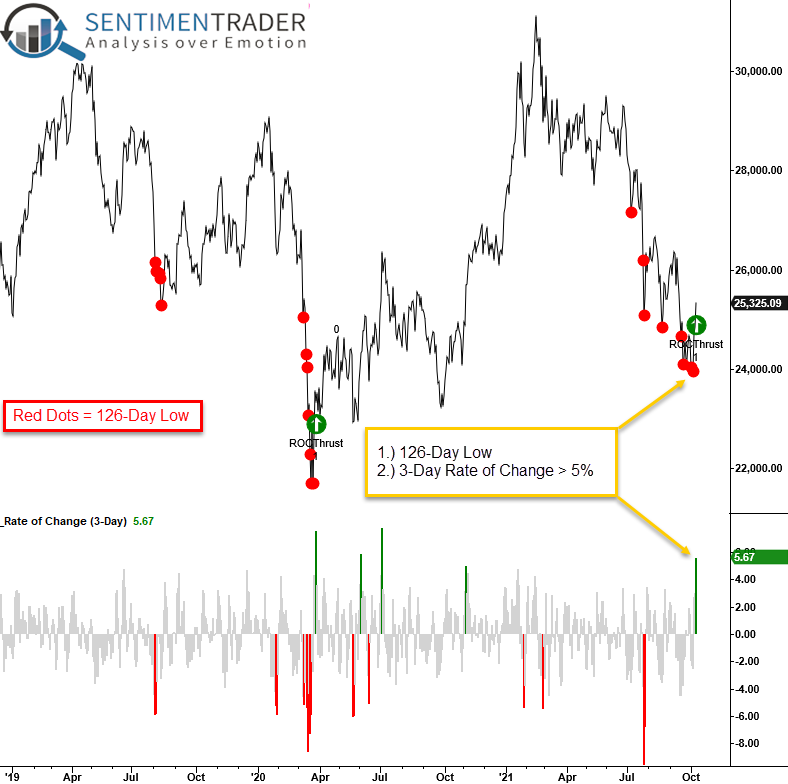
Over the previous three trading days, the Hang Seng Index has reversed from a 6-month low, with its 3-day rate of change registering a reading of 5.67%.
Let's conduct a study to assess the outlook for the Hang Seng (HSI) when the index closes at a 126-day low and subsequently registers a 3-day rate of change surge of greater than 5%.
CURRENT DAY CHART

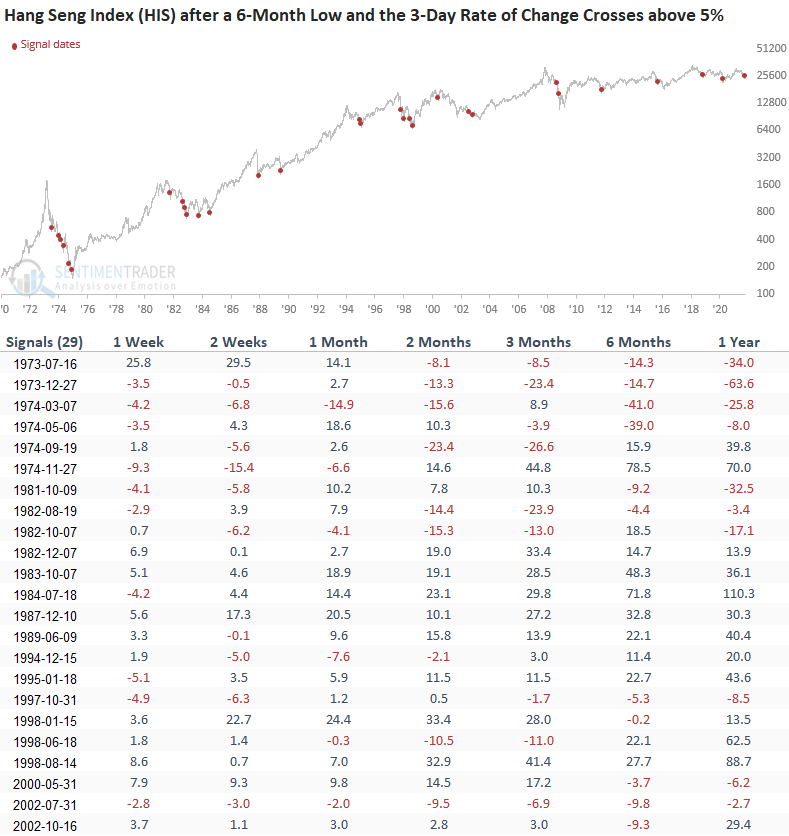
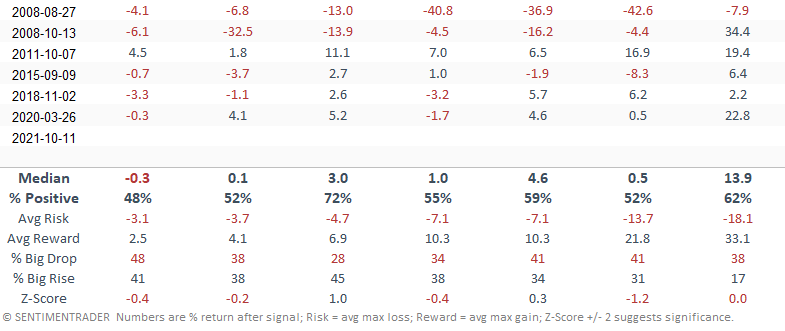
HOW THE SIGNALS PERFORMED
Results look uninspiring in the first couple of weeks. However, the 1-month window shows some opportunity for a mean reversion trade. The unfavorable signals in the 1-month window mainly occurred during significant global bear market periods, which is not the case now.


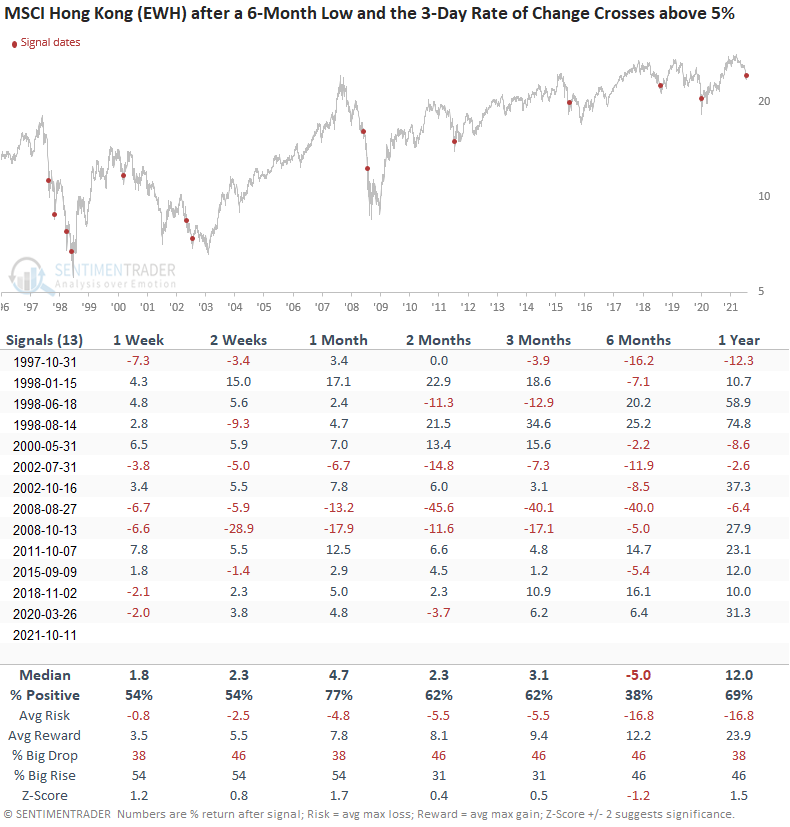
Let's apply the Hang Seng signal dates to the iShares Hong Kong ETF to see if an opportunity exists for a U.S. dollar-based trade. Please note the EWH ETF started in 1996, so the total signal count will not match.
HOW THE SIGNALS PERFORMED
Results look a little better, especially the 1-month window. As was the case with the Hang Seng Index, an opportunity exists if you exclude the bear market periods.


