
Gold Yes, Gold No

Key Points
- "Opportunity is where you find it"
- Gold appears to be setting up for something…
- …however, different traders have different ideas regarding what that "something" will be
Ticker GLD
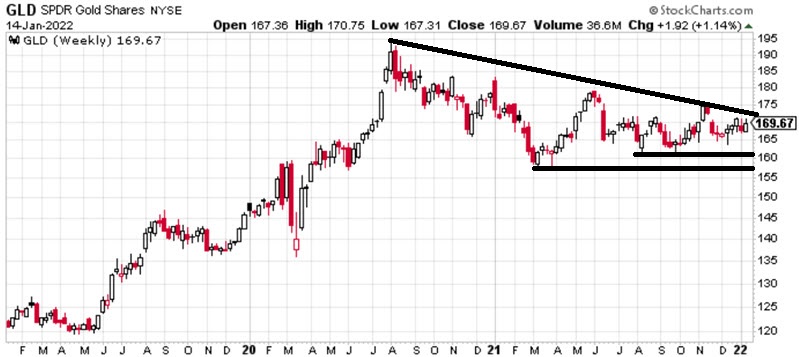
The chart below (courtesy of StockCharts.com) is a weekly chart for iShares Gold Trust (GLD), which tracks the price of gold futures.
The reality is that different traders will look at the chart above and see entirely different things.
- One trader will see a market that had a good run and has since pulled back and is now poised for the next up leg
- Another trader will see a market that has "rolled over" and is now in the early stages of an impending decline
- Yet another trader will see a market mired in a trading range
Who will be right, and who will be wrong? This piece will make no effort to answer that question. The point of this piece is to highlight the potential for each trader to speculate on their preferred scenario without assuming a great deal of dollar risk.
The strategy: Calendar spread
For this piece, we will use a strategy referred to as the "calendar spread," using options on ticker GLD. A calendar spread involves buying a longer-dated call or put option and simultaneously selling a shorter-dated call or put option (typically at the same strike price - although the strikes can be split).
The bullish call calendar spread
Options traders are often naturally drawn to shorter-term options - i.e., those that expire sooner than later - because of their low cost. However, for this example, we want to give GLD a little time to move, so we will sell Mar18 2022 calls and buy Jun2022 calls. This allows 63 calendar days - or roughly two months - for some price movement for GLD to develop.
Our example trade is:
- Buy 1 Jun17 2022 180 call @ $2.84
- Sell 1 Mar18 2022 180 call @ $0.87
The cost to buy a 1-lot is $197. A trader would decide what % of their trading capital they wish to commit and then trade the appropriate lot size. For example, a trader with $25,000 decides to commit only 1% ($250). This trader would buy a 1-lot. If the same trader decided to commit 5% ($1,250), they could trade a 6-lot ($1,250 / $197).
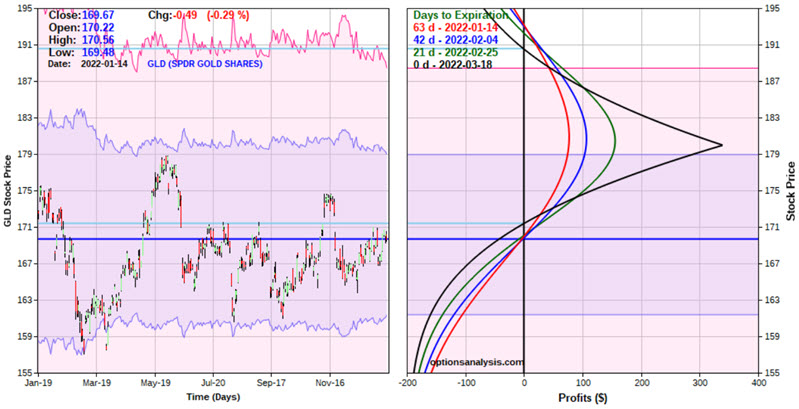
The particulars and risk curves for this trade appear in the figures below (All figures below are courtesy of Optionsanalysis).
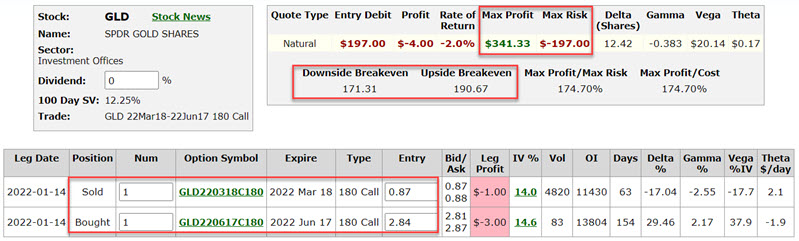
This trade is a low-dollar risk speculative bet that GLD will work its way higher at some point between now and March expiration.
Managing the trade
Once a trade is selected and entered, the keys to option trading success are determining in advance:
- What will cause you to exit with a profit
- What will cause you to exit with a loss
Exiting with a profit: My suggestion is to exit or adjust this position in one of two situations:
- If GLD price approaches $180 a share
- If you have a trusted "overbought" indicator AND it signals that GLD is overbought AND you have an acceptable profit
Note that the risk curves "rollover" when price approaches the 180-strike price. Therefore, there is no good reason to hold this position once GLD reaches $180 a share. If price hits 180 today (red line in the risk curves chart), the open profit will be roughly $77. If it closed at exactly $180 a share on March 18, the profit would be approximately $340. In other words, due to time decay (positive theta), this trade becomes more profitable over time as long as GLD is within the profit zone shown in the risk curves chart.
Also, if GLD becomes "overbought" (according to your own trusted overbought indicator) and you have an acceptable profit, it can make sense to exit or adjust the trade rather than risking giving back your open profit.
Exiting with a loss: The key decision is whether to risk the entire amount spent to enter the trade or cut your loss if a particular support level is broken (FYI, there are no "correct" answers, only decisions to be made). For example, if the August low of $160.68 is taken out, you might consider exiting and trying to salvage whatever premium might be left.
The bearish put calendar spread
For a trader looking to play the bearish side of GLD, our example trade is:
- Buy 1 Jun17 2022 160 call @ $2.60
- Sell 1 Mar18 2022 160 call @ $0.90
The particulars and risk curves for this trade appear in the figures below.
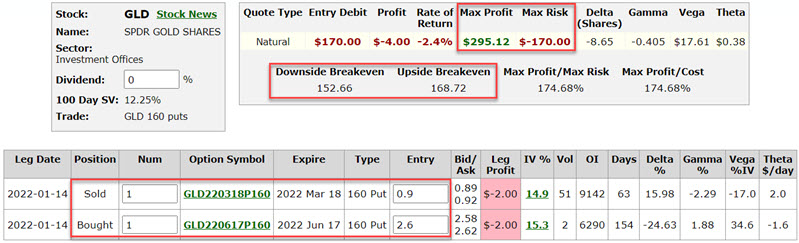
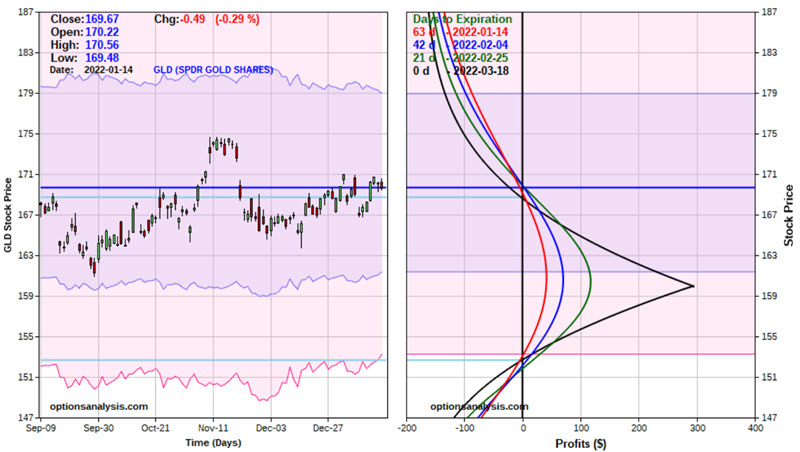
This trade is a low-dollar risk speculative bet that GLD will work its way lower sometime between now and March expiration.
Managing the trade
Exiting with a profit: My suggestion is to exit or adjust this position in one of two situations:
- If GLD price approaches $160 a share
- If you have a trusted "oversold" indicator AND it signals that GLD is oversold AND you have an acceptable profit
Note that the risk curves "rollover" when price approaches the 160-strike price. Therefore, there is no good reason to hold this position once GLD reaches $160 a share. If price hits 160 today (red line in the risk curves chart), the open profit will be roughly $41. If it closed at exactly $160 a share on March 18, the profit would be approximately $295.
Also, if GLD becomes "oversold" (according to your own trusted overbought indicator) and you have an acceptable profit, it can make sense to exit or adjust the trade rather than risking giving back your open profit.
Exiting with a loss: The key decision is to risk the entire amount spent to enter the trade or cut your loss if a particular resistance level is broken. For example, if the June 2021 high of $178.85 is taken out, you might consider exiting and trying to salvage whatever premium might be left).
What the research tells us…
A calendar spread can offer a low-dollar risk way to gain exposure in areas you might typically stand aside. Likewise, this strategy can provide a low dollar commitment, substantial upside potential, and a way to take advantage of an increase in volatility.