Headlines
|
|
Weekly Wrap for Nov 19 - Chinese tech, long-term breadth, Mid-Cap seasonality, rising commodities:
This week, we saw more improvement in some long-term breadth momentum indicators, though very short-term breadth late in the week was very poor. Chinese tech stocks have (mostly) been doing what they should, as insiders buy Materials and Technology. Commodities continue to hold up, even with a rising dollar.
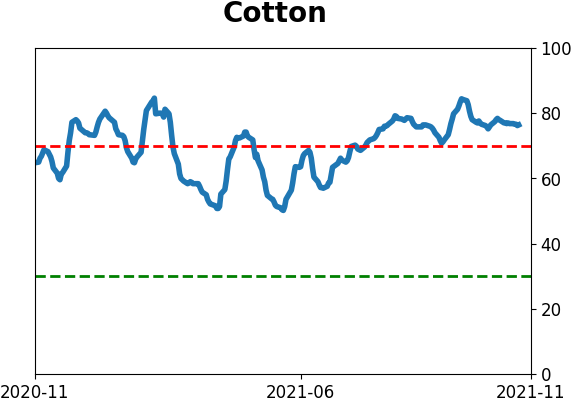
The latest Commitments of Traders report was released, covering positions through Tuesday: The 3-Year Min/Max Screen shows that "smart money" hedgers didn't make many major changes this week, with no new multi-year extremes in their positioning. They reduced their near-4-year-extreme net short against the U.S. dollar by a small amount. They added again to a massive net short position against major equity index futures contracts, though to reiterate, we place less weight on this data for stocks as it's been acting oddly since last summer. Over the past 3 weeks, hedgers have held more than 15% of open interest net long in 10-year Treasury notes. The Backtest Engine shows that the TLT fund rallied 83% of the time over the next 3 months, averaging +3.5%, after similar behavior. They've started to reverse a record long position in palladium, typically what we see near the beginnings of major sustained rallies. Massive short positions in coffee and cotton have had no impact, similar to 2010 when many ag markets went parabolic.
Bottom Line:
STOCKS: Hold By early October, sentiment had reset. Several important momentum streaks ended, which has brought in buyers in the past, and seasonality turned positive. We're now seeing signs that sentiment has quickly shifted, especially among options traders. It's gotten to an extreme that has preceded weaker-than-average returns.
BONDS: Hold In late October, sentiment on bonds - from Treasuries to corporates - entered pessimistic territory. It's now starting to recover, with some quick moves in corporate bonds. We'll see if those bonds, in particular, can hold recent gains.
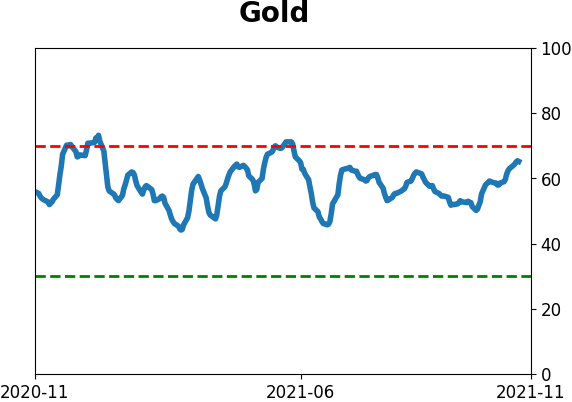
GOLD: Hold
Gold and miners were rejected after trying to recover above their 200-day averages in May. Some oversold extremes in breadth measures among miners triggered in late September, and they've recovered a bit since then. The group still has some proving to do.
|
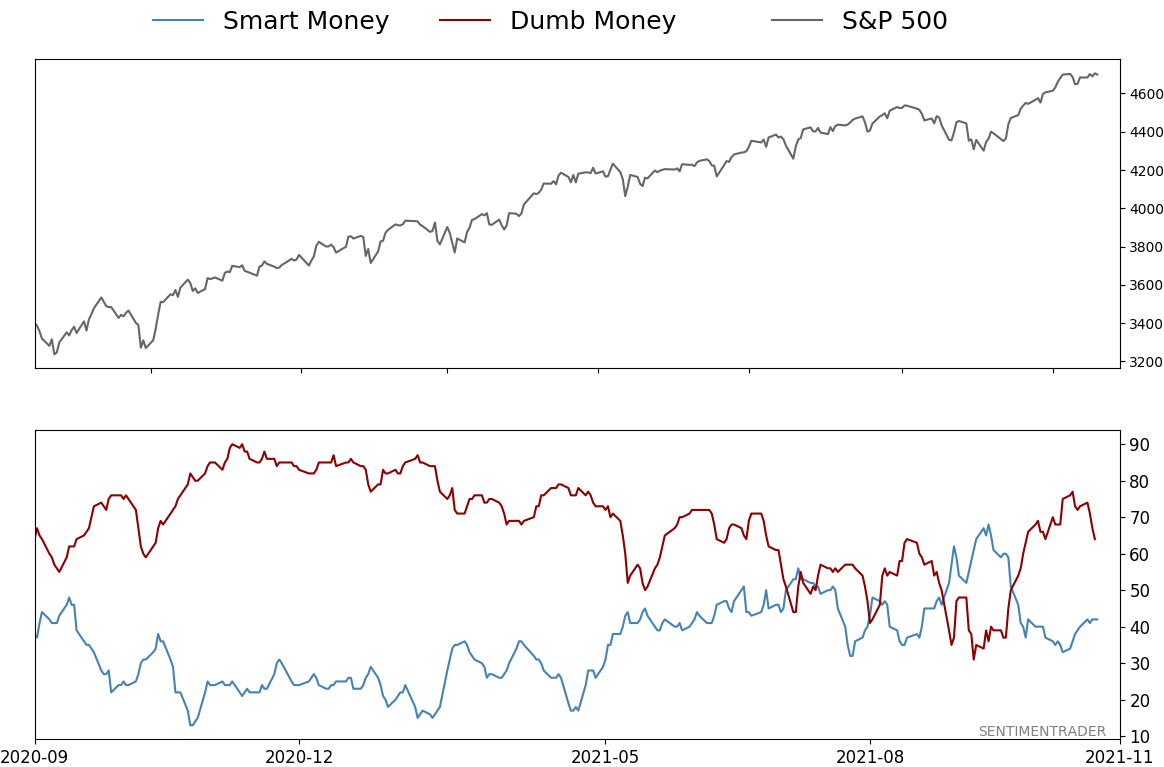
Smart / Dumb Money Confidence
|
Smart Money Confidence: 42%
Dumb Money Confidence: 64%
|
|
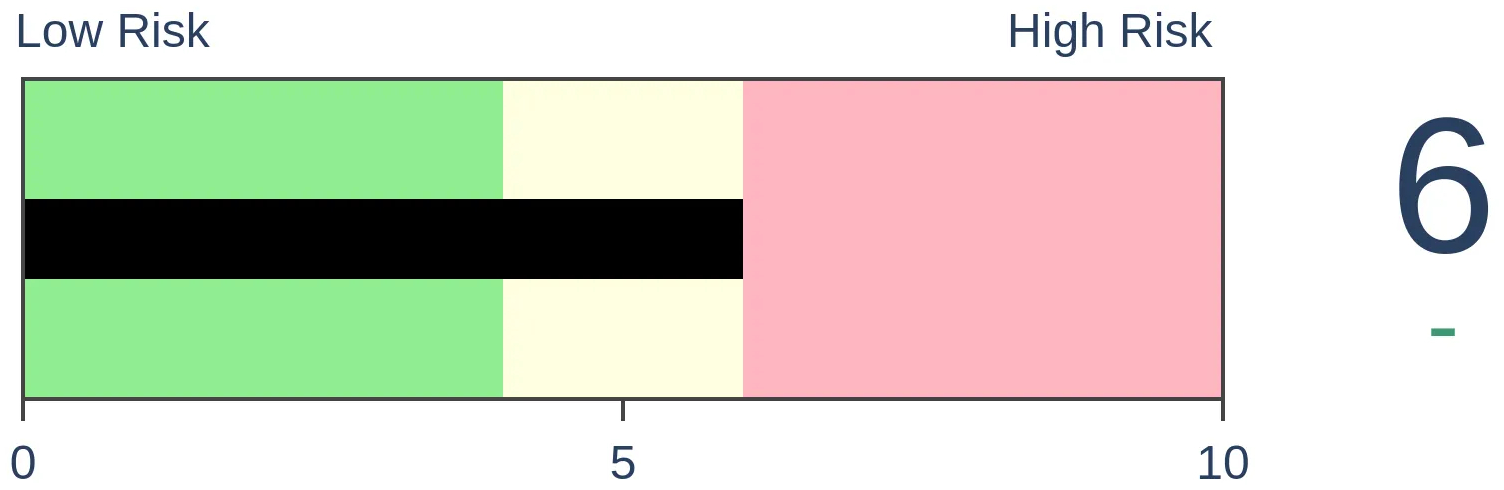
Risk Levels
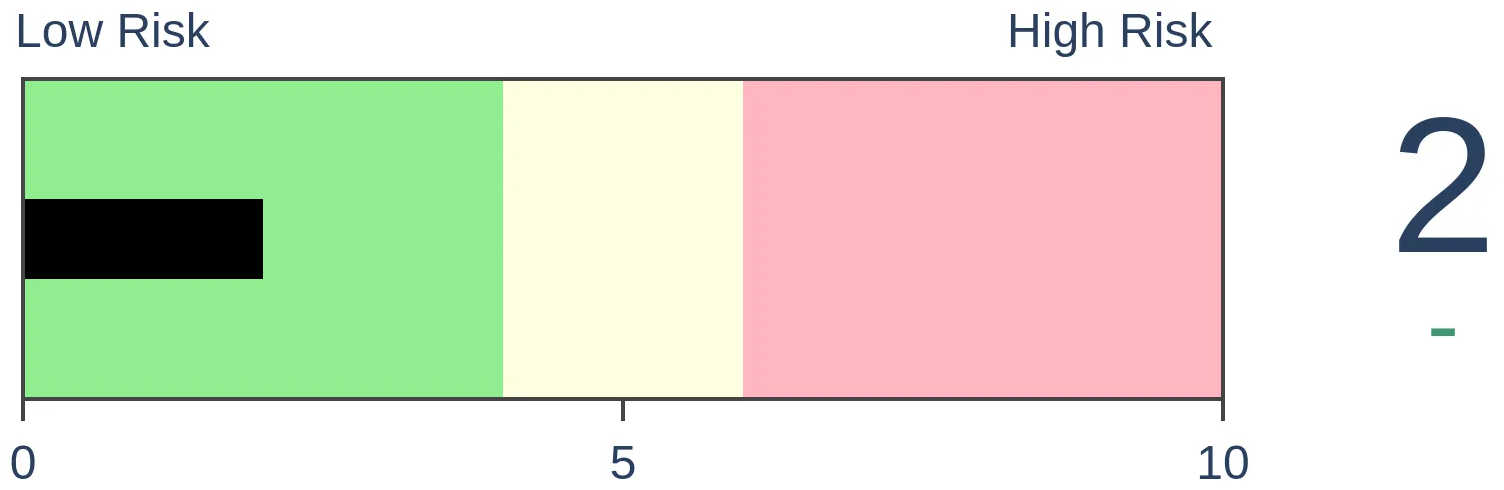
Stocks Short-Term
|
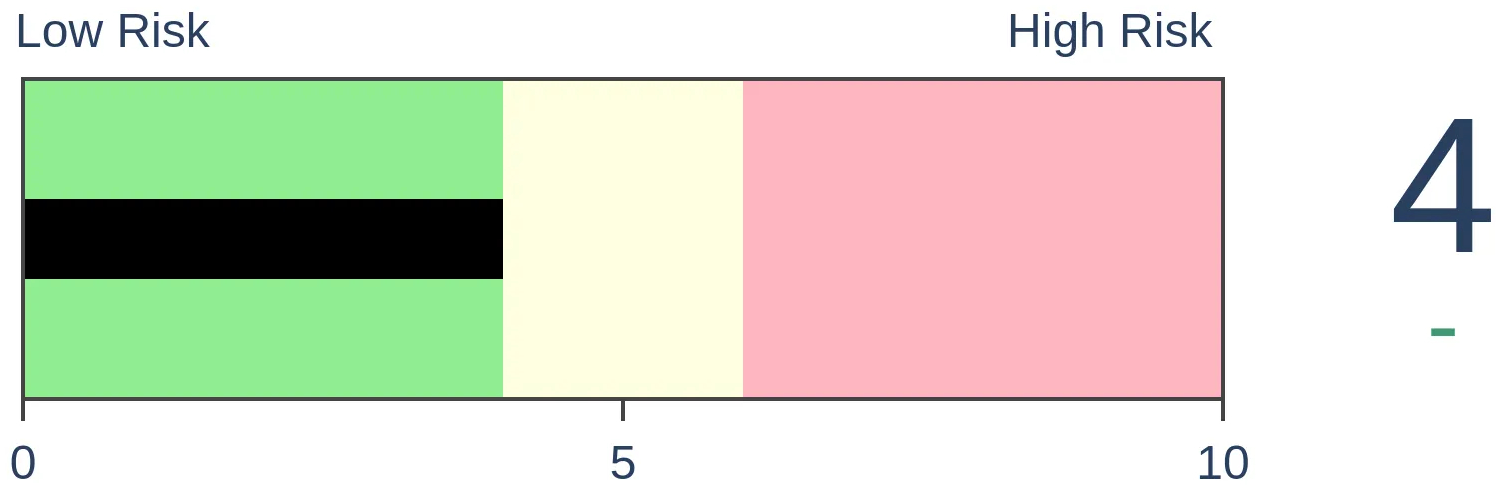
Stocks Medium-Term

|
|
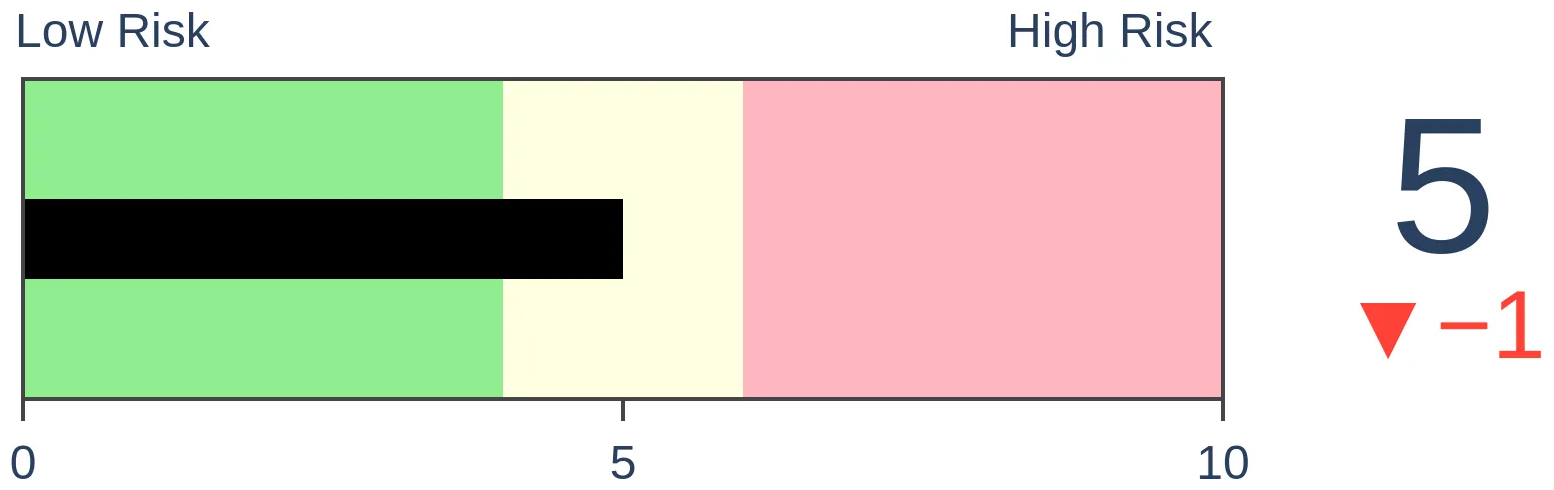
Bonds
|
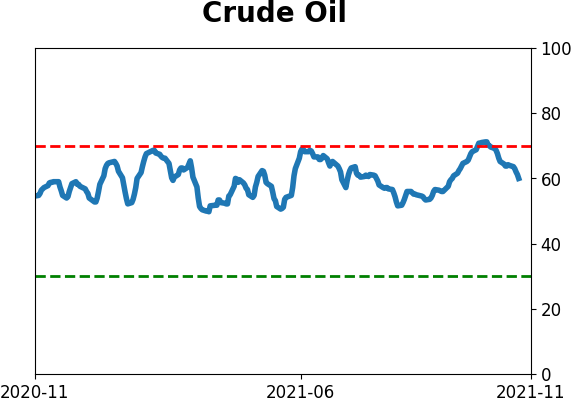
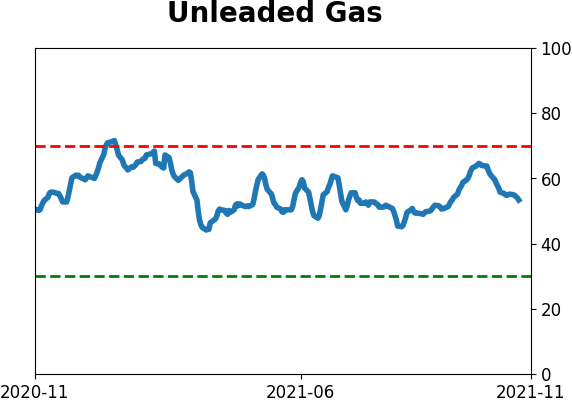
Crude Oil
|
|
Gold
|
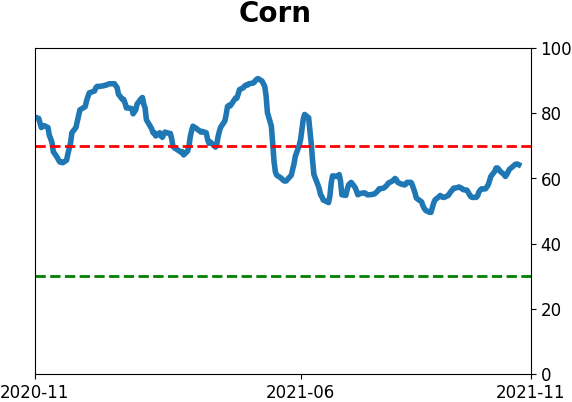
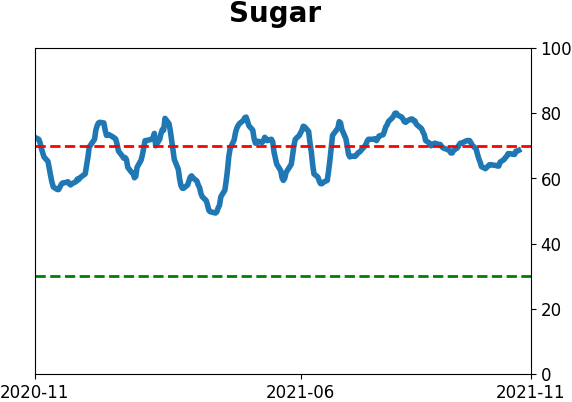
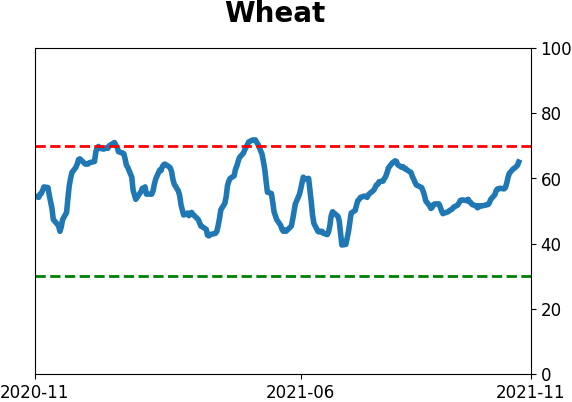
Agriculture

|
|
Research
By Jason Goepfert
BOTTOM LINE
This week, we saw more improvement in some long-term breadth momentum indicators, though very short-term breadth late in the week was very poor. Chinese tech stocks have (mostly) been doing what they should, as insiders buy Materials and Technology. Commodities continue to hold up, even with a rising dollar.
FORECAST / TIMEFRAME
None
|
Key points:
- Chinese tech stocks are going nowhere, which is par for the course
- Internal momentum in the Nasdaq 100 is impressive, and long-term bullish
- Very short-term breadth late this week was very poor, however
- Mid-Cap stocks are nearing a "power period"
- Commodities haven't set a 52-week low for more than 400 days
- They (including gold) are rallying despite a rising dollar
The most-hated section of the equities market is going nowhere
Chinese technology stocks have gone nowhere. And that's precisely what they should be doing.
In September, we looked at the selling cascade in these shares. There was perhaps no corner of the equity market that was more hated or washed-out.
So far, they've done exactly what they're supposed to do by doing nothing at all. Now we can see that over the past 6 months, the selling pressure has been on par with one of the largest financial disasters of all time.
On a longer-term basis, fewer than 15% of the stocks have held above their 200-day moving averages. This average is just now halting its decline and starting to trough, as happened in 2008 and 2011.
When we combined a number of these breadth metrics into a single Composite, it's now rolling over from the 2nd-highest reading in 15 years. After each of the other reversals from similar extremes, the internet index doubled (or nearly so) within 2 years.
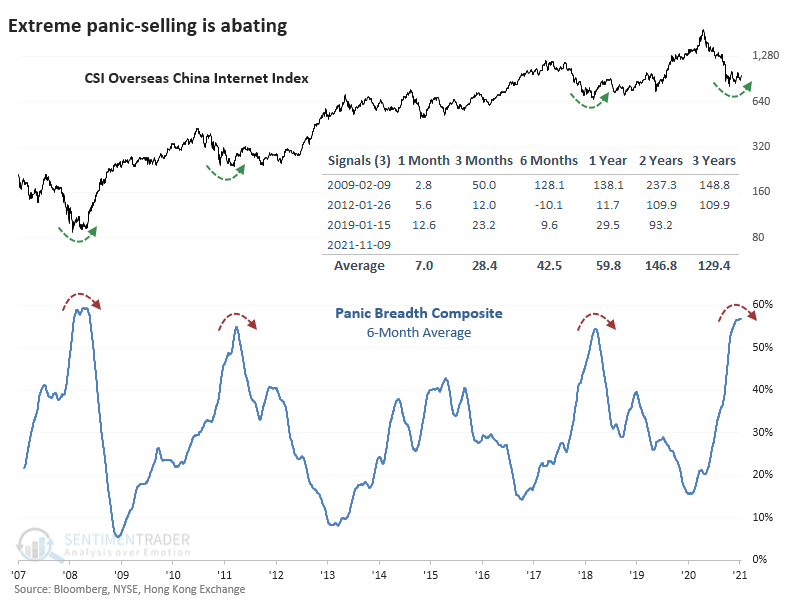
In September, we looked at the path the index took after the only times when more than half of the stocks fell to a 52-week low at the same time. If it followed a similar path this time, then we could have reasonably expected the index to chop around for another 1-3 months, which it has done. The important part was that it shouldn't make an appreciably lower low, which it hasn't.
Big tech is showing good internal momentum
With a reversal in the McClellan Summation Index, we now have an additional signal that suggests that tech stocks can go higher.
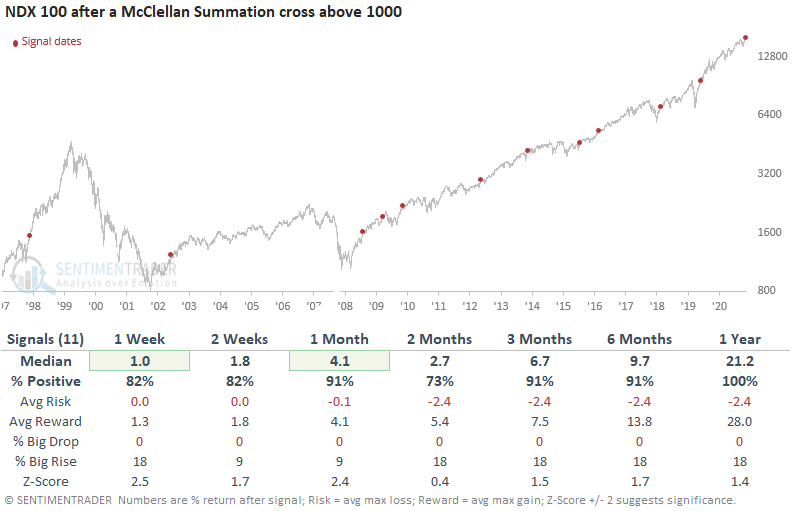
Dean noted that when the McClellan Summation Index crosses above 1000, after a reset below 0 to screen out repeats, Nasdaq 100 performance is excellent.
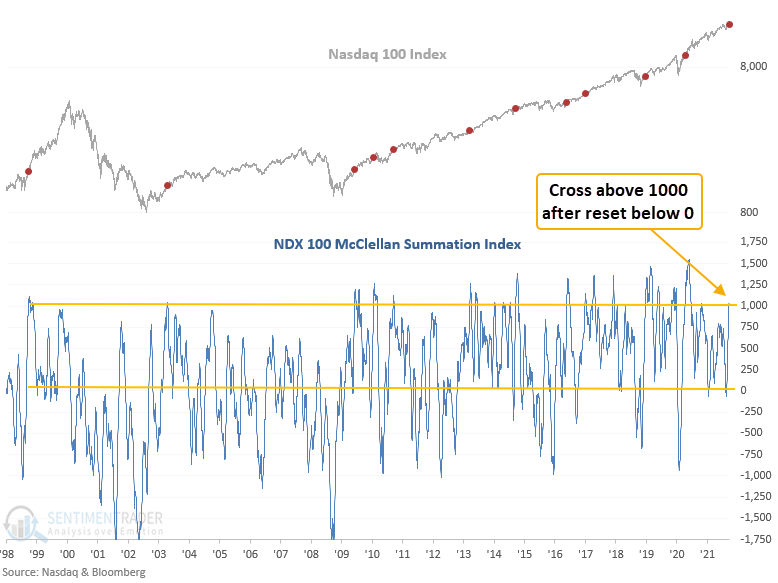
This signal has triggered 11 other times over the past 24 years. After the others, future returns and win rates were excellent across all time frames. A year later, the NDX was higher each time, and drawdowns were nonexistent, with a worst-case scenario of -2.4% in the 2-week time frame.
Later during the week, as major indexes like the S&P 500 and Nasdaq Composite rose to records, breadth was very poor. Dean looked at that, as well, noting that it has preceded short-term weakness (up to 1 month later) most of the time, but also medium-term strength.
The calendar favors Small-Caps
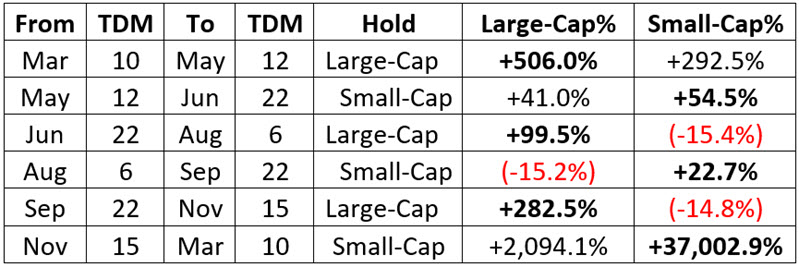
Jay took an in-depth look at a switching strategy between Large-Cap and Small-Cap stocks using the calendar.
The Large-Cap/Small-Cap Calendar works as shown in the table below and uses trading days of the month, not actual calendar days, to trigger a move from one style to the other. "TDM" stands for "Trading Day of Month." The first trading day of each month is "TDM #1", the next day is "TDM #2," and so on.
The switching calendar appears in the table below. Also displayed for each period is the cumulative % performance for large-cap and small-cap indexes during each segment, from 12/31/1952 through 9/30/2021.
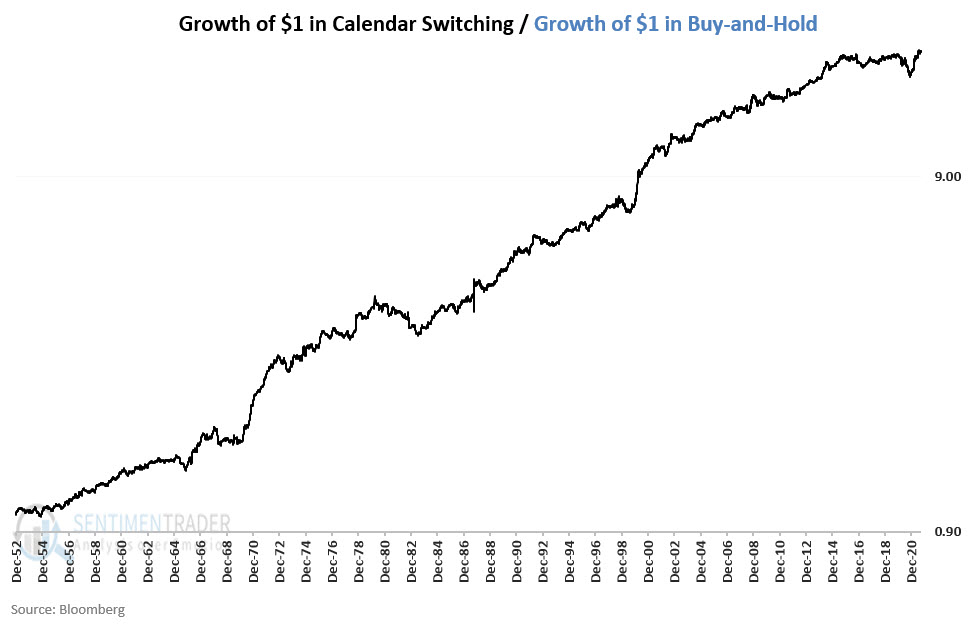
No strategy outperforms all the time, and this one is no exception. There can be periods of up to several years when the calendar switching strategy can underperform buy-and-hold. The chart below displays the performance of the calendar switching strategy versus buy-and-hold performance on a logarithmic scale.
This strategy will switch from large-cap stocks to small-cap stocks on the close of Friday, November 19. This small-cap position will be held until the close of the 10th trading day of March 2022.
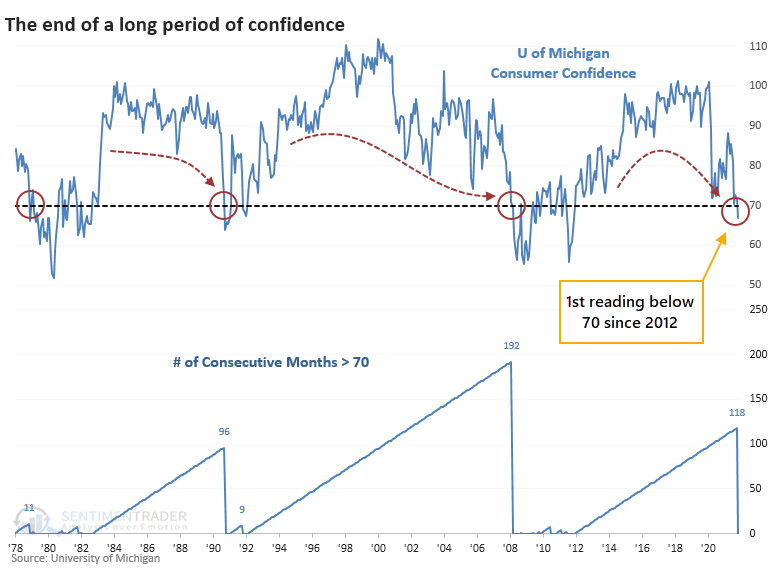
Consumers ain't buying it
The latest survey results from the University of Michigan shocked economists.
For the first time since 2012, the overall level of consumer confidence was below 70, well below even the most negative economist on Wall Street. If it holds up, it would be the worst miss versus expectations in 22 years.
This ended the 2nd-longest stretch of readings above 70 since 1978, assuming the figures don't change appreciably when they are finalized at the end of the month.
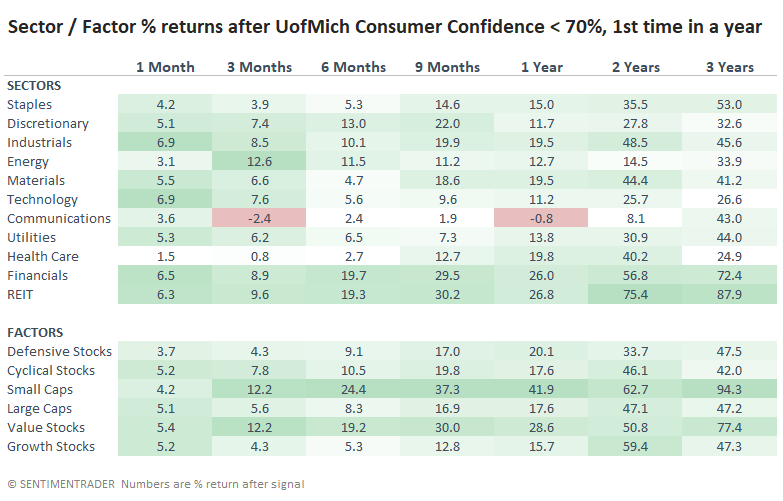
We all know the difficulty of relying on a sample size of 3, so the caveats are huge. It doesn't help that there was no real consensus on future market returns after the other instances, with a couple of big gains and one big loss. The 1978 and 1990 drops in sentiment preceded gains of more than 35% in the S&P 500 over the next couple of years. The 2008 signal was near the beginning of the Global Financial Crisis (GFC) and major losses.
Among sectors and factors, the bear market of 2008 knocked everything for a loop. The strongest returns (darkest green shading) favored Small-Cap and Value stocks across most time frames.
Mid-Caps are nearing a "power period" too
Jay pointed out that the often-overlooked Mid-Cap section of the stock market is about to enter a "power period."
The period we will examine is the last six trading days of November plus the first three trading days of December for the S&P 400 index. The chart below shows the cumulative growth of $1 invested in the S&P 400 Index (price-performance only) every year during the power period since the index began in 1981.
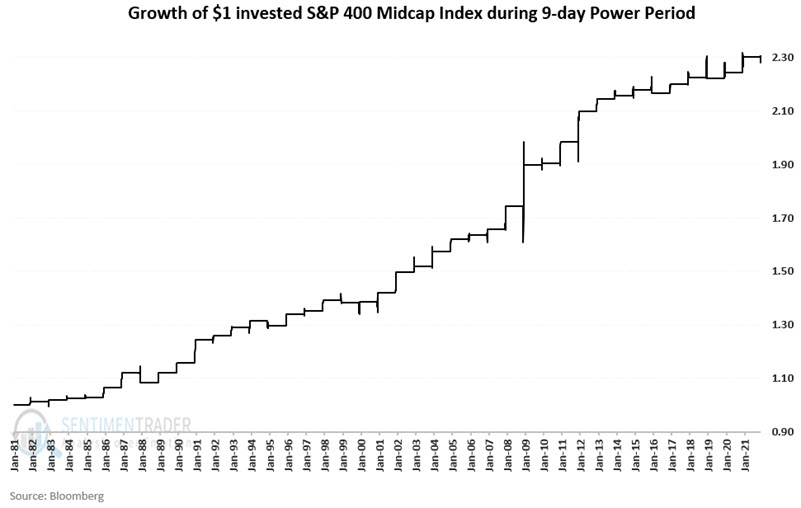
Traders can employ this strategy using IJH (iShares Core S&P Mid-Cap ETF) or MDY (SPDR S&P MIDCAP 400 ETF Trust) to track the S&P 400 Midcap Index.
For 2021, this period will extend from the close on 11/19/2021 through the close on 12/3/2021.
Commodities have been trucking along
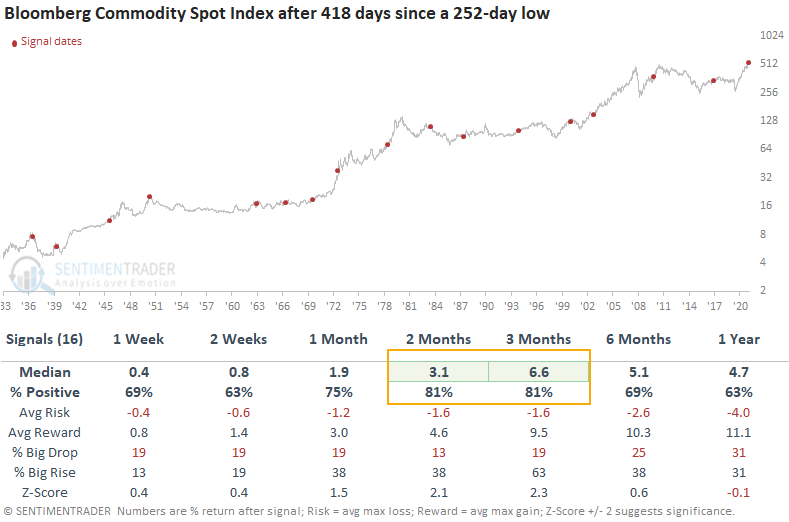
The Bloomberg Commodity Spot Index plunged to a 3-year low in March 2020 and hasn't looked back since. It has now doubled from that low, with its bull market run lasting more than 400 days and counting.
Dean showed that the last time this commodity index went more than 400 days without setting a 1-year low was September 2017, leading to an additional 8 months of higher commodity prices.
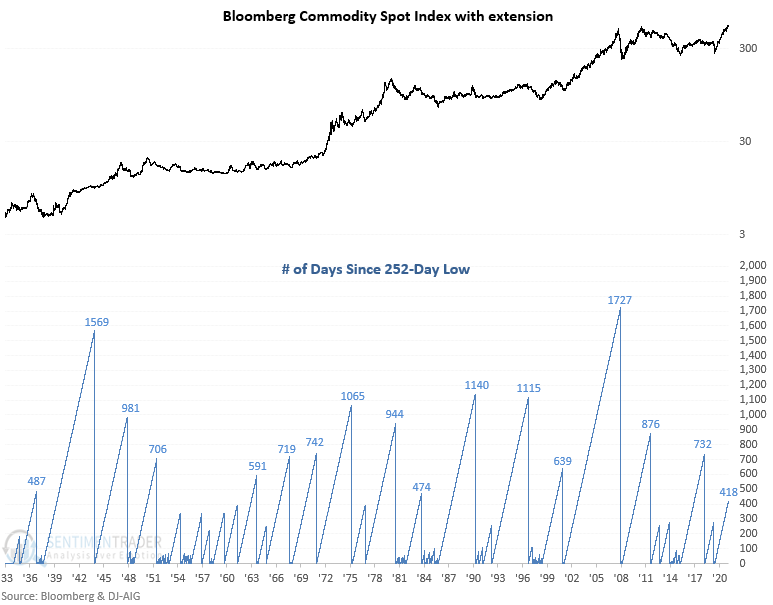
A similar signal has triggered 16 other times over the past 85 years. After the others, future returns and win rates were strong across medium-term time frames. And, the three drawdowns in the 2-month window were all less than 4.2%.
Gold is trucking too, even with a rising dollar
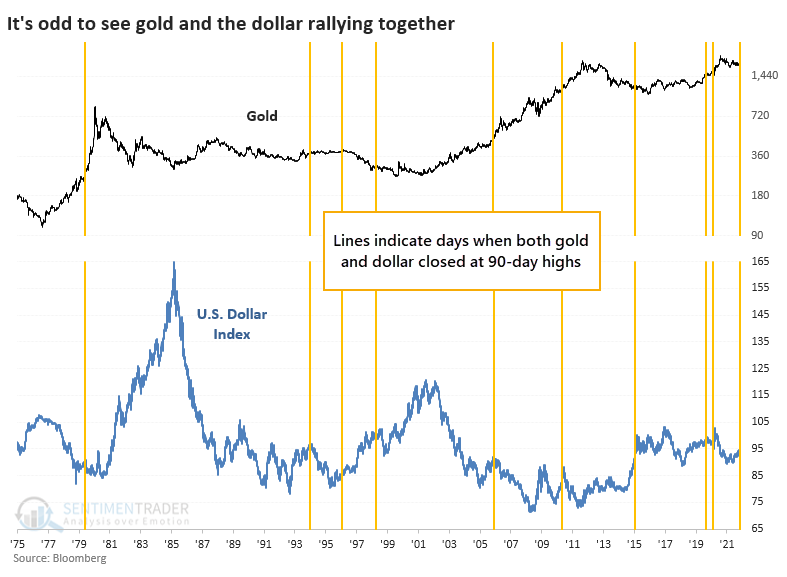
A highly unusual circumstance we're seeing now is that gold is breaking out along with the dollar. In recent days, both markets have been hitting their highest levels in at least 90 days.
Since 1975, there has been a correlation of -0.31 (on a scale of -1.0 to +1.0) between daily changes in gold and the dollar. The correlation generally gets more negative as you expand the time frame. There have only been 9 other times when both markets hit a 90-day high at the same time.
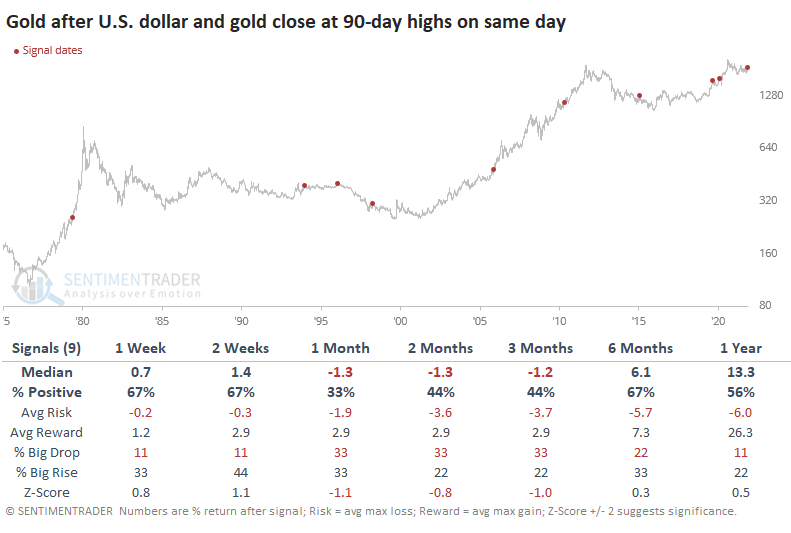
One might think that this would be wildly bullish for gold because it's shrugging off a historical relationship; one would be wrong. While gold's returns over the next 6-12 months were positive, better than random, and with a decent risk/reward profile (over the next year, anyway), it struggled to hold gains during the next 1-3 months.
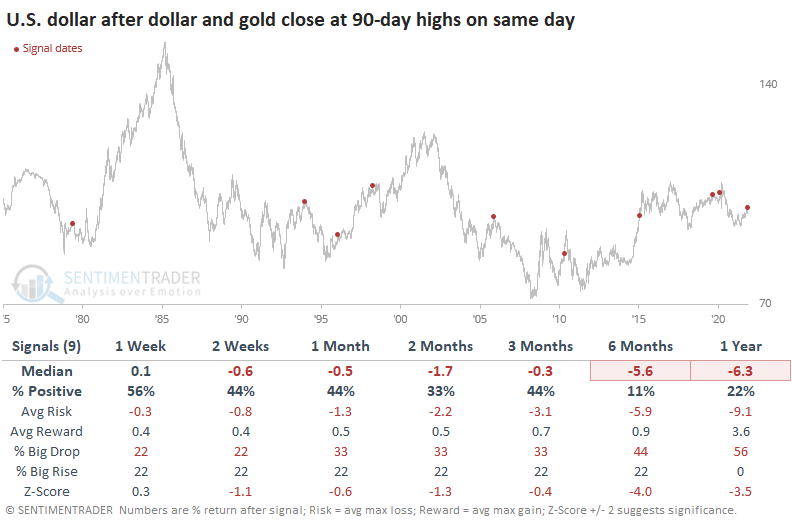
It was even worse for the dollar as the buck lost ground on most time frames. Only one signal, from 2015, showed a positive return across all of them. The dollar's horrid performance over the next 6-12 months helps explain gold's mostly positive returns.
Other indicators like commercial hedger positions in the dollar, Social Sentiment on the GLD fund, ETF asset flows, and overall sentiment levels, suggest decent long-term prospects for the yellow metal.
Gold has had difficulty holding buying interest over the past year, and other times it shrugged off a rising dollar didn't help matters much. It can be dangerous to get too cute about how prices should behave, but since this market tends to settle back a bit after a surge and within an unfavorable seasonal window until mid-December, it would make sense if it pulled back. But most signs point to that potential as being a wiggle within what should be a longer uptrend.
Retail sales should be a good sign
The Retail Sales Report came out this week, and the retail sector responded well to it.
Dean assessed the outlook for the S&P 1500 retail industry group when the index closes up 1% or more and outperforms the S&P 500 index by 0.50% or more on a retail sales report day.
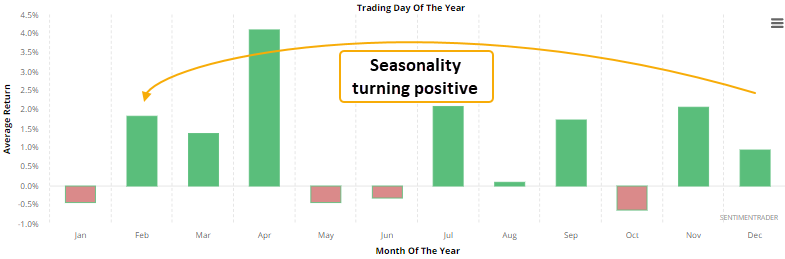
This signal has triggered 30 other times over the past 21 years. After the others, future returns and win rates were above historical averages across almost every time frame. With retail seasonality about to turn positive, he also looked at the outlook when the signal triggers in November or December.
This signal has occurred 7 other times over the past 24 years. After the others, future returns and win rates were solid across all time frames except the first week. If we look at returns for all periods less than a year, we see drawdowns were minimal, with a worst-case scenario of -4.0% over the next 2 months.
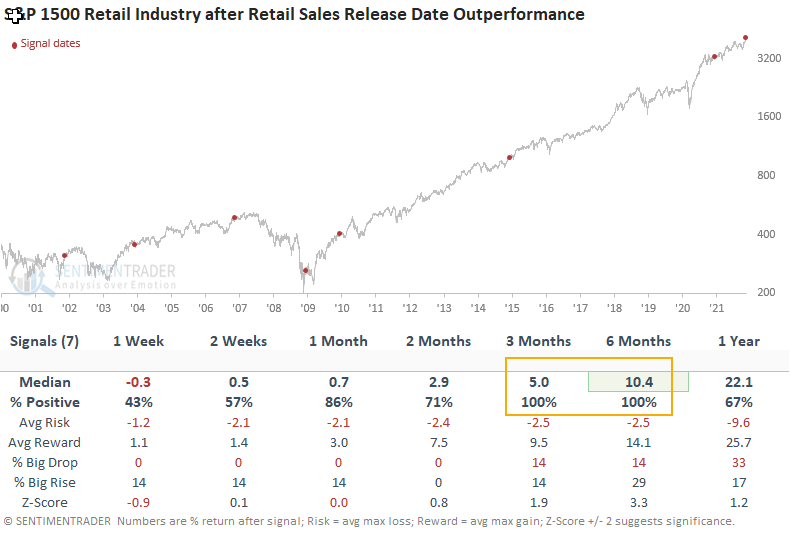
When retail stocks outperform on a day when retail sales are reported, future returns and consistency are above historical averages. When this happened in November or December, retailers showed a 100% win rate 3 and 6 months later.
About the Weekly Wrap...
The goal of the Weekly Wrap is to summarize our recent research. Some of it includes premium content (underlined links), but we're highlighting the key focus of the research for all. Sometimes there is a lot to digest, with this summary meant to highlight the highest conviction ideas we discussed. Tags will show any symbols and time frames related to the research.
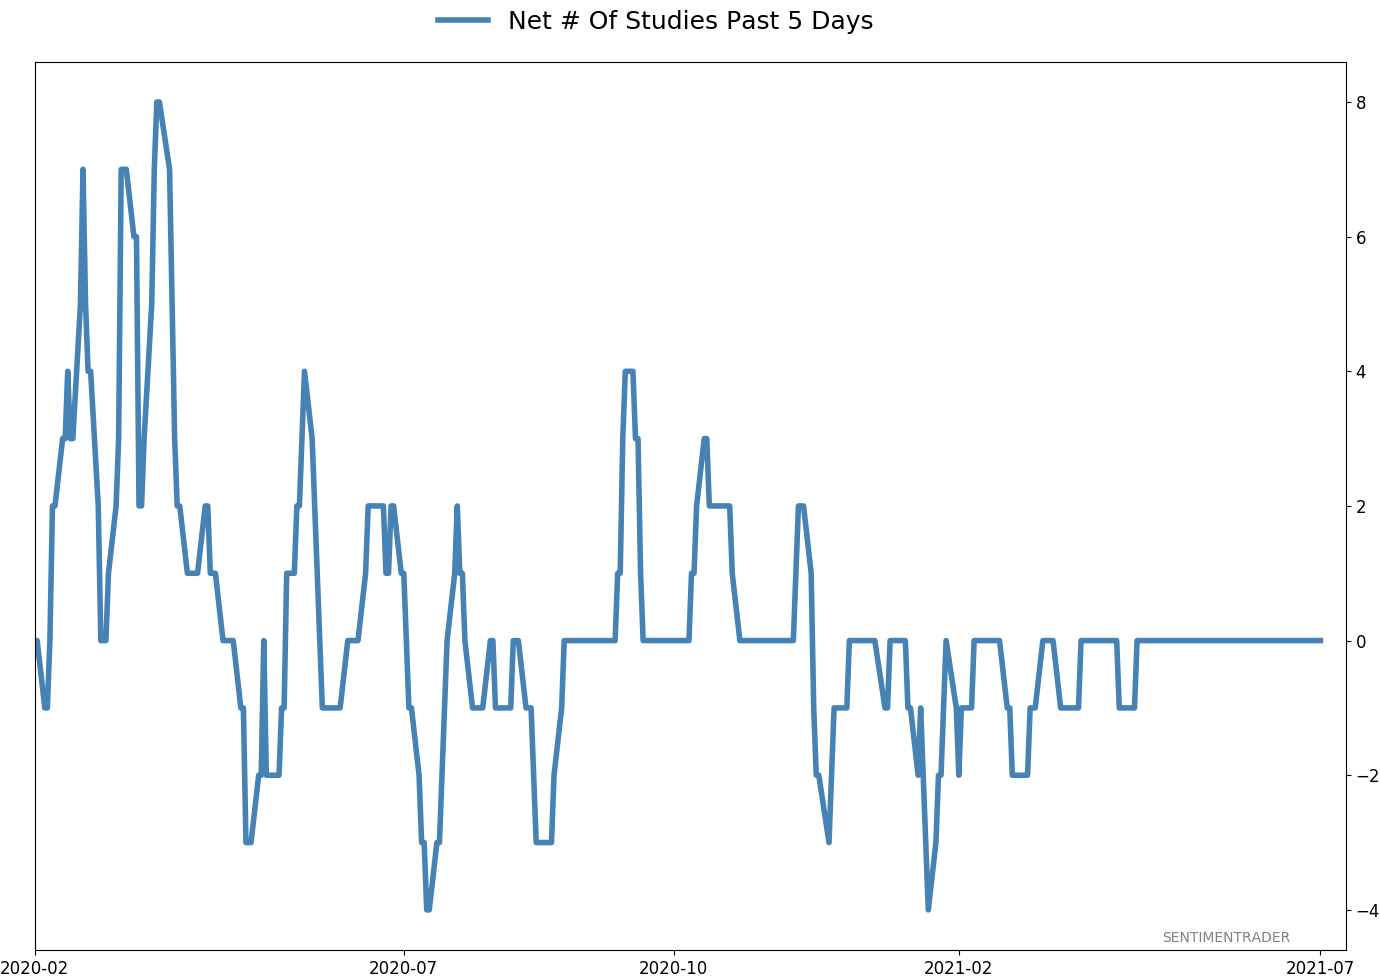
Active Studies
| Time Frame | Bullish | Bearish | | Short-Term | 2 | 0 | | Medium-Term | 11 | 0 | | Long-Term | 13 | 6 |
|
Indicators at Extremes
Portfolio
| Position | Description | Weight % | Added / Reduced | Date | | Stocks | RSP | 10.7 | Added 6.4% | 2021-10-01 | | Bonds | 32.7% BND, 7.1% SCHP | 39.8 | Added 8.3% | 2021-10-26 | | Commodities | GCC | 2.4 | Reduced 2.1%
| 2020-09-04 | | Precious Metals | GDX | 4.6 | Reduced 4.2% | 2021-05-19 | | Special Situations | 9.8% KWEB, 4.7% XLE, 2.9% PSCE | 17.3 | Added 9.78% | 2021-10-01 | | Cash | | 24.1 | | |
|
Updates (Changes made today are underlined)
Much of our momentum and trend work has remained positive for several months, with some scattered exceptions. Almost all sentiment-related work has shown a poor risk/reward ratio for stocks, especially as speculation drove to record highs in exuberance in February. Much of that has worn off, and most of our models are back toward neutral levels. There isn't much to be excited about here. The same goes for bonds and even gold. Gold has been performing well lately and is back above long-term trend lines. The issue is that it has a poor record of holding onto gains when attempting a long-term trend change like this, so we'll take a wait-and-see approach. Momentum has ebbed quickly in recent weeks, and nearing oversold levels in some indicators. This can be a dangerous area, with a lot of short-term volatility, but we'd be more inclined to add medium- to long-term exposure rather than sell on much more of a decline, thanks to already rock-bottom exposure. Other areas look more attractive, including some overseas markets. RETURN YTD: 11.3% 2020: 8.1%, 2019: 12.6%, 2018: 0.6%, 2017: 3.8%, 2016: 17.1%, 2015: 9.2%, 2014: 14.5%, 2013: 2.2%, 2012: 10.8%, 2011: 16.5%, 2010: 15.3%, 2009: 23.9%, 2008: 16.2%, 2007: 7.8%
|
|
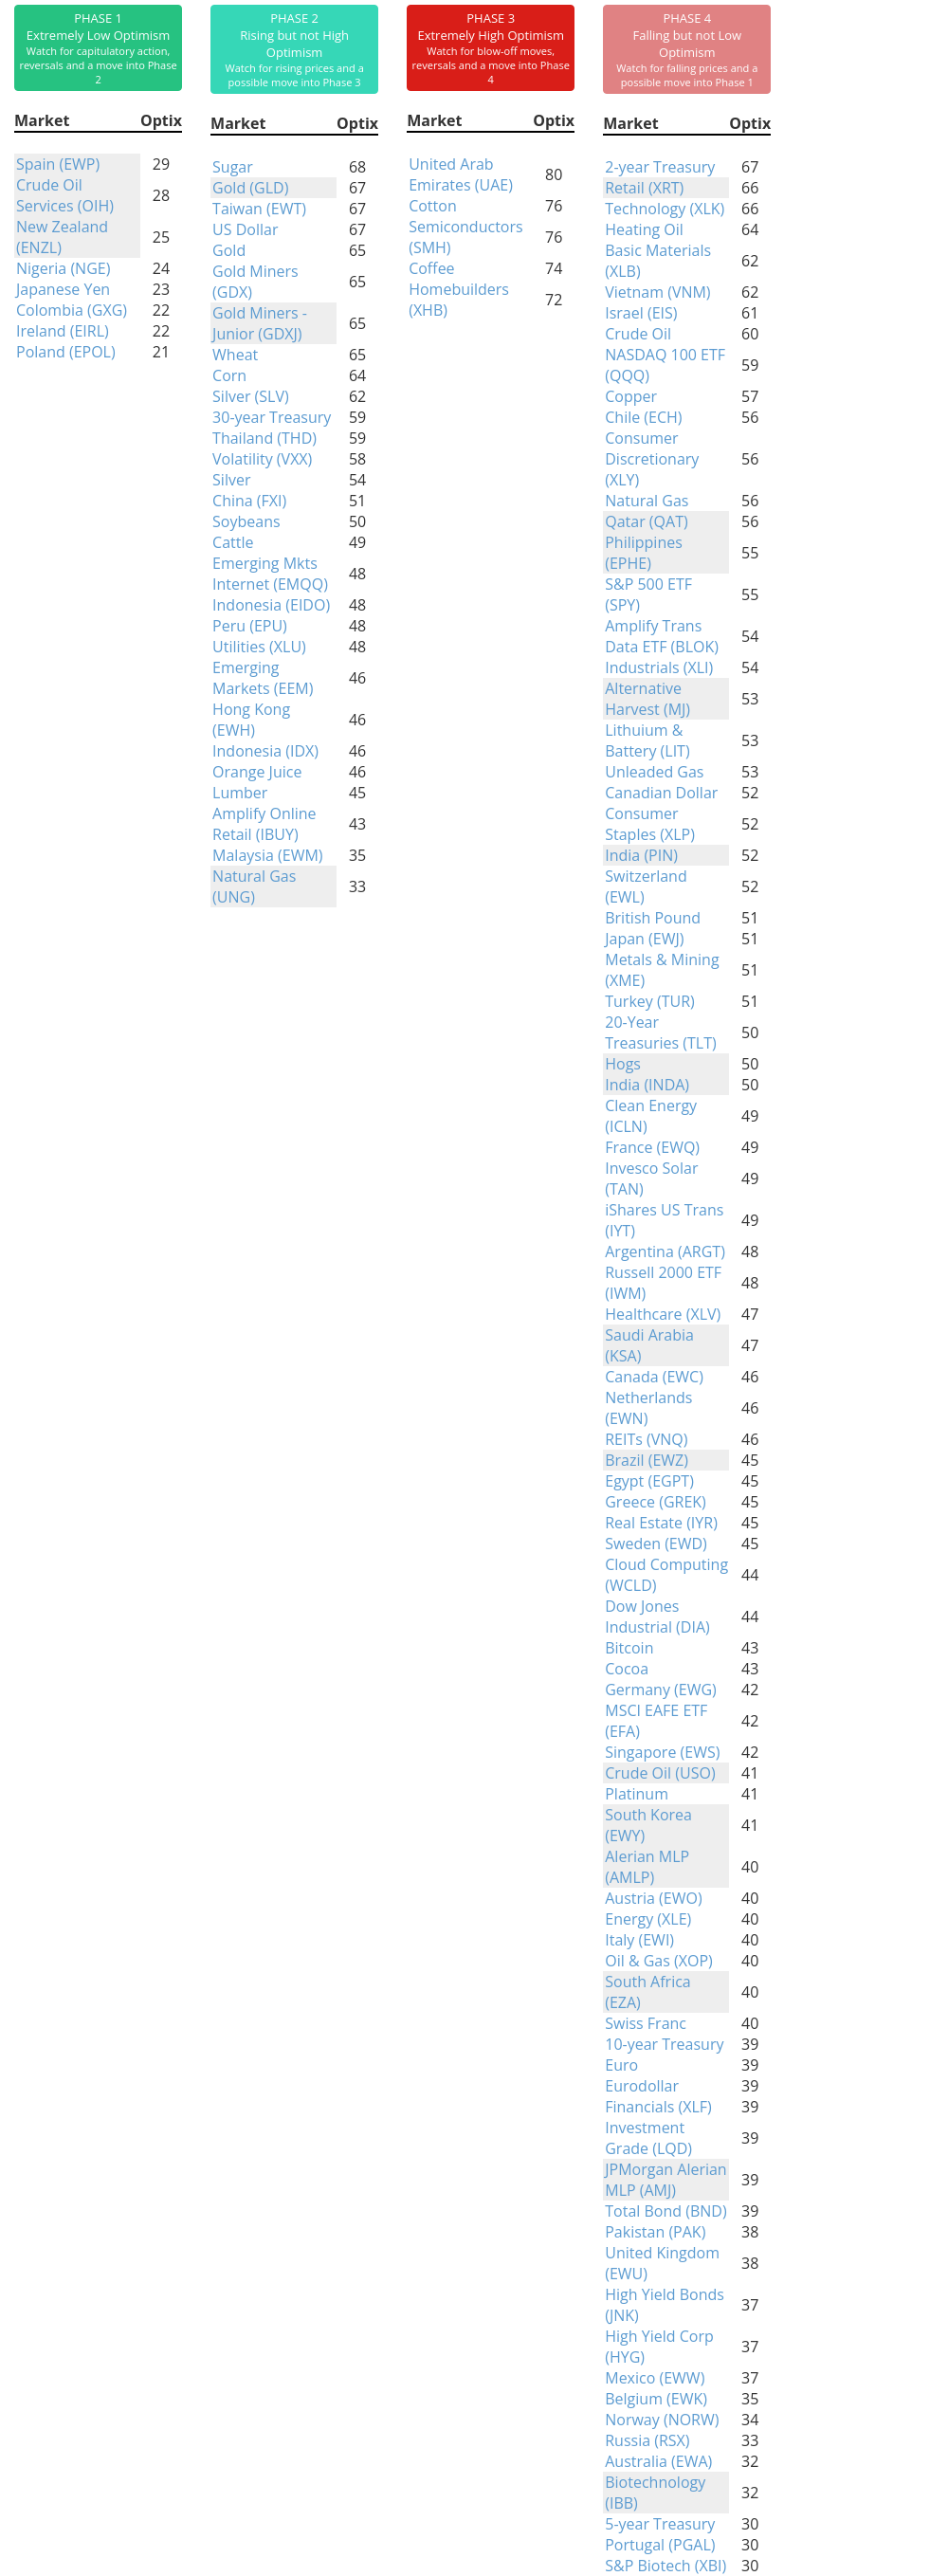
Phase Table
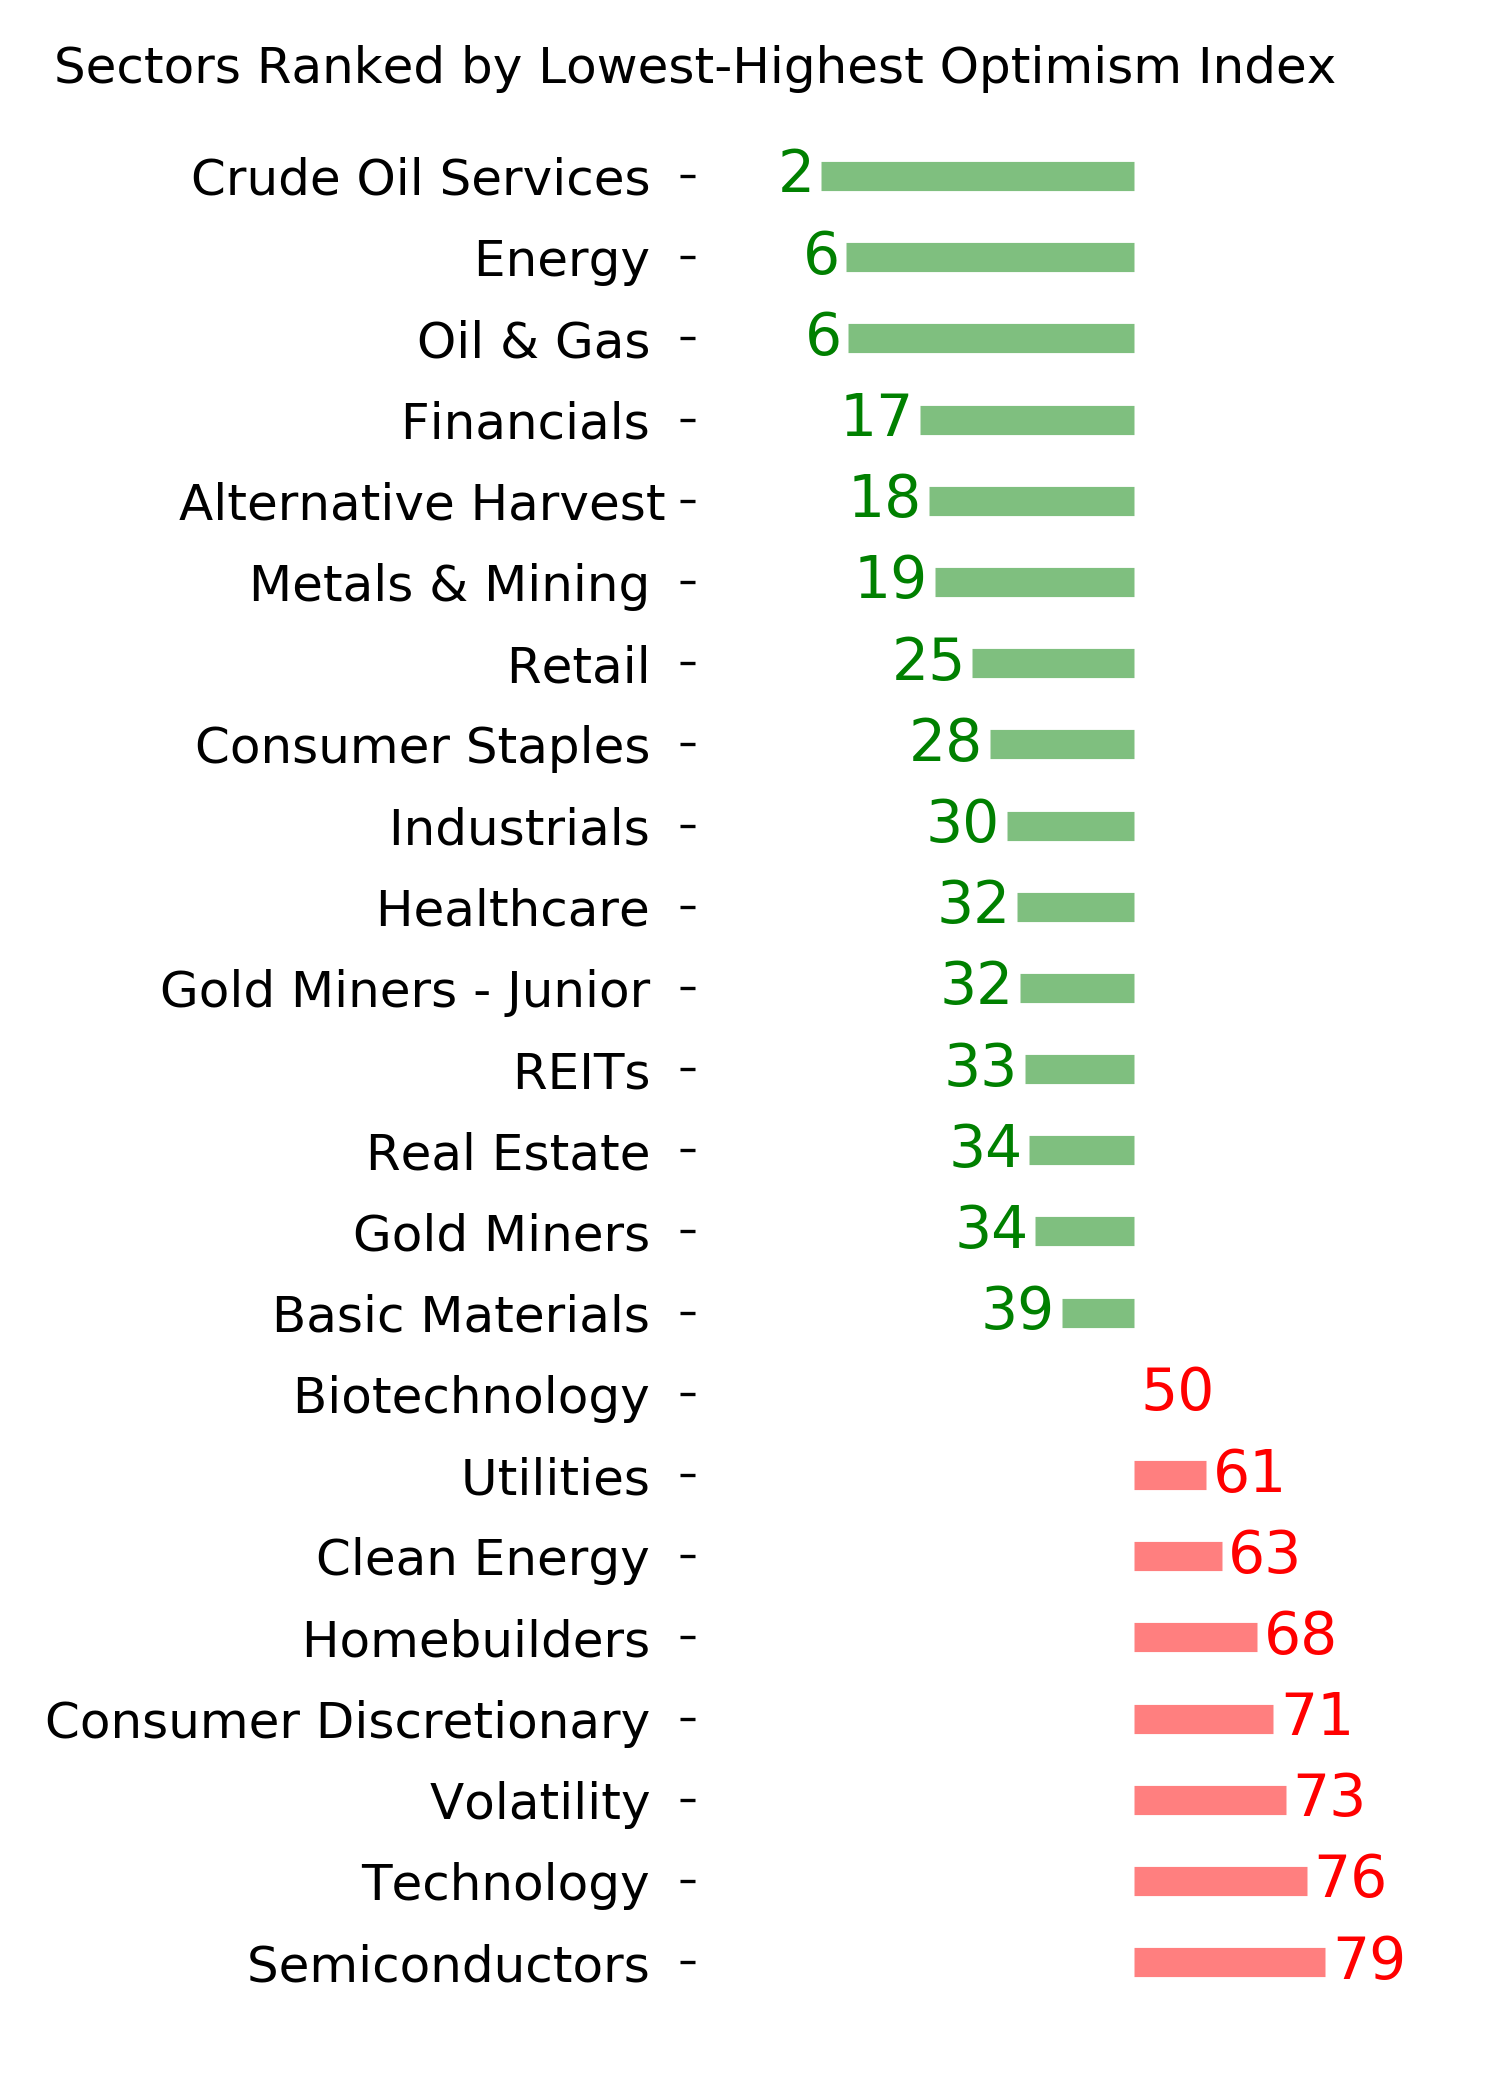
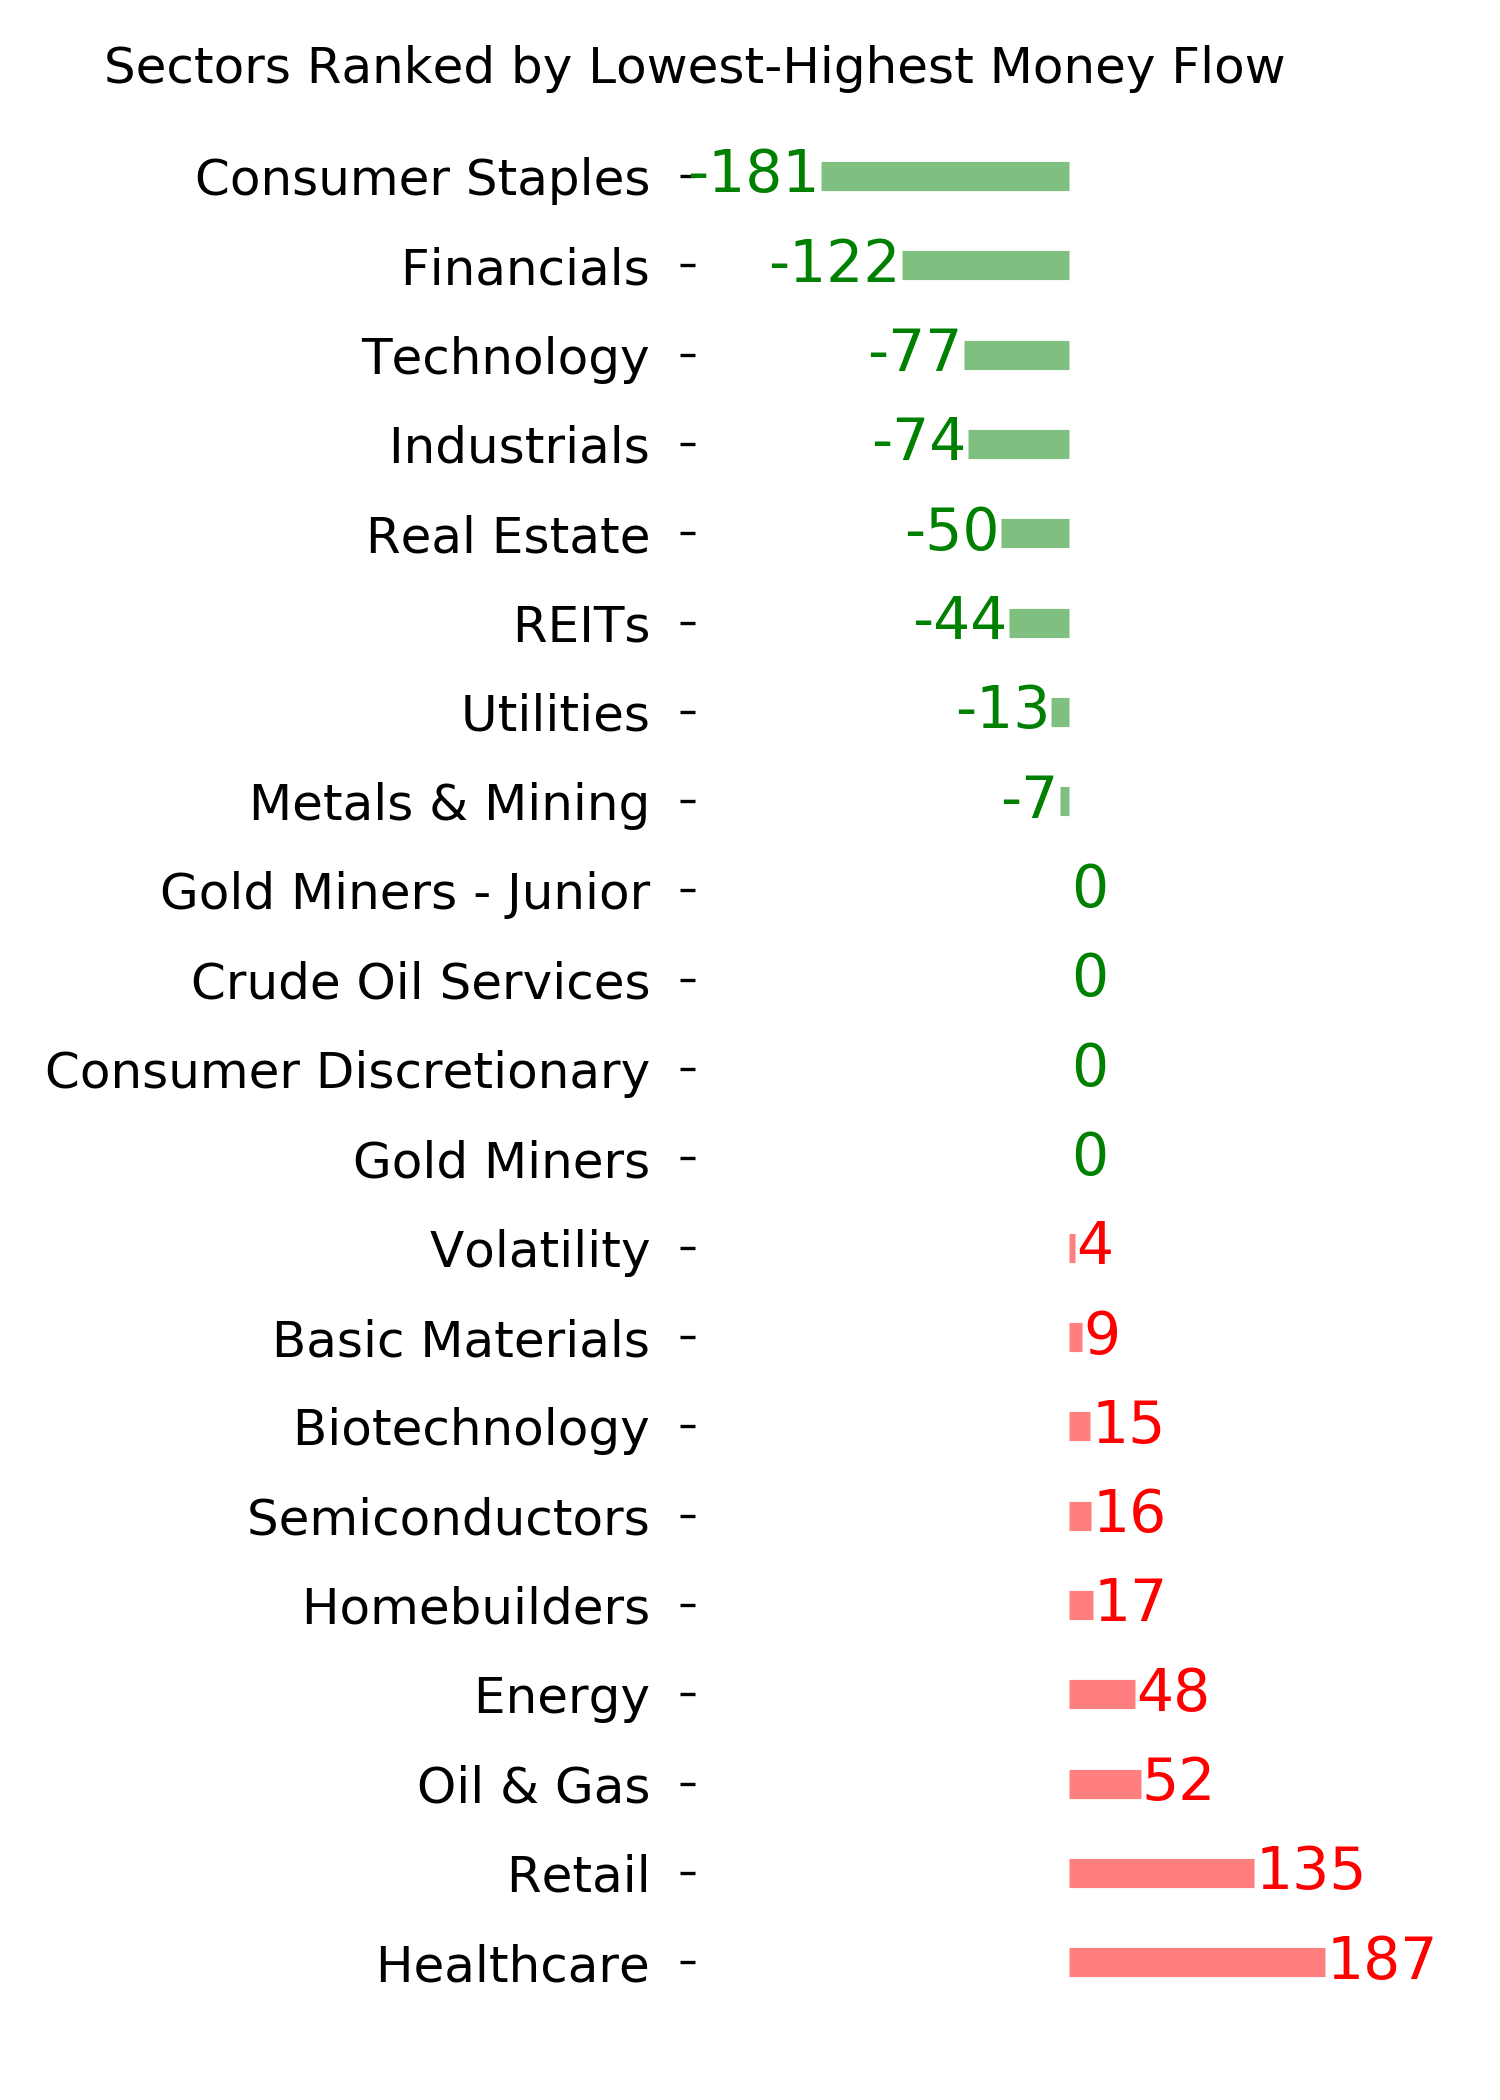
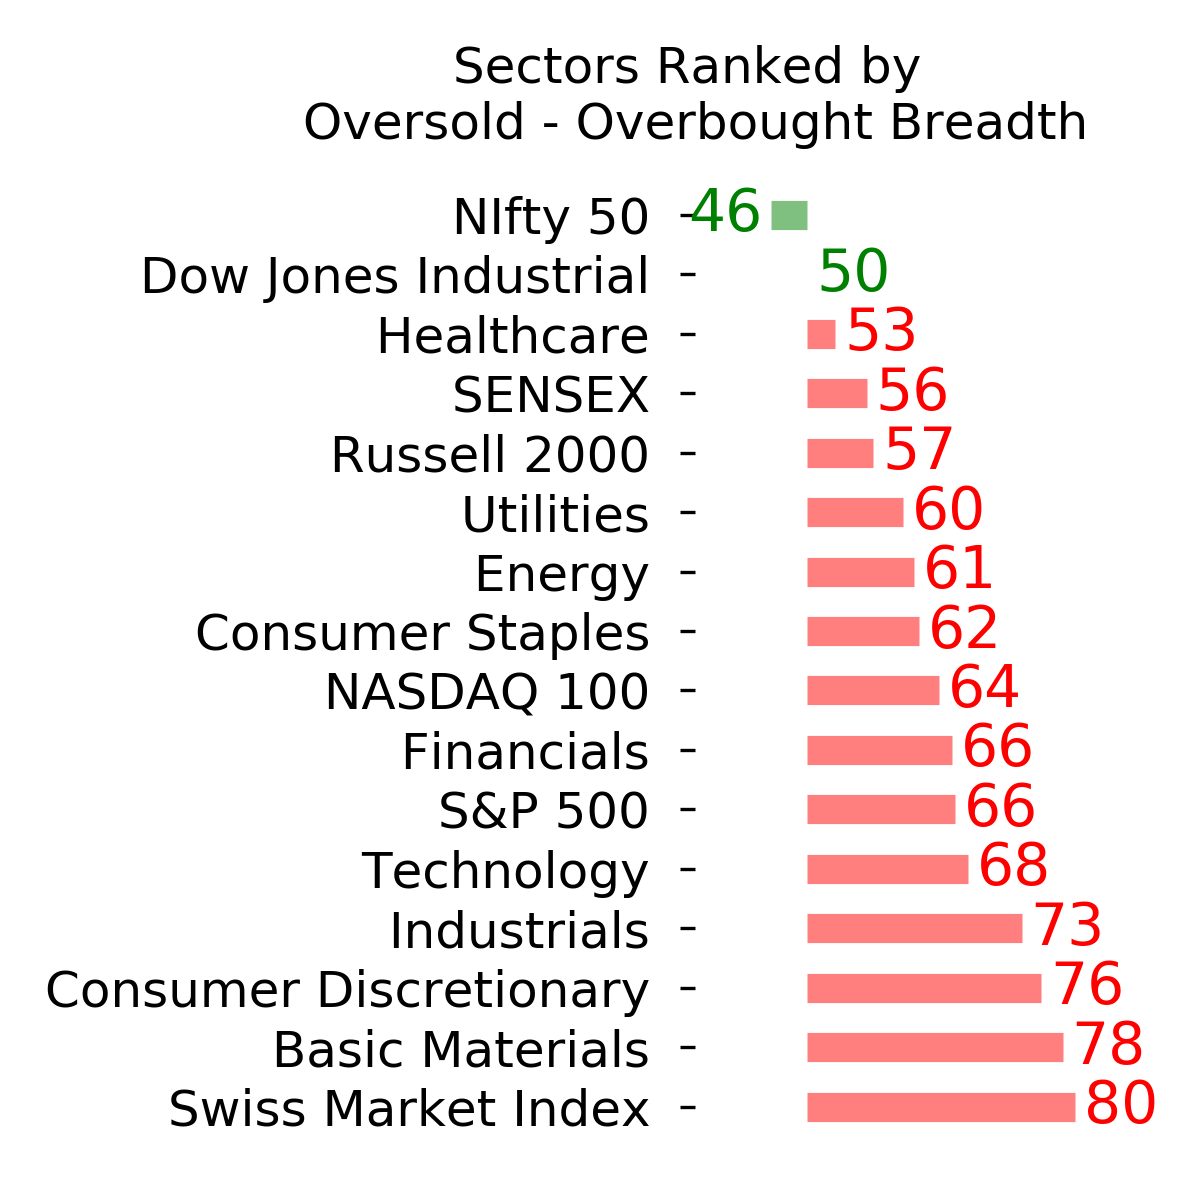
Ranks
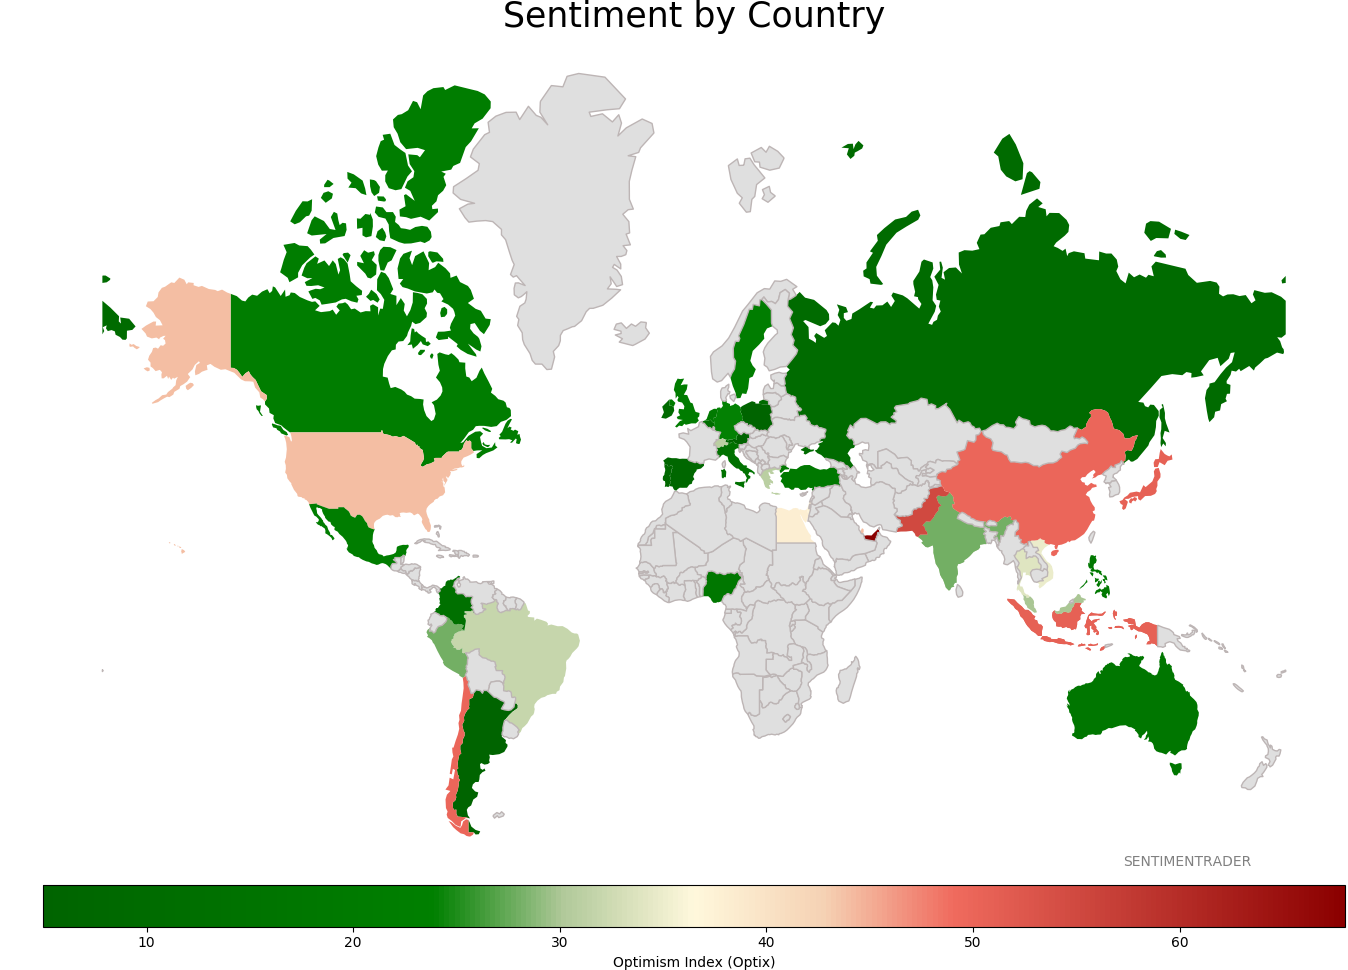
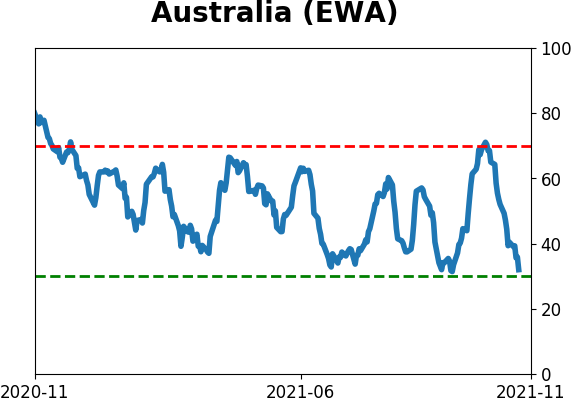
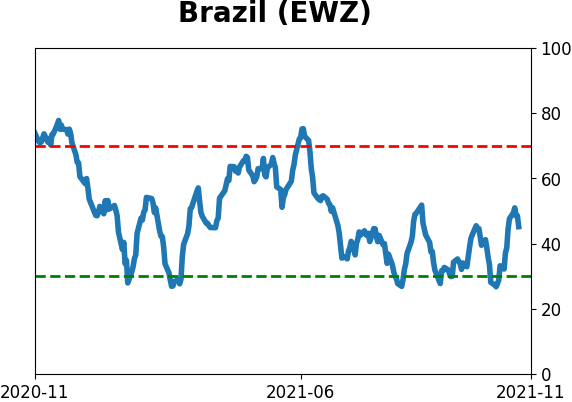
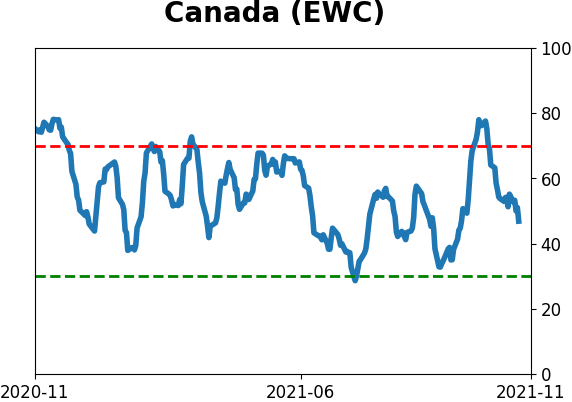
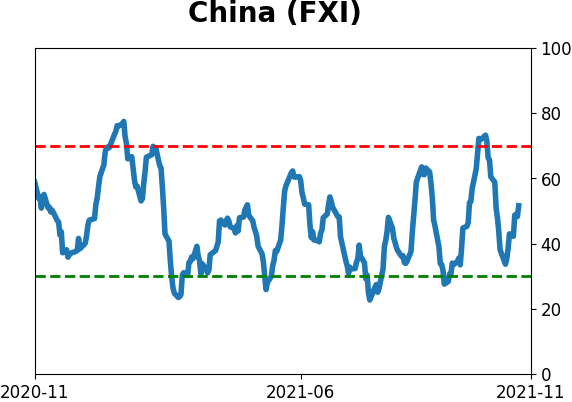
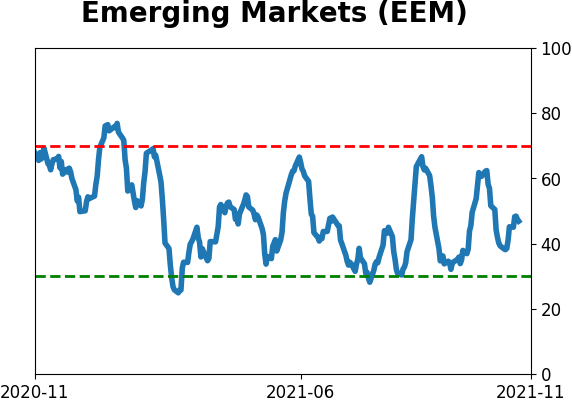
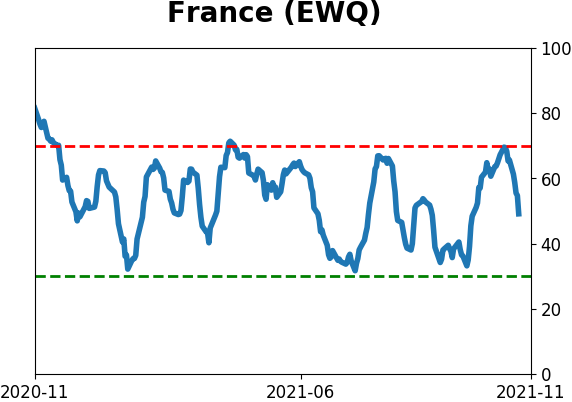
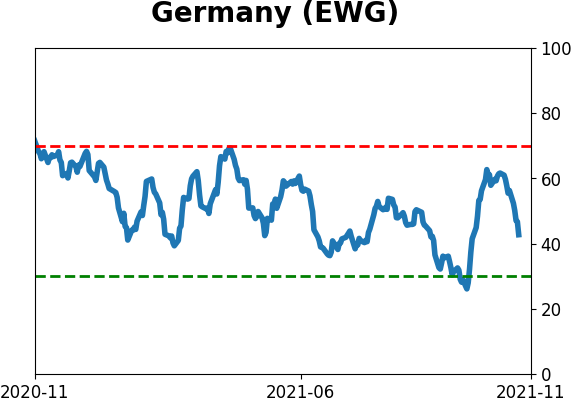
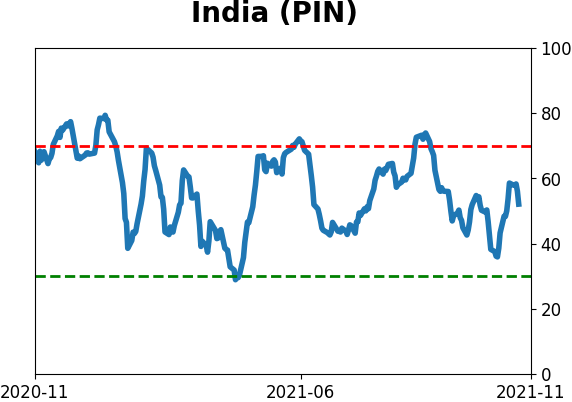
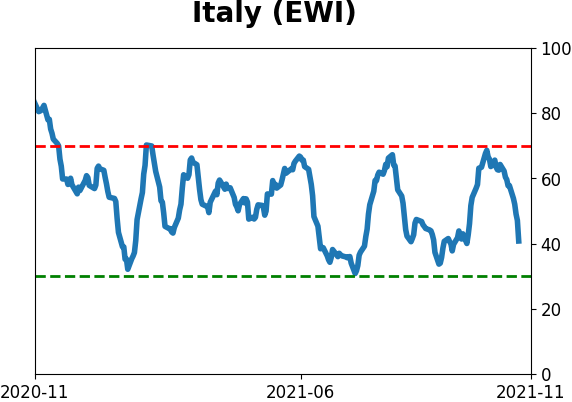
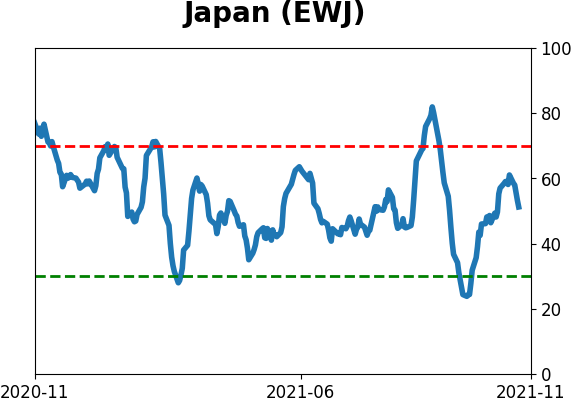
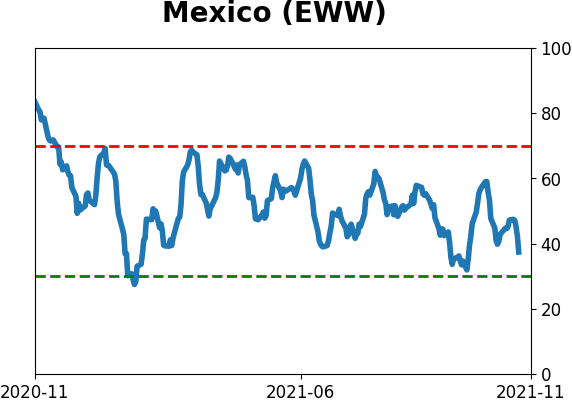
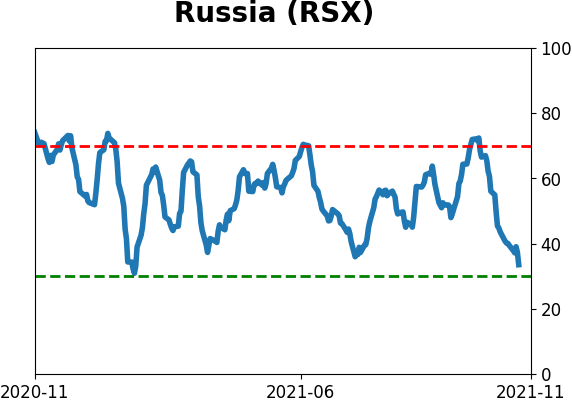
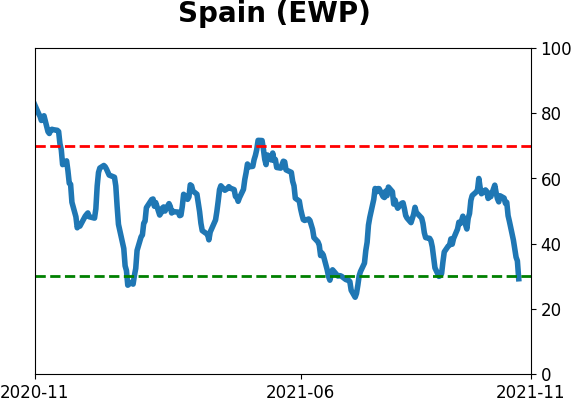
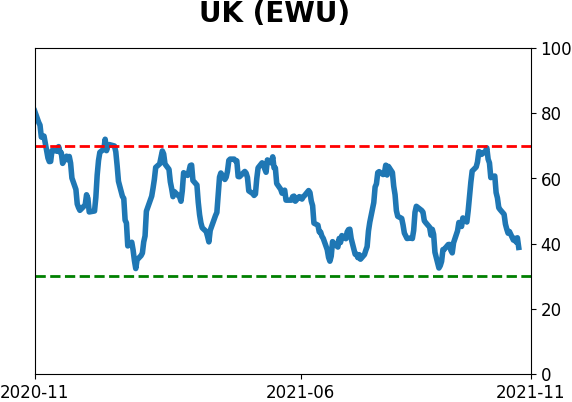
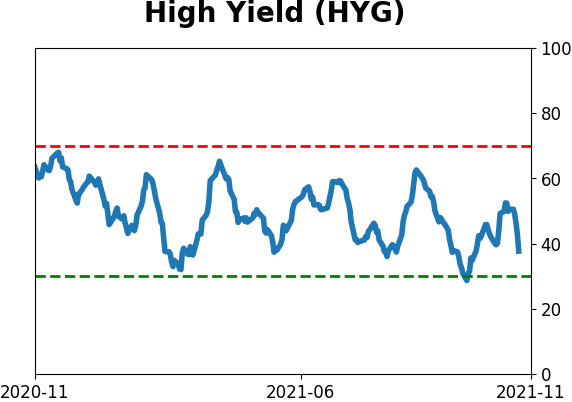
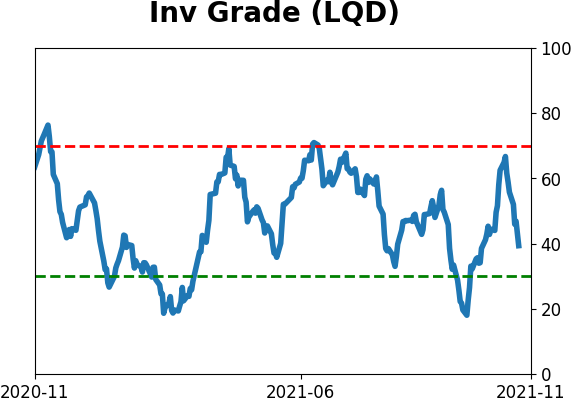
Sentiment Around The World
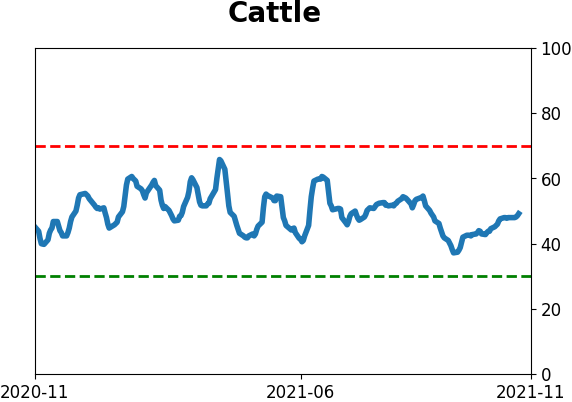
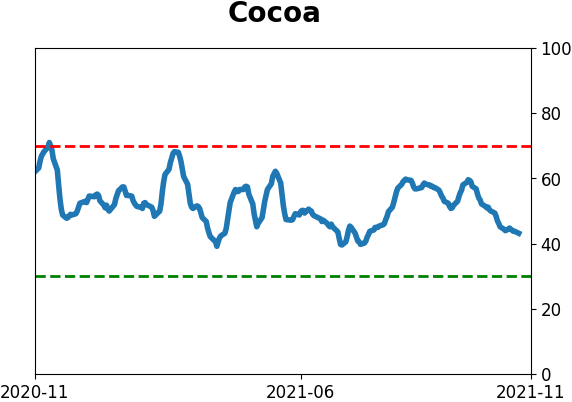
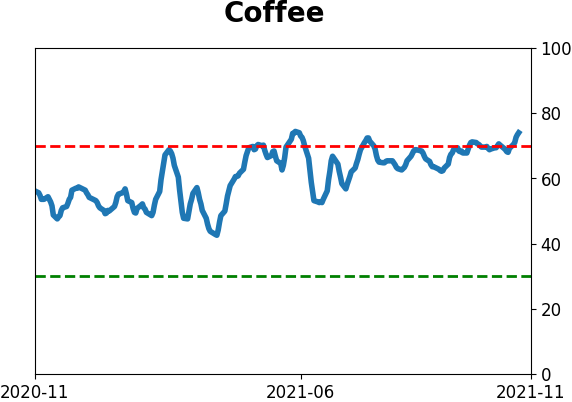
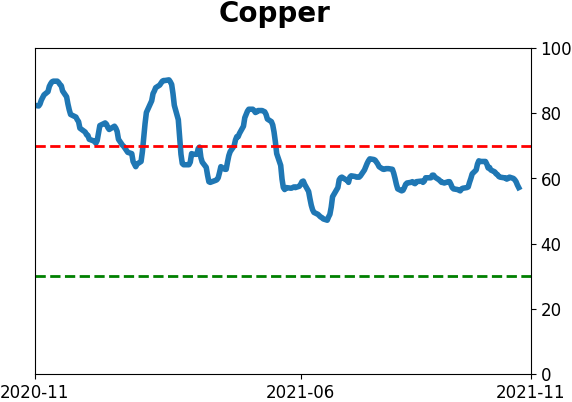
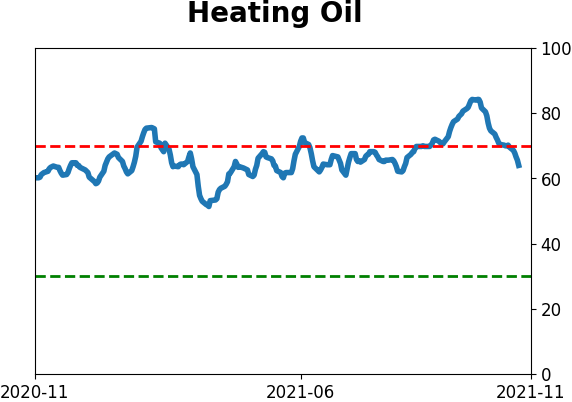
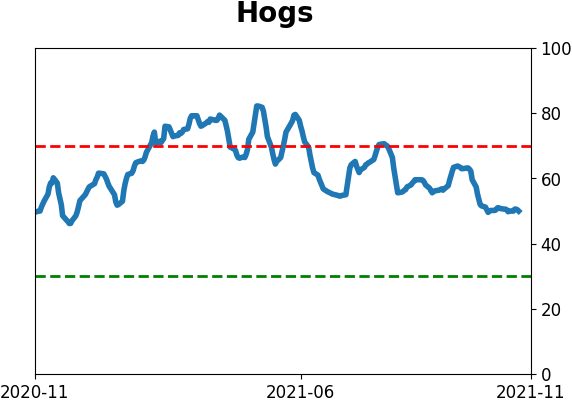
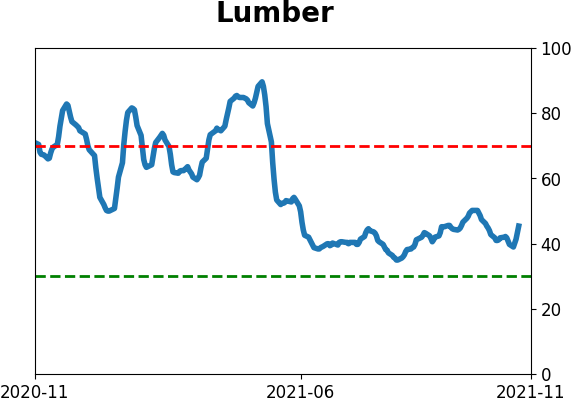
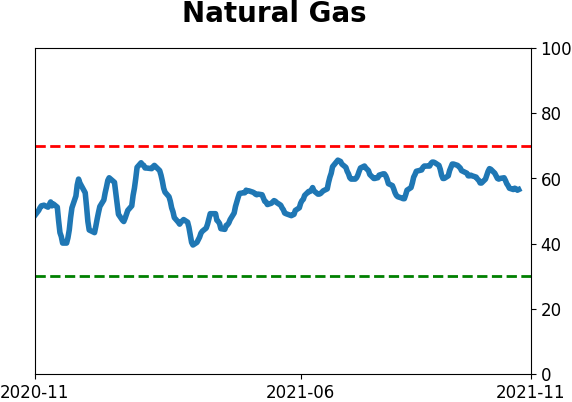
Optimism Index Thumbnails
|
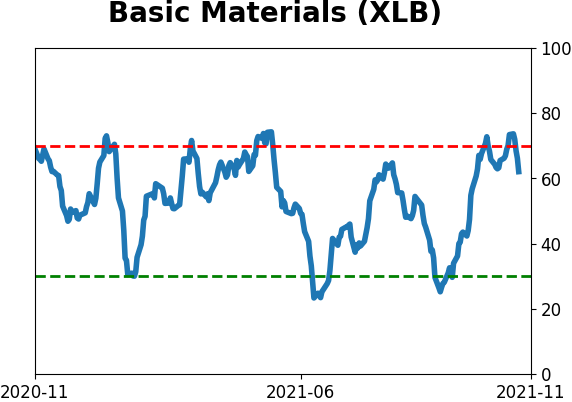
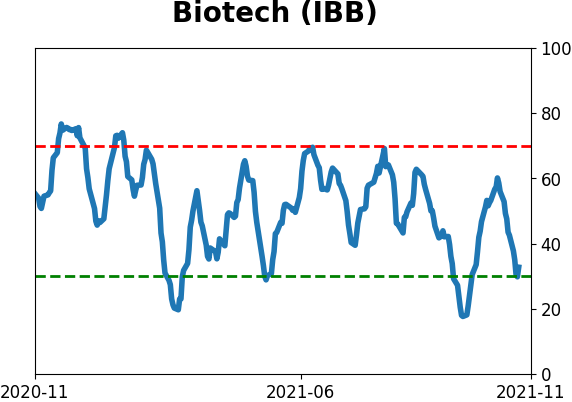
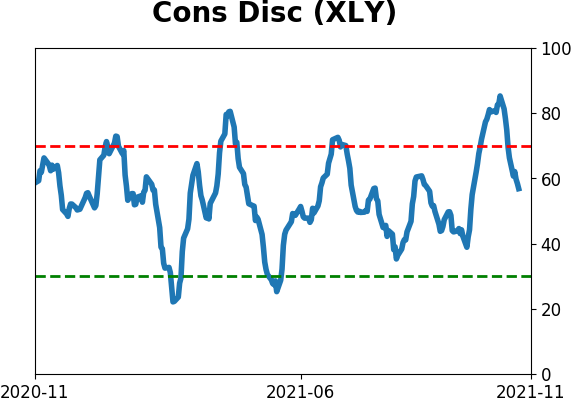
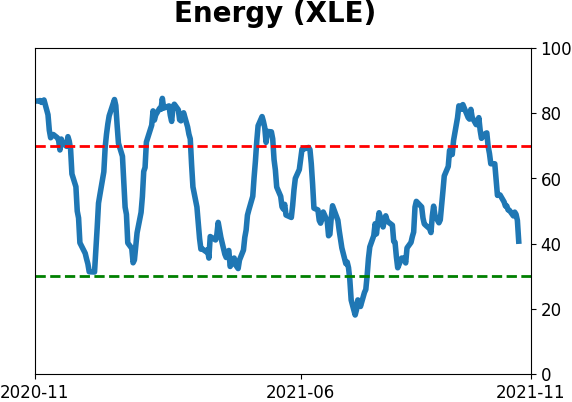
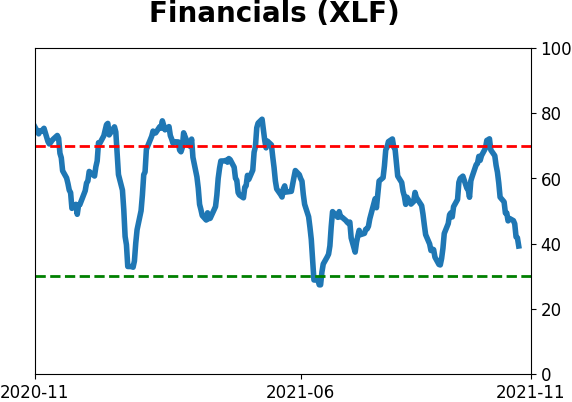
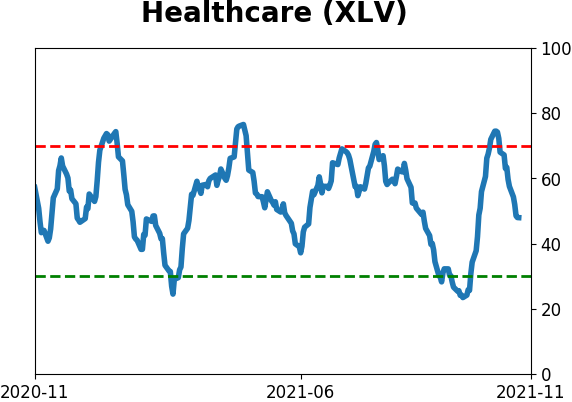
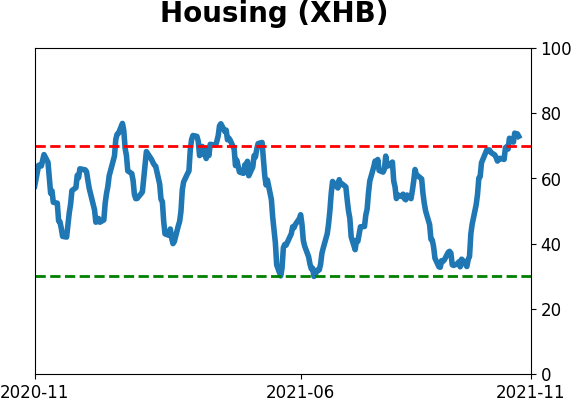
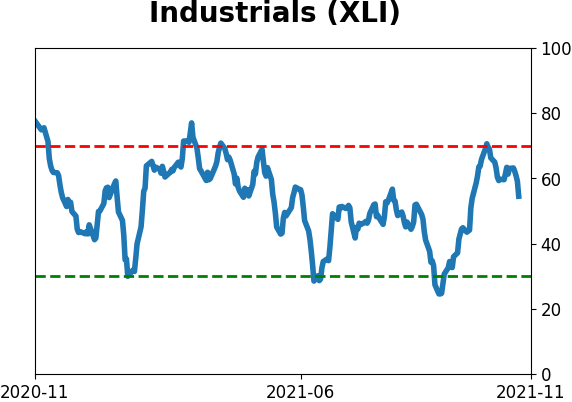
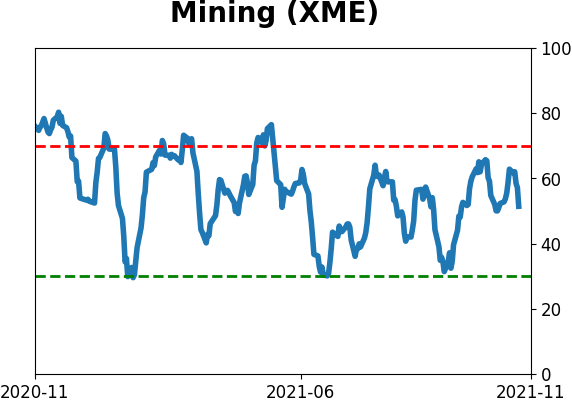
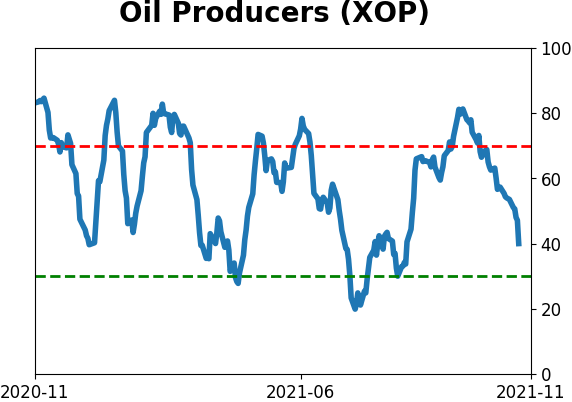
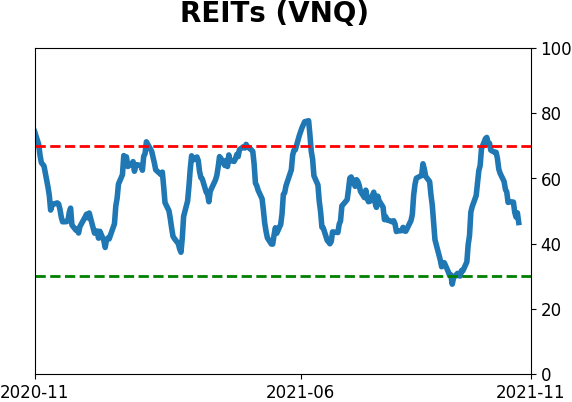
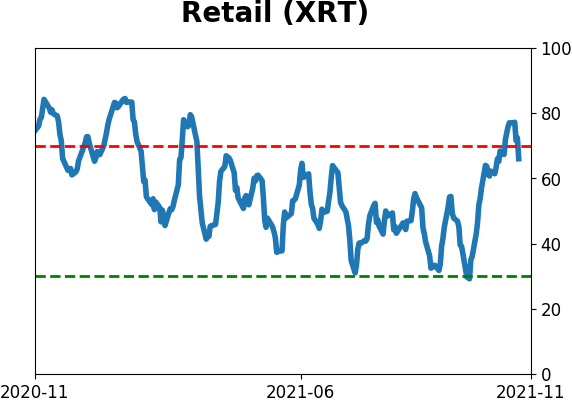
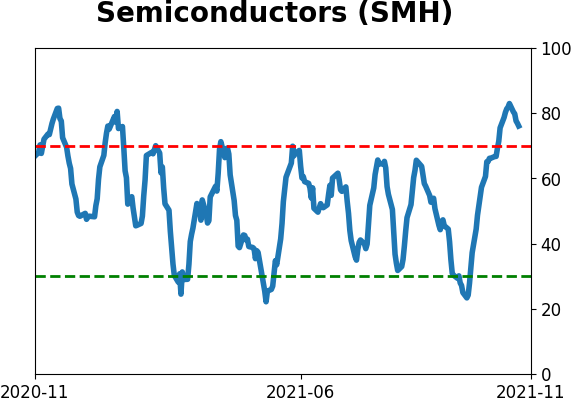
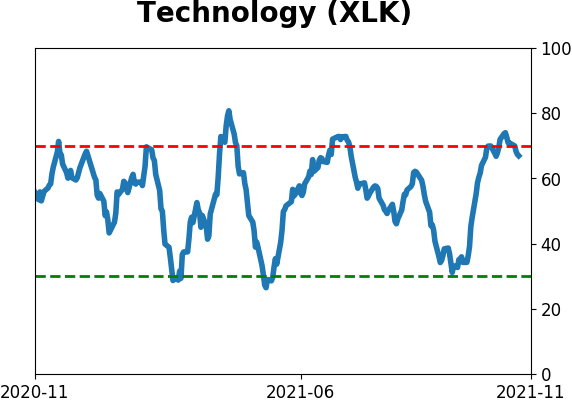
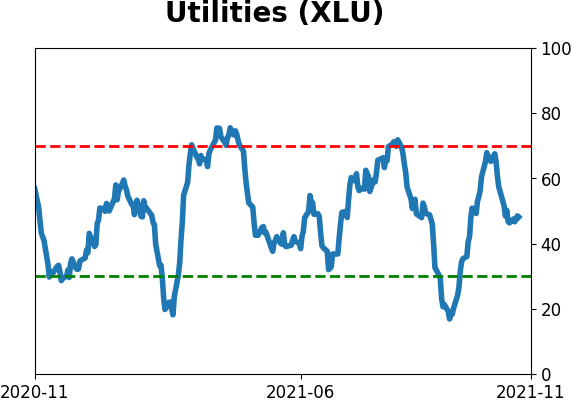
Sector ETF's - 10-Day Moving Average
|
|
|
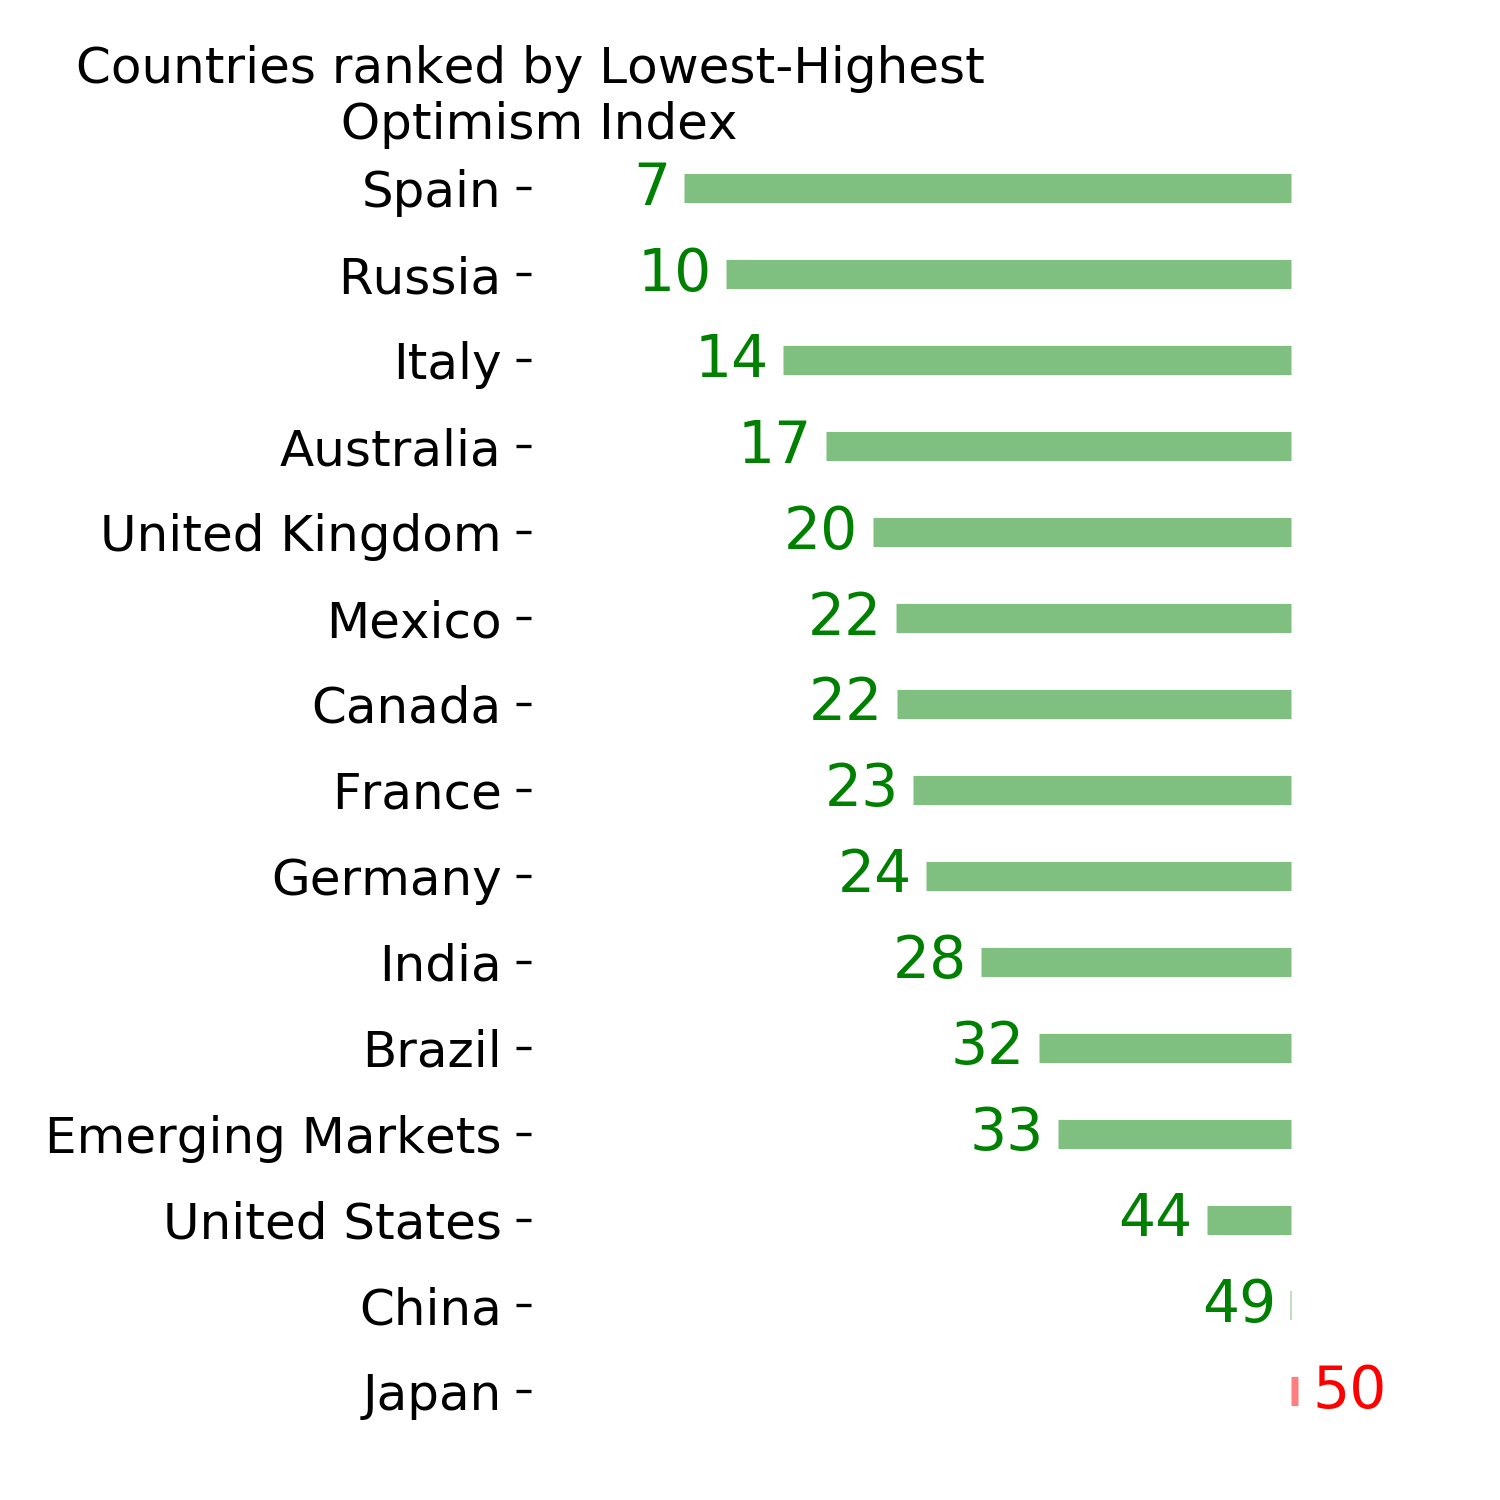
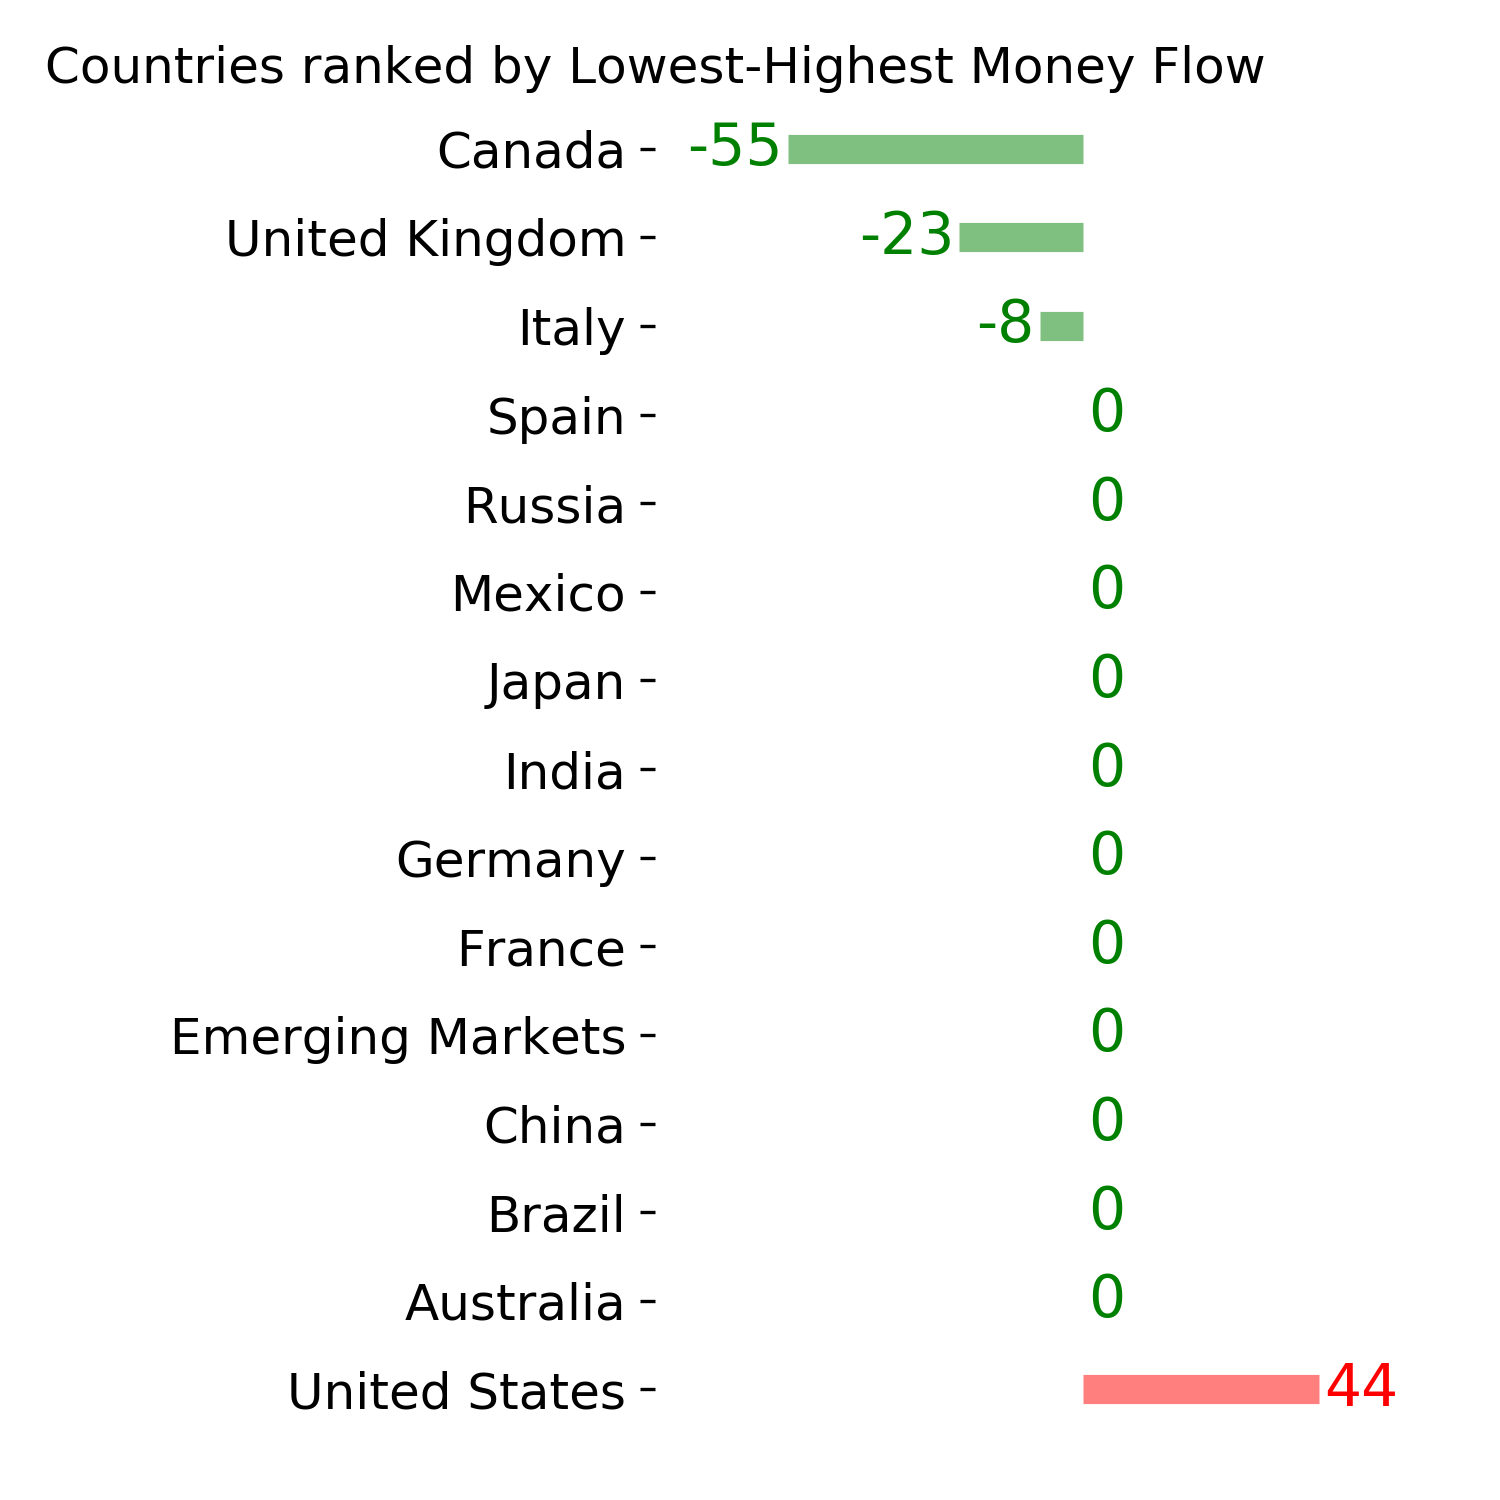
Country ETF's - 10-Day Moving Average
|
|
|
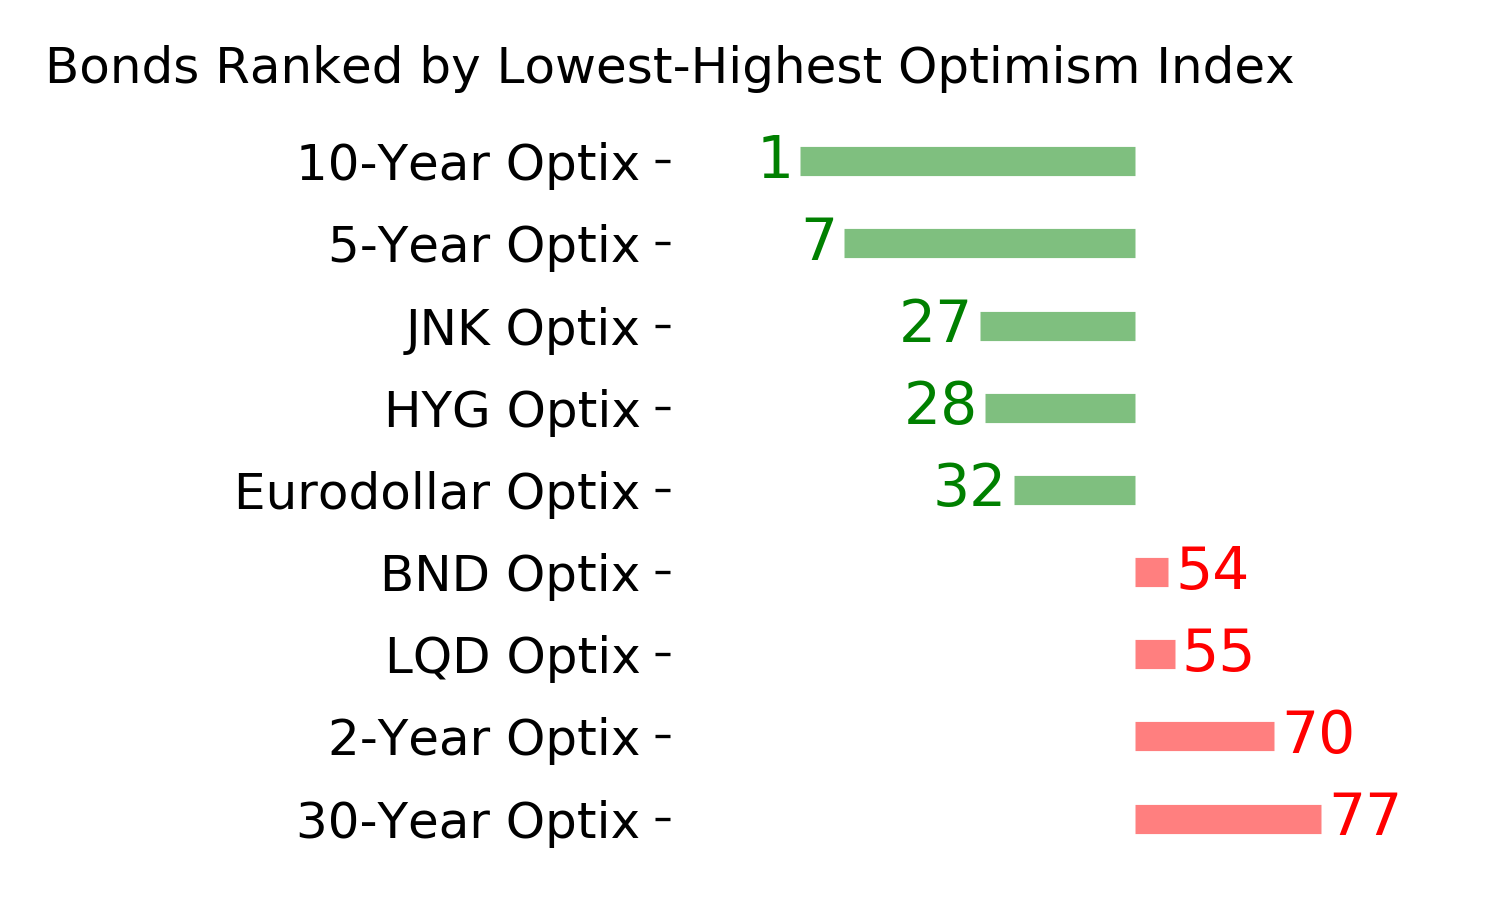
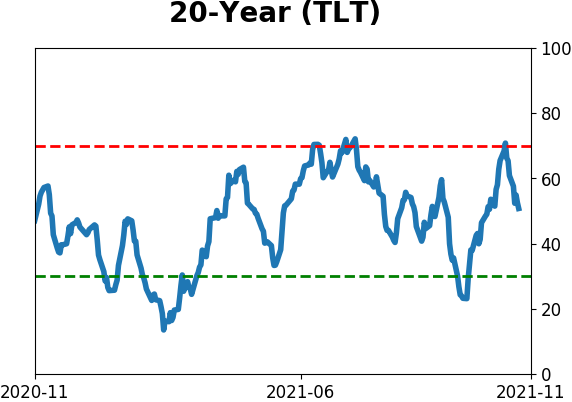
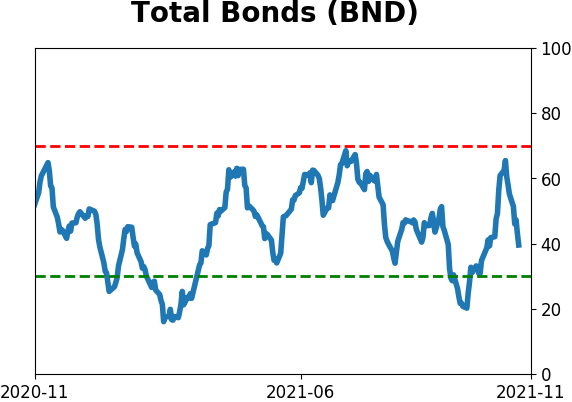
Bond ETF's - 10-Day Moving Average
|
|
|
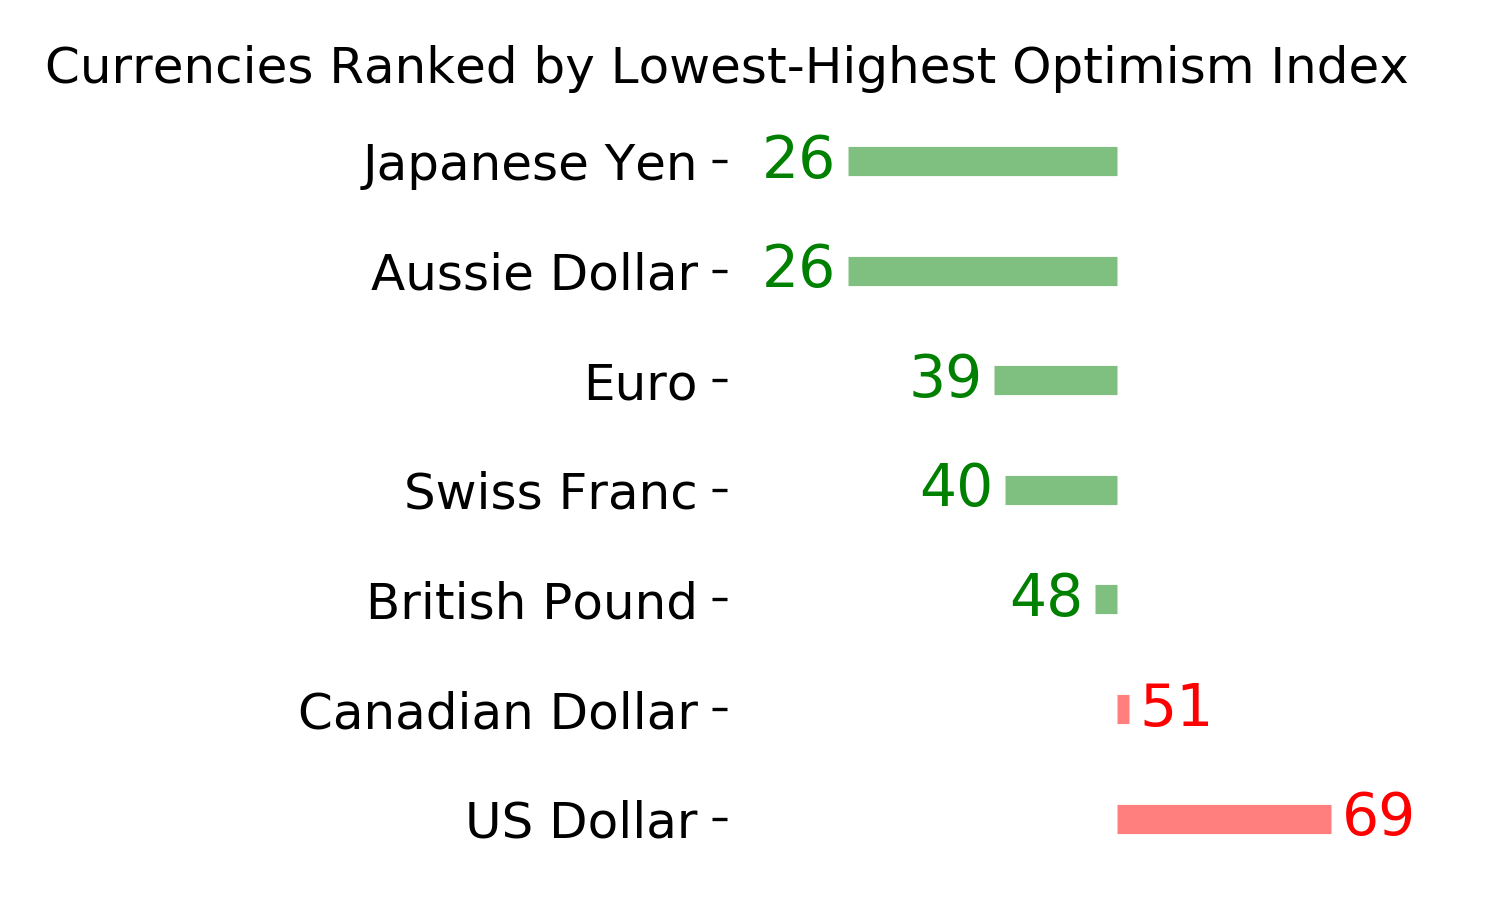
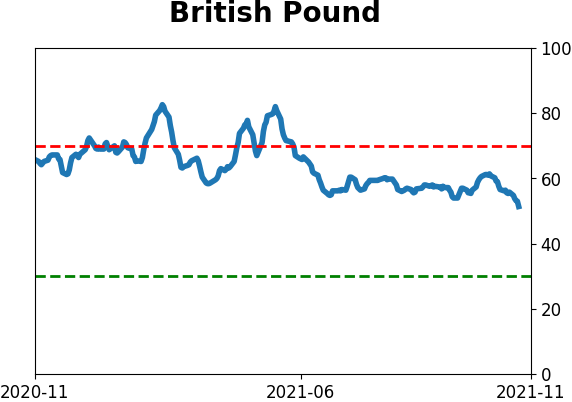
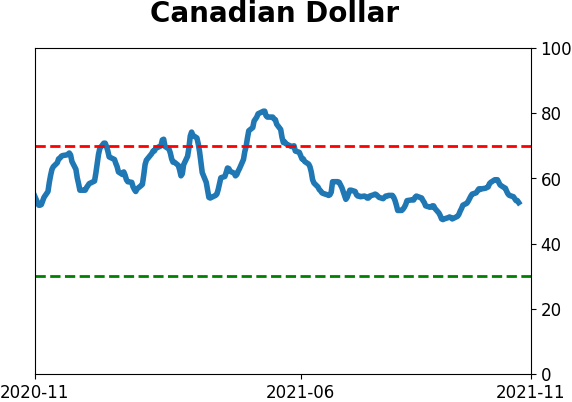
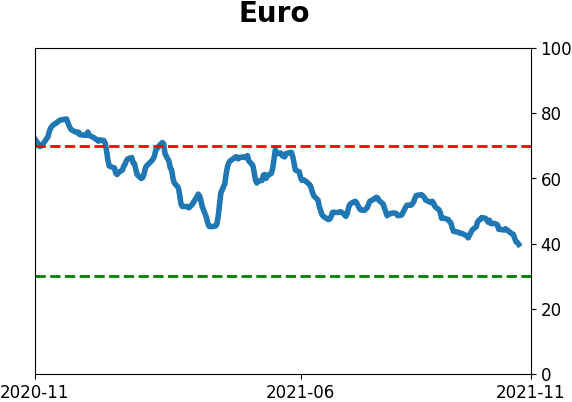
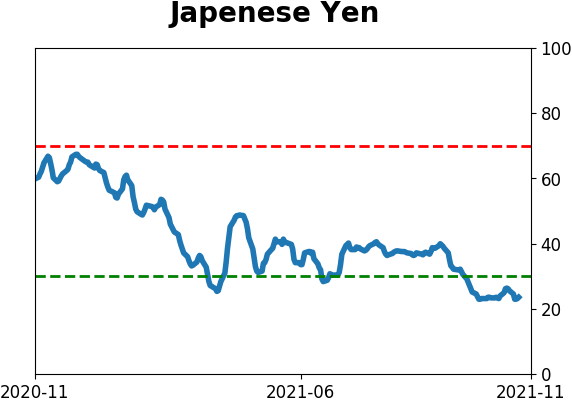
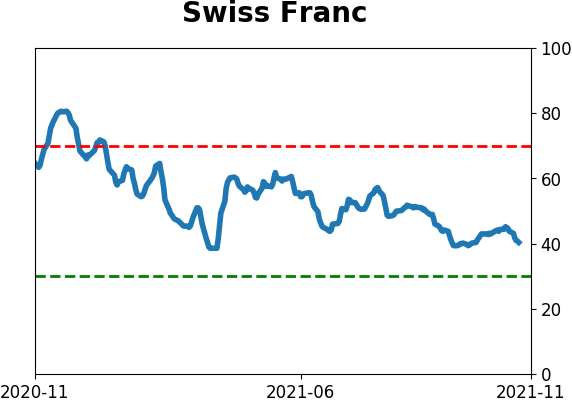
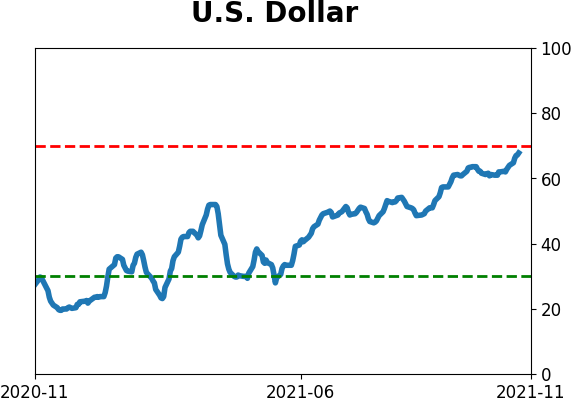
Currency ETF's - 5-Day Moving Average
|
|
|
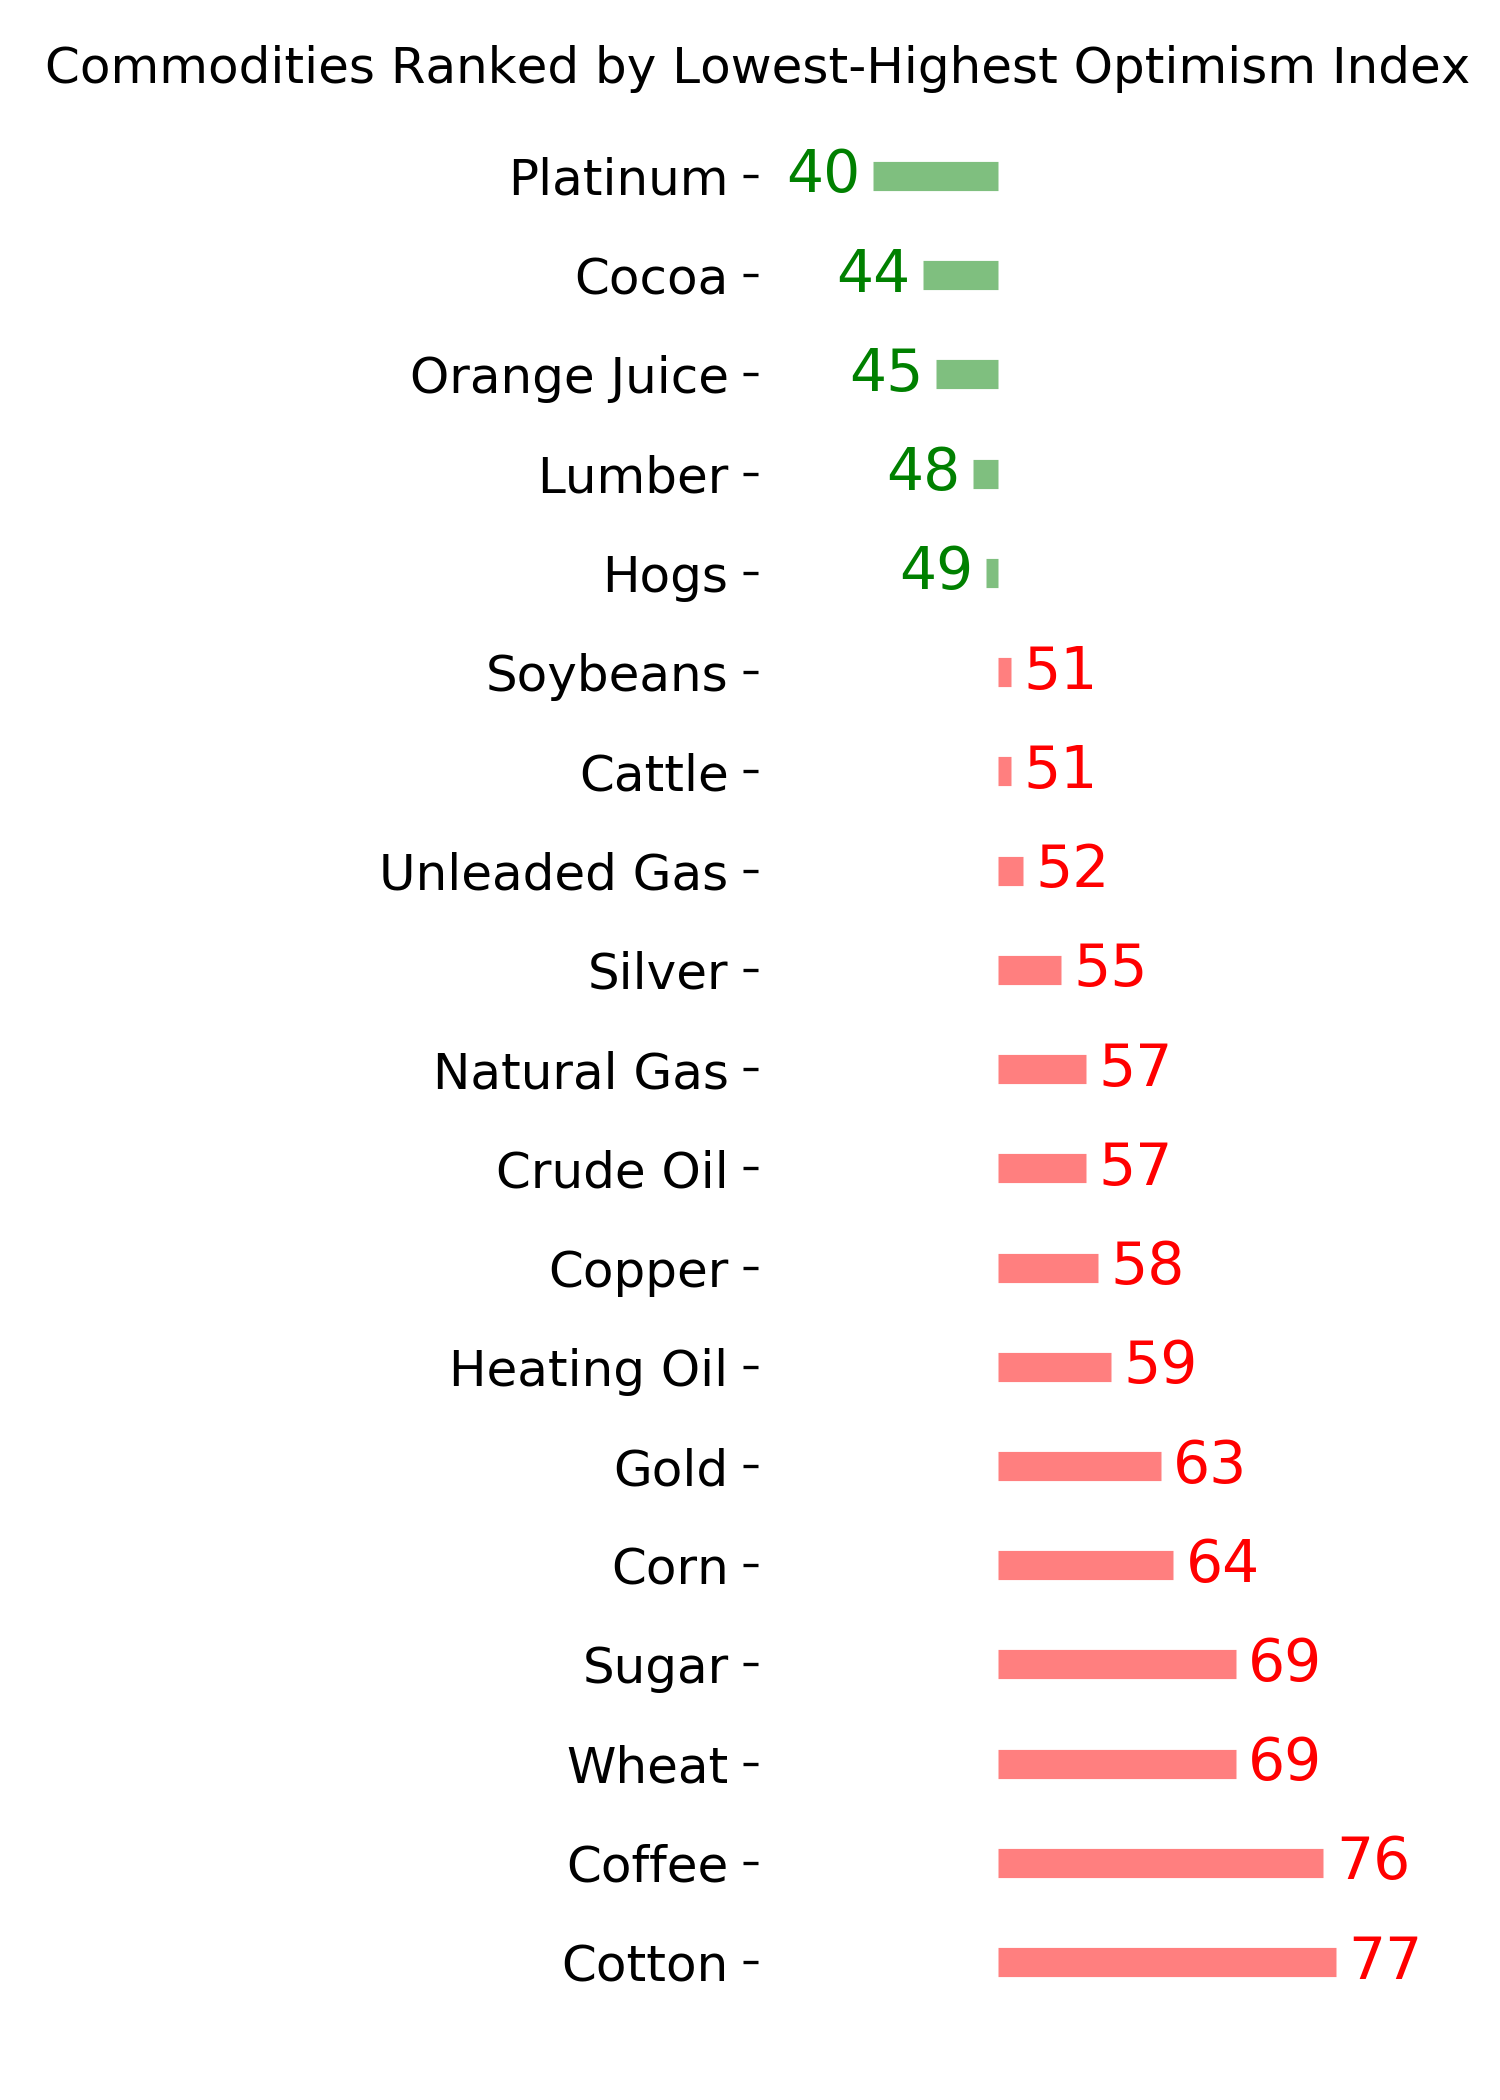
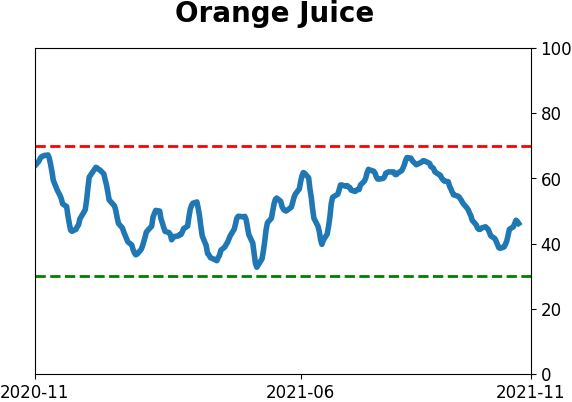
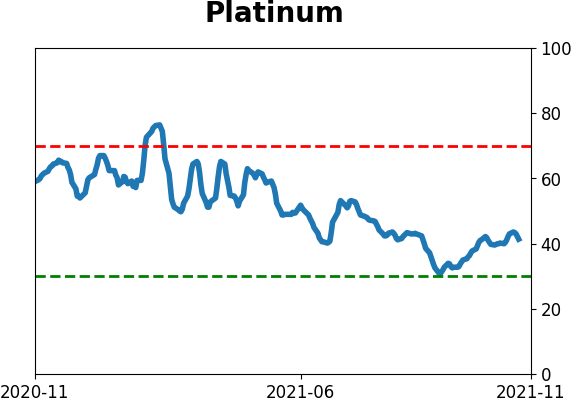
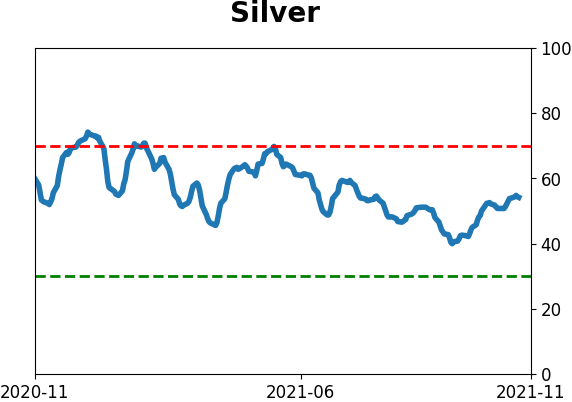
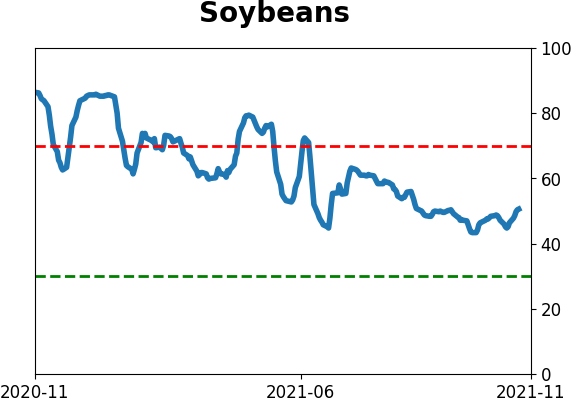
Commodity ETF's - 5-Day Moving Average
|
|