Headlines
|
|
The dollar ends its medium-term downtrend amid sour sentiment:
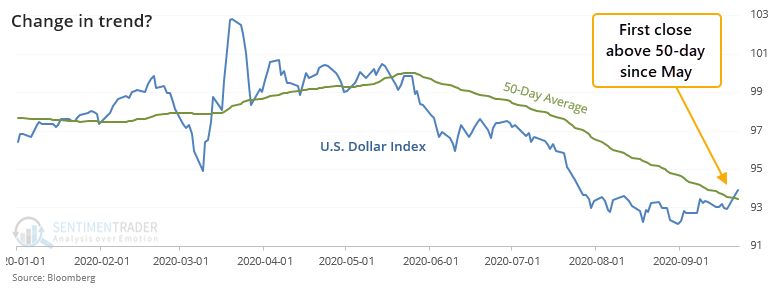
The U.S. dollar closed above its 50-day moving average for the first time since May. Positive momentum has been hard for the dollar to hold, however, and over the next 1-3 months, the dollar showed a negative return almost every time after ending similar streaks.
Small-caps leading lower again: The Russell 2000 index of smaller-capitalization companies is once again leading to the downside. It's the first of the "big four" indexes (S&P 500, Dow Industrials, Nasdaq Composite, and the Russell 2000) to fall below its 200-day average after all 4 had been above for over a month. We'll have more detail on Thursday, but in the shorter-term, the Russell continued to struggle, with a positive return two weeks later only 33% of the time. It generally wasn't that bad of a sign for the broader market, especially once we got past the first couple of weeks.
Bottom Line:
|
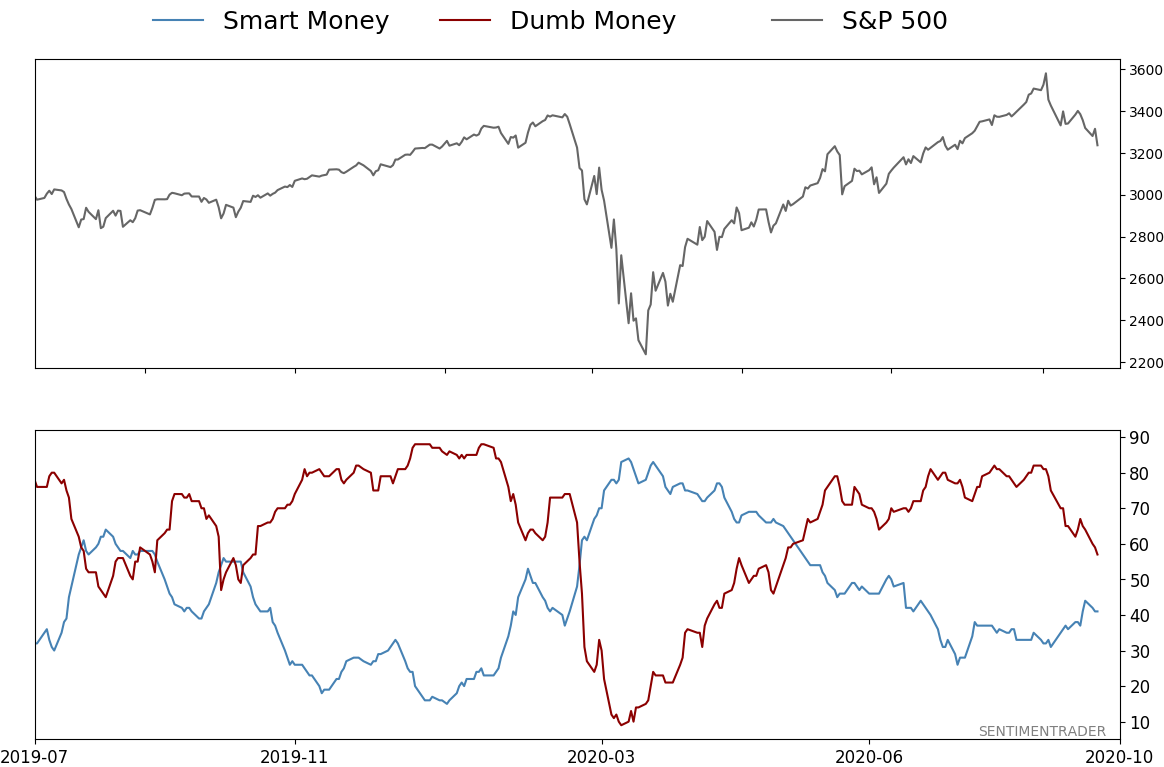
Smart / Dumb Money Confidence
|
Smart Money Confidence: 41%
Dumb Money Confidence: 57%
|
|
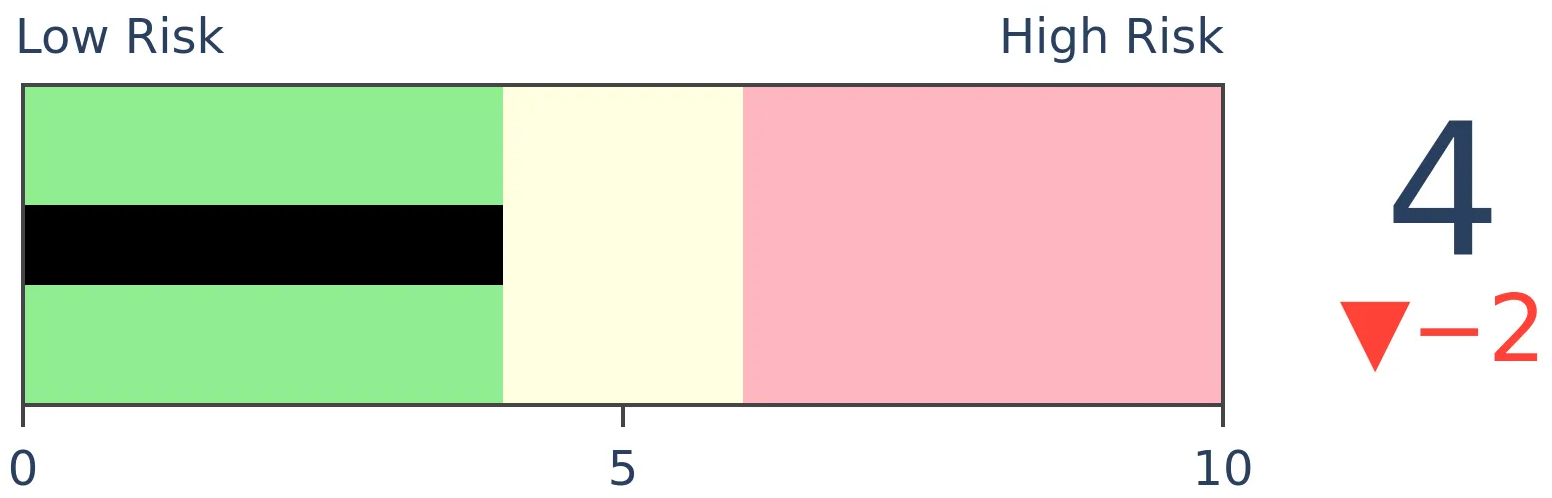
Risk Levels
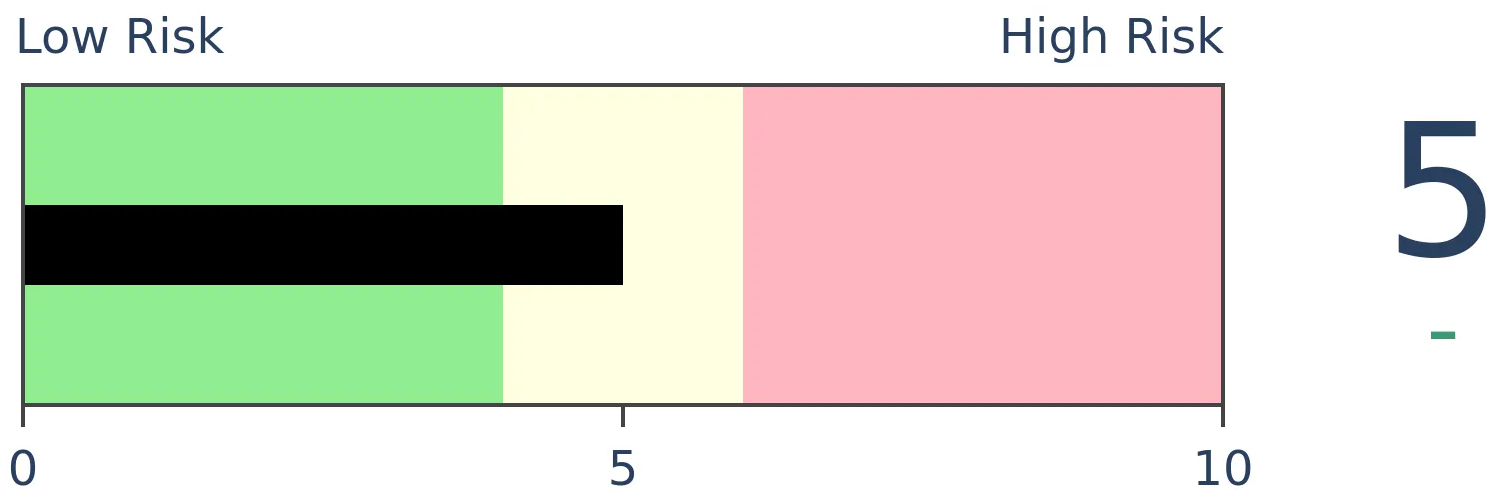
Stocks Short-Term
|
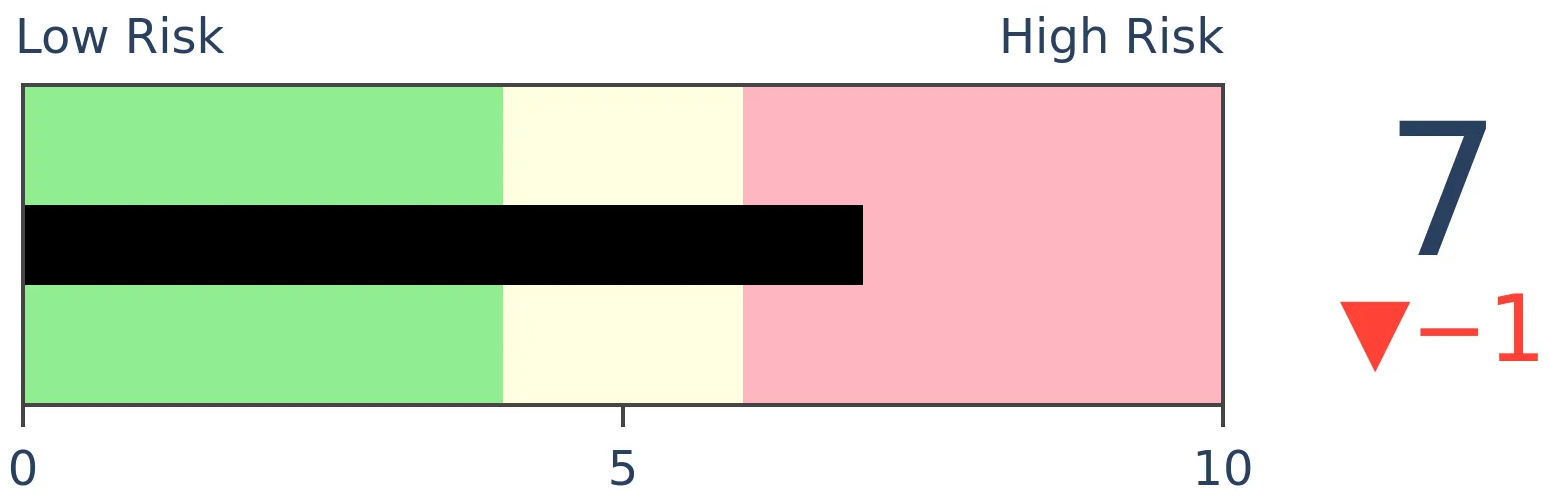
Stocks Medium-Term
|
|
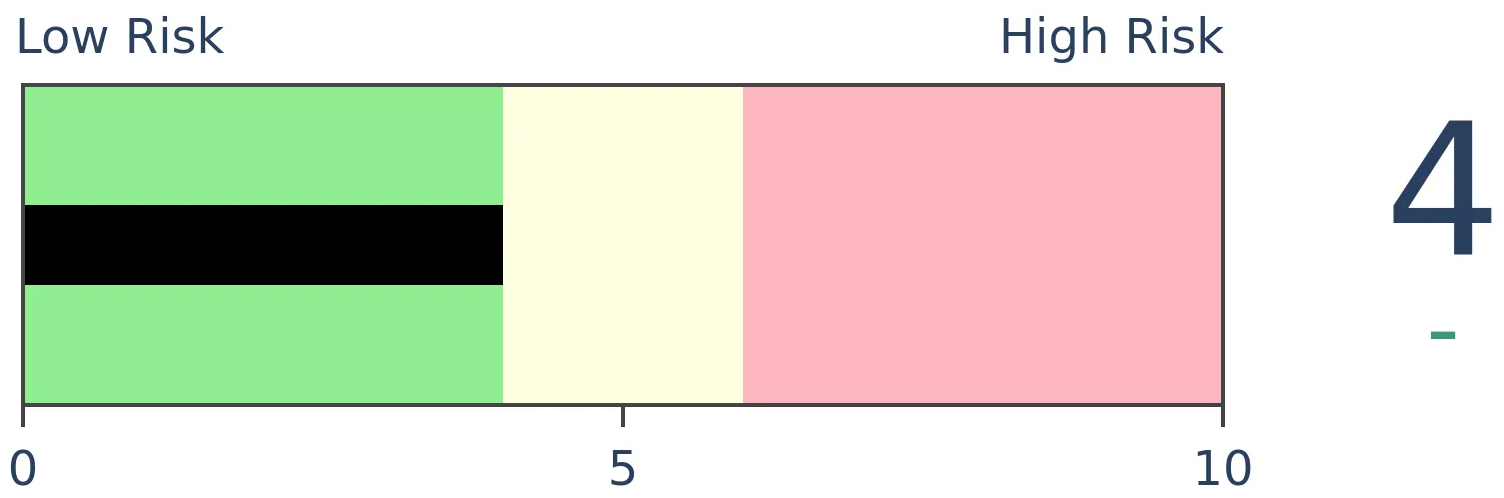
Bonds

|
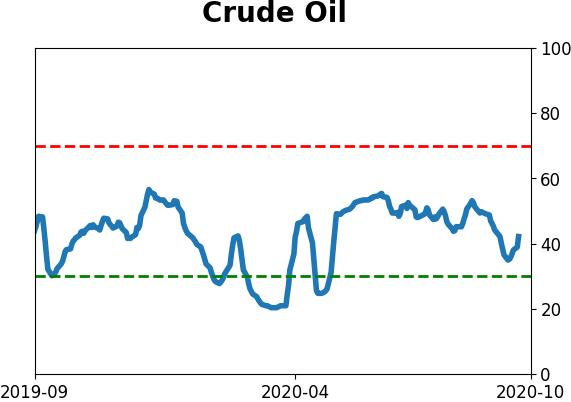
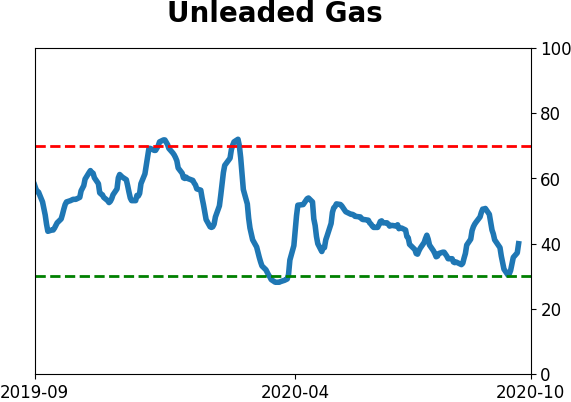
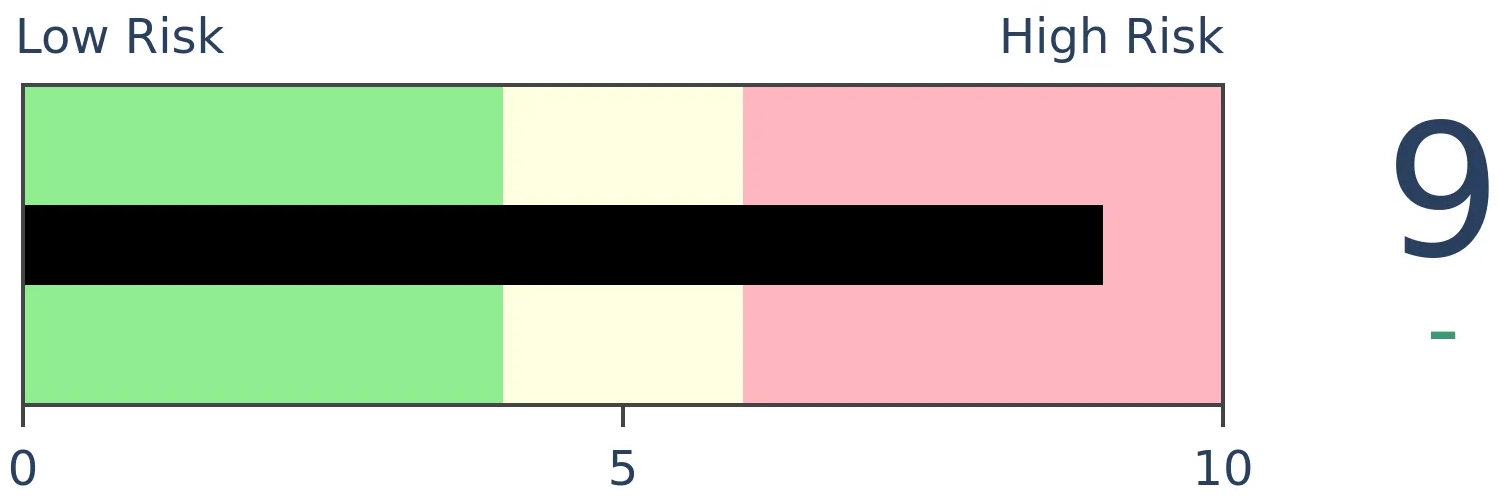
Crude Oil
|
|
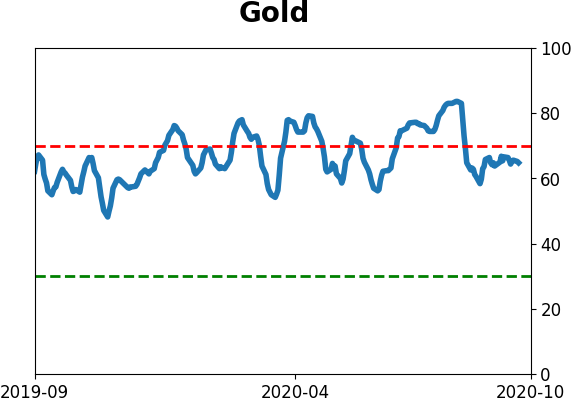
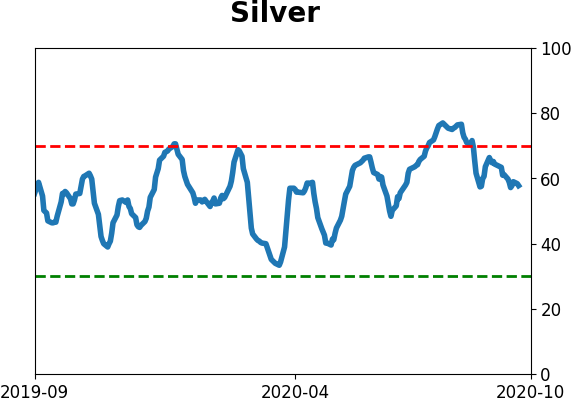
Gold
|
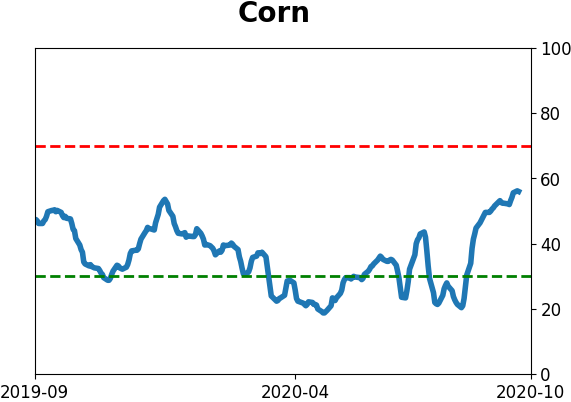
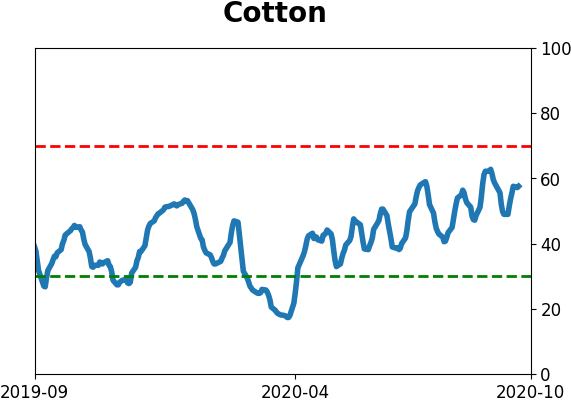
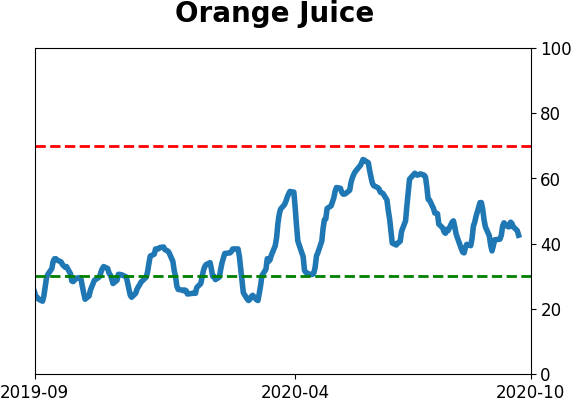
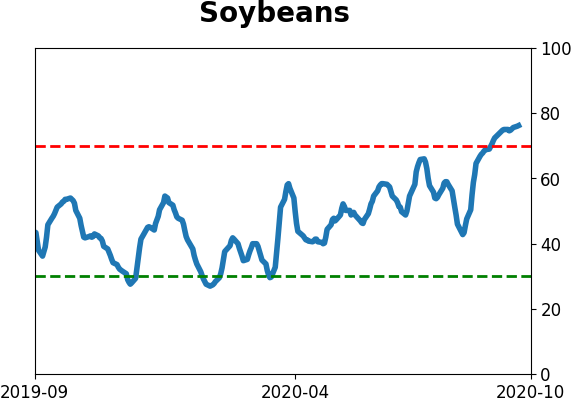
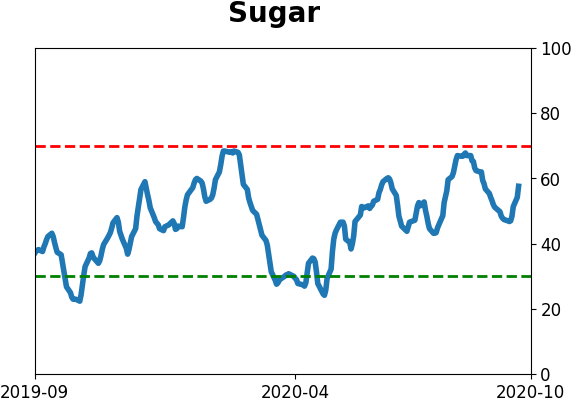
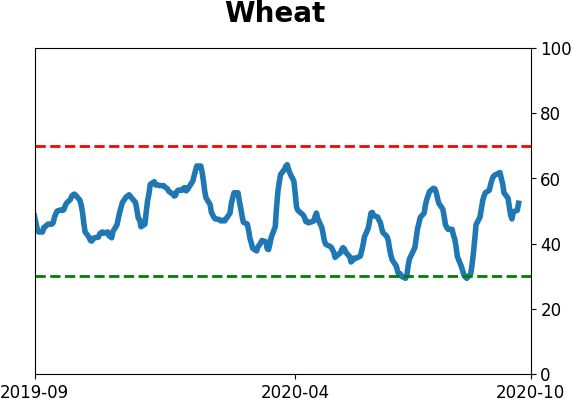
Agriculture
|
|
Research
BOTTOM LINE
The U.S. dollar closed above its 50-day moving average for the first time since May. Positive momentum has been hard for the dollar to hold, however, and over the next 1-3 months, the dollar showed a negative return almost every time after ending similar streaks.
FORECAST / TIMEFRAME
None
|
Many markets seem to be keying off each other in recent weeks, with some version of a move in rates driving the dollar which drives gold and tech stocks which drives the broader market.
Rising above the 50-day average
It's interesting how trends and streaks in one market closely are closely overlapping those in others. For example, the S&P 500 just slid below its 50-day moving average for the first time in months and then on Tuesday the U.S. dollar just rose above its own 50-day for the first time since May.
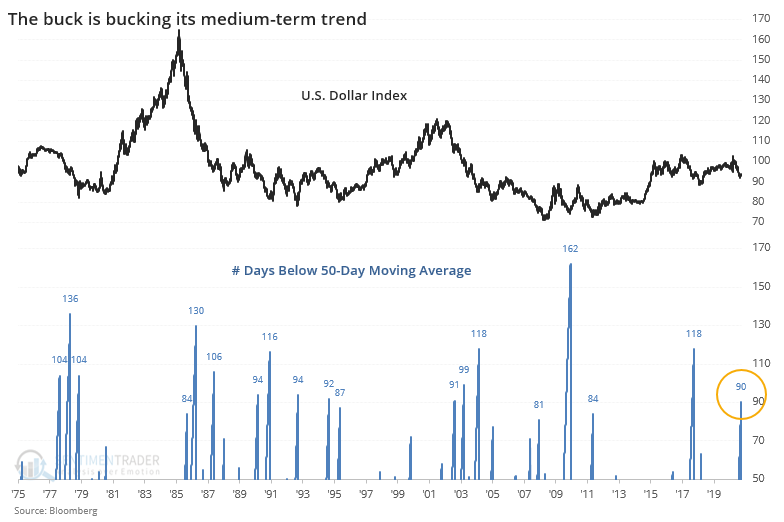
That ended a streak of 90 sessions that the dollar had been below its medium-term average, ranking among the longest streaks since 1975.
As we've seen in past studies, it's been hard for the dollar to hold any kind of positive momentum when sentiment toward the currency is poor. That's no different after those times it ended a streak of at least 3 months below its 50-day average. The table below is filtered to only include signals when the dollar was also at least 3% below its 200-day moving average at the time.
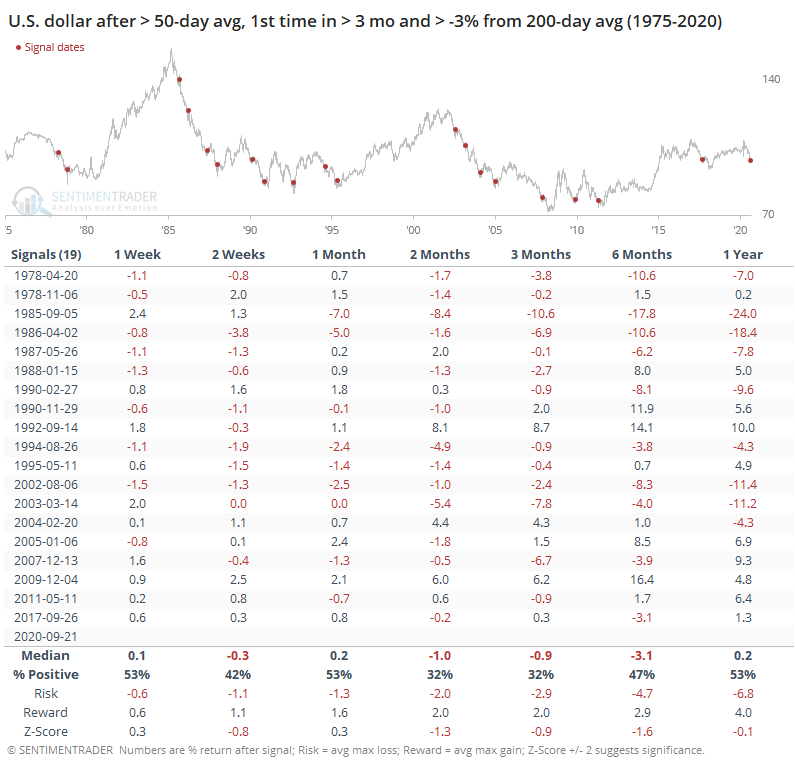
Returns over the medium-term of 2-3 months were very poor, and the risk/reward skew was negative up to a year later. Out of the 19 signals, 16 of them saw a negative return at some point during the next 1 - 3 months.
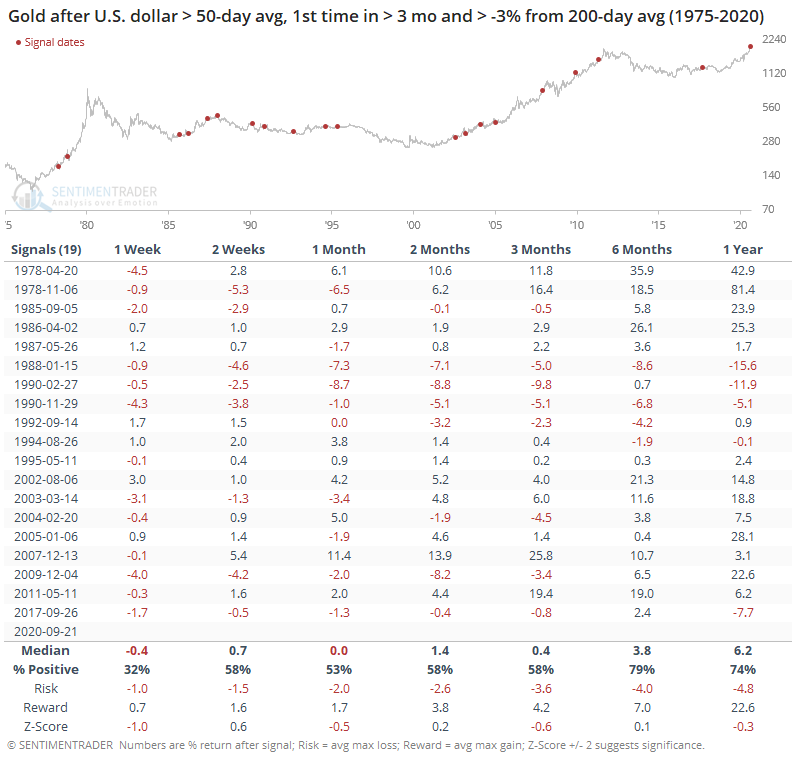
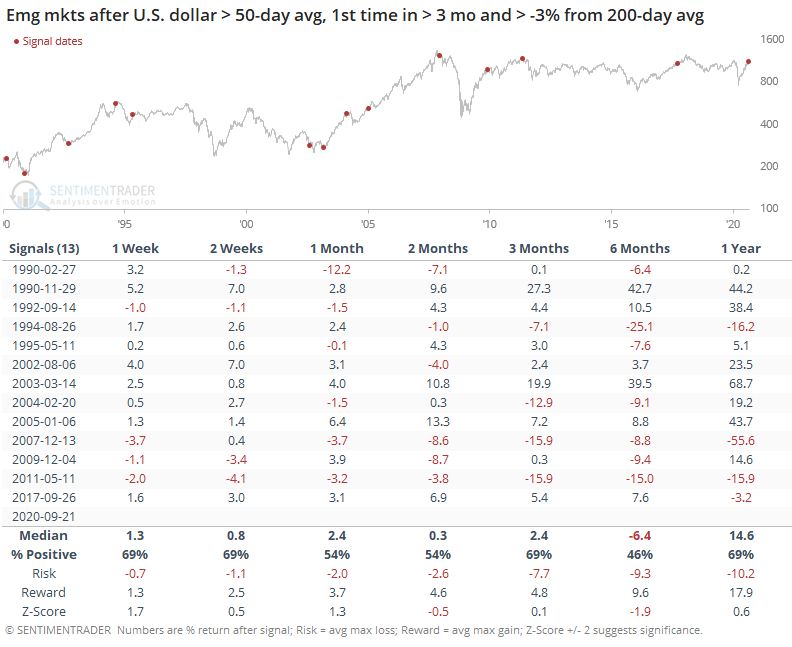
If the dollar did poorly, then gold should have done well. That was kinda-sorta the case but it was not a strong edge.
Same goes for emerging market stocks, using the MSCI Emerging Markets Index.
The "smart money" is net long
Sentiment toward the dollar in the media, both traditional and social, seems to have quickly shifted. Two of the major factors cited are that speculators are heavily short and it's breaking a multi-month downtrend line. Because commercial hedgers by definition take the other side of both large and small speculators, this means that "smart money" hedgers are net long.
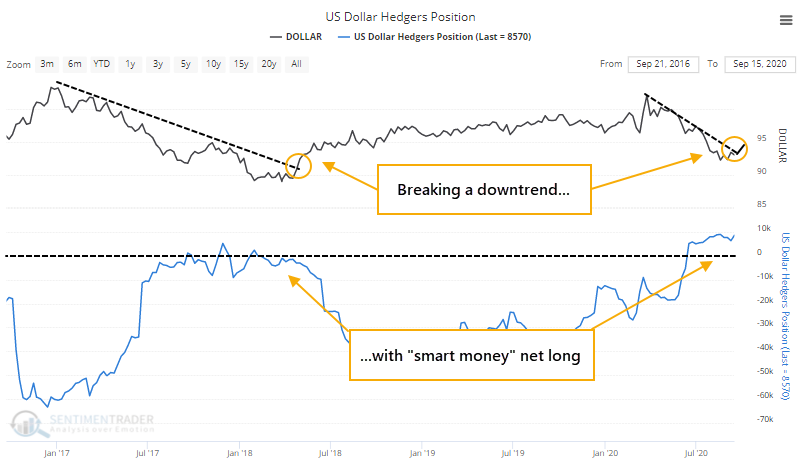
When hedgers were long in 2018 and the dollar broke its downtrend, it went on a nice bull run. There are two problems with this:
- Trendlines are entirely subjective and prior failures are always ignored, and
- Hedgers have been long for months already with no effect
Hedgers are net long more than 20% of the open interest in the dollar. Using the Backtest Engine, we can objectively see how the dollar has performed going forward.
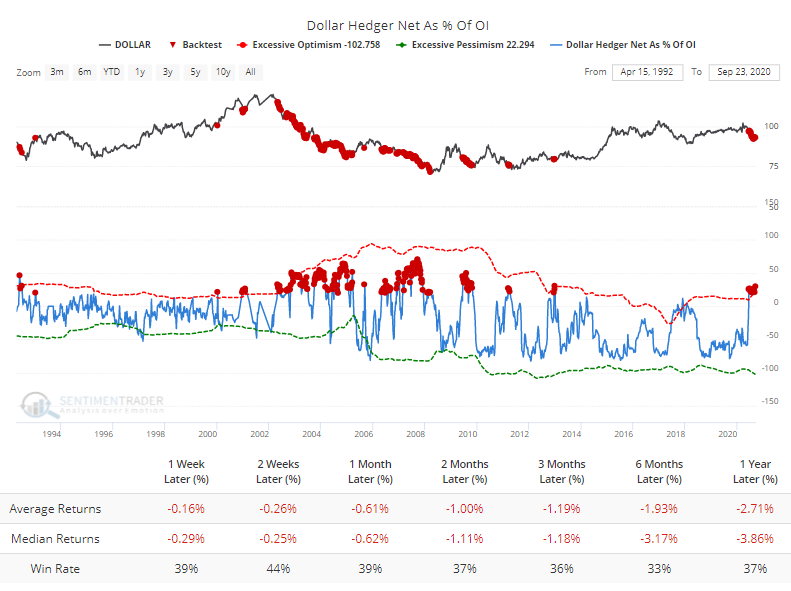
Unlike most contracts, the dollar hasn't responded well to extremes in this data. Currencies are "trendier" than most and when a long-term trend takes hold, it's tough to turn it on sentiment alone.
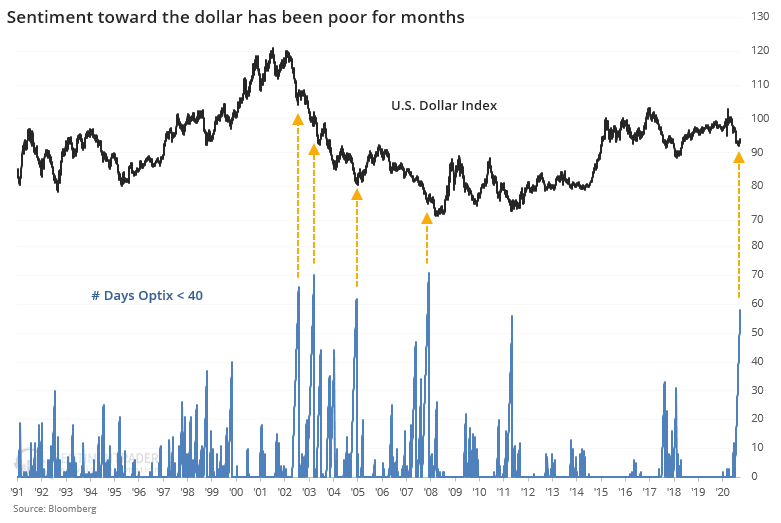
Sentiment has been extremely poor
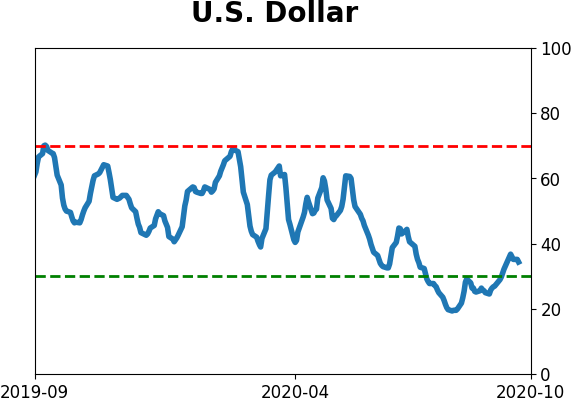
And there's no doubt that sentiment has been sour. The Optimism Index (Optix) hasn't been above 40 for nearly 60 days.
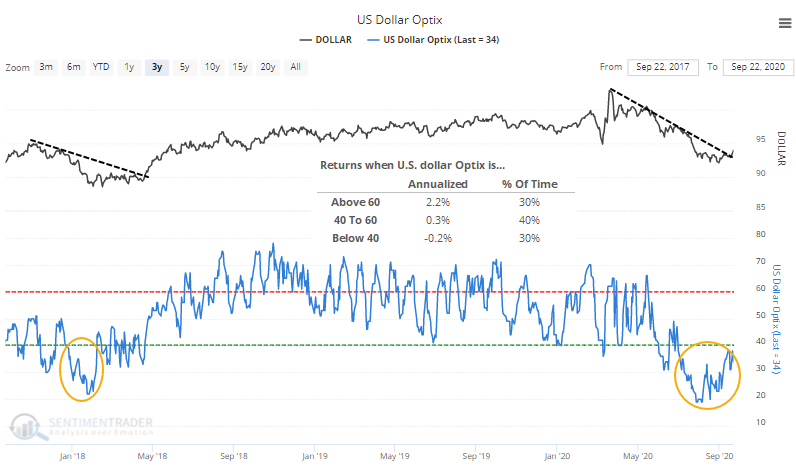
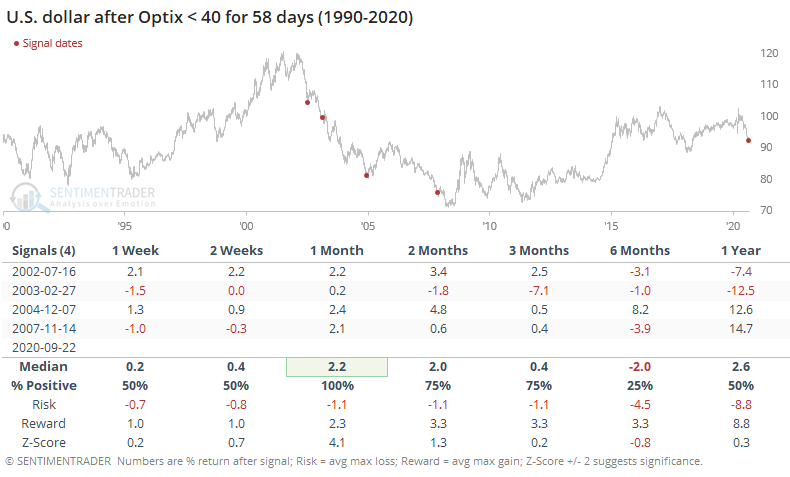
Over the past 30 years, there have been only 4 other times when we've gone this long without a reading above 40. That's nearing an all-time record, just surpassing another long streak in 2011 that coincided with the end of the long bear market.
The others weren't so positive for the dollar. By the time optimism had been this low for this long, the buck did bounce over the next month each time, but fell back in the months ahead after 3 of them.
The sample size is small so if we look at streaks of 30 days with an Optix below 40, we get quite a few more precedents.
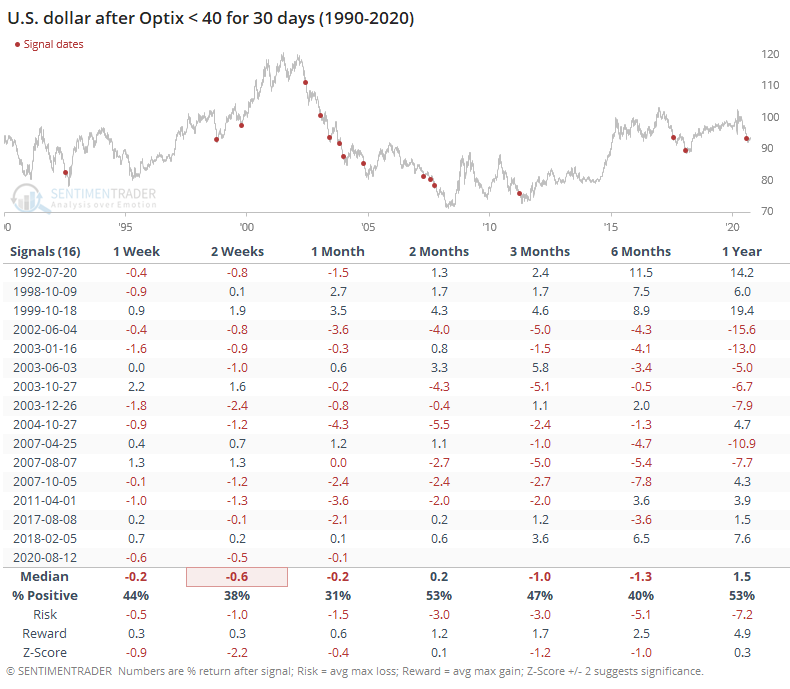
The earlier chart showing the Optix for the dollar over the past few years shows that when optimism is below 40, the dollar's annualized return is -0.2%; when the Optix is above 60, its return is +2.2%. The dollar is one of those very few markets where sentiment extremes often work less as a contrary indicator and more as a confirming one. As long as the Optimism Index consistently hangs below 50, we'd be more inclined to disbelieve short-term rally attempts.
A 3-week rally from the low
The dollar bottomed 3 weeks ago and has rallied more than 1.5% since then. Maybe that's enough to qualify for "this time is different" as other counter-trend rallies tended to peter out sooner, or so it seems. If we go back to 1975 and look for all rallies of 15 days from a 52-week low, with gains of at least 1.5%, then we get the following.
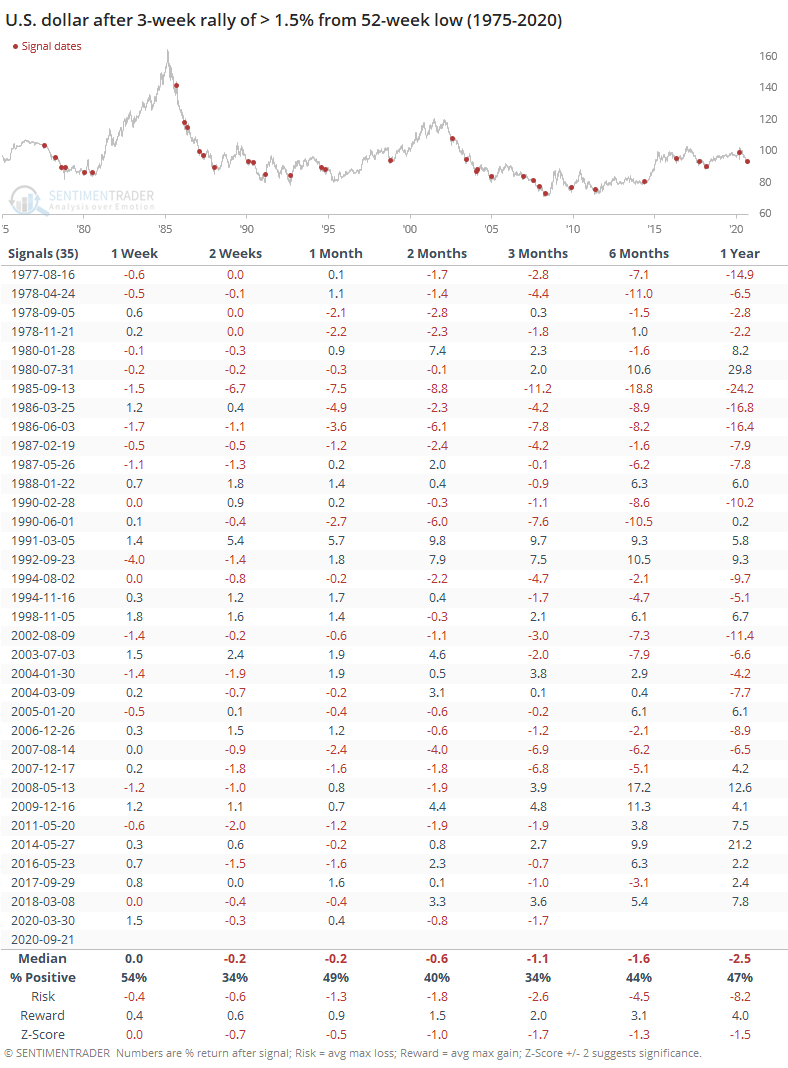
Most of them added to gains over the next week, then quickly fell apart. Remarkably, 30 out of the 35 signals saw a negative return at some point between the next 1-3 months.
Below, we can see how far the average failed rally in the dollar tended to go. These are times when the buck hit a 52-week low, then rallied to at least a 2-month high, then fell to a new 52-week low at some point within the next 6 months.
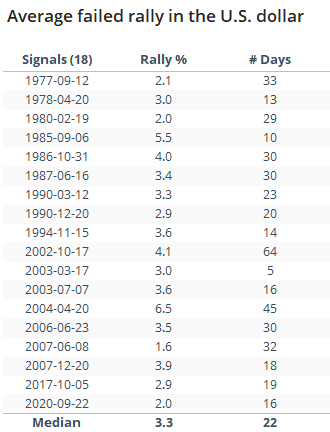
On average, these rallies lasted 22 days, gaining 3.3% from the low. So far (using intraday data through Wednesday), this rally has gone 16 days with about a 2% gain. So, if this were to match the typical counter-trend failed rally, it would go about another week and about another 1% before failing.
Breakout, mean-reversion, and seasonality
If we only go back a few years, then the combination of a potential trendline break, short-covering potential, and positive seasonality seems to work toward a further recovery in the dollar.
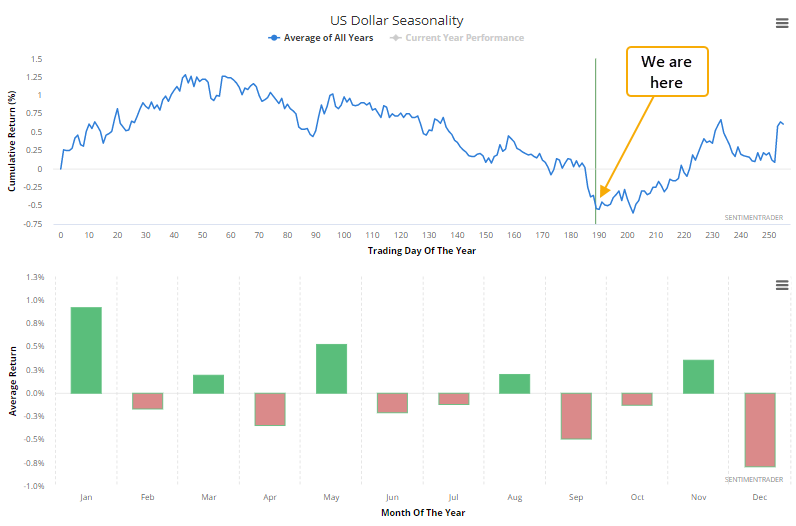
The main problem with this argument is that it's shortsighted and we'd have to put almost all of our weight on 2018 as a template for a recovery. Going back further shows us that this has not been a reliable combination for a sustained dollar rally, so we'd have to see sentiment improve, and stay buoyant, before the risk/reward firmly changes to the positive.
Active Studies
| Time Frame | Bullish | Bearish | | Short-Term | 0 | 1 | | Medium-Term | 1 | 12 | | Long-Term | 47 | 2 |
|
Indicators at Extremes
Portfolio
| Position | Description | Weight % | Added / Reduced | Date | | Stocks | RSP | 15.2 | Reduced 4.2% | 2020-09-03 | | Bonds | 10% TLT, 10% BND, 10% SCHP | 30.0 | Added 30% | 2020-09-09 | | Commodities | GCC | 2.4 | Reduced 2.1%
| 2020-09-04 | | Precious Metals | GDX | 5.0 | Added 5% | 2020-09-09 | | Special Situations | XLE | 4.9 | Added 5.1% | 2020-09-03 | | Cash | | 42.5 | | |
|
Updates (Changes made today are underlined)
After stocks bottomed on March 23rd, they enjoyed a historic buying thrust and retraced a larger amount of the decline than "just a bear market rally" tends to. Through June, there were signs of breadth thrusts, recoveries, and trend changes that have an almost unblemished record at preceding higher prices over a 6-12 month time frame. On a shorter-term basis, our indicators have been showing high optimism, with Dumb Money Confidence recently above 80%, along with signs of reckless speculation during what appears to be an unhealthy market environment, historically a bad combination. While there are certainly some outlier indicators that are showing apathy or even outright pessimism, a weight-of-the-evidence approach suggests high risk over a multi-week to multi-month time frame. That has been the case since July, even arguably June and yet the major indexes hit continual new highs through late August. With the indicators and studies failing to precede any weakness, I've been hesitant to lower my already-low exposure. I am getting increasingly anxious about the oddities we're seeing, though, and lowered it again. This account is mostly about comfort with risk for me, and right now I'm not at all comfortable with any of it. In more than 25 years of experience, this is the oddest market I've ever seen. I lowered exposure again - likely the lowest I'm willing to go at this point given longer-term positives - and decided to switch to an equal-weight version of the S&P 500 index. I've become intensely uncomfortable with the concentration in the cap-weighted index. Our studies have been mixed with regard to the potential for the equal-weight version to outperform the cap version going forward, so historical support isn't overwhelming. I'm also increasingly interested again in energy stocks, starting with a small allocation. I got burned in March with the unprecedented geopolitical spat that hammered those stocks then but the longer-term setup is decent. In this account, I’ve roughly followed what has become known as the All Weather portfolio popularized by Ray Dalio. It allocates across four broad assets, designed to hold up no matter the market environment. The goal is modest positive returns while limiting large, sustained losses. I typically use popular ETFs, with low costs. At times, I will swap out for a fund I believe has better prospects, or simply lower fees if not. At other times, I will diverge quite a bit from baseline allocations, largely depending on the indicators and studies we discuss on the site. I've gotten away from this in the past, using "cash" as a substitute for "bonds" and with rates stuck at 0%, that has become less appetizing. I'm trying to get back more toward the baselines with less dramatic swings in either direction. The base allocation I use is the following: Stocks: 35%
Bonds: 45%
Precious Metals: 7.5%
Commodities: 7.5%
Cash / Special Opportunities: 5%
RETURN YTD: -2.3% 2019: 12.6%, 2018: 0.6%, 2017: 3.8%, 2016: 17.1%, 2015: 9.2%, 2014: 14.5%, 2013: 2.2%, 2012: 10.8%, 2011: 16.5%, 2010: 15.3%, 2009: 23.9%, 2008: 16.2%, 2007: 7.8%
|
|
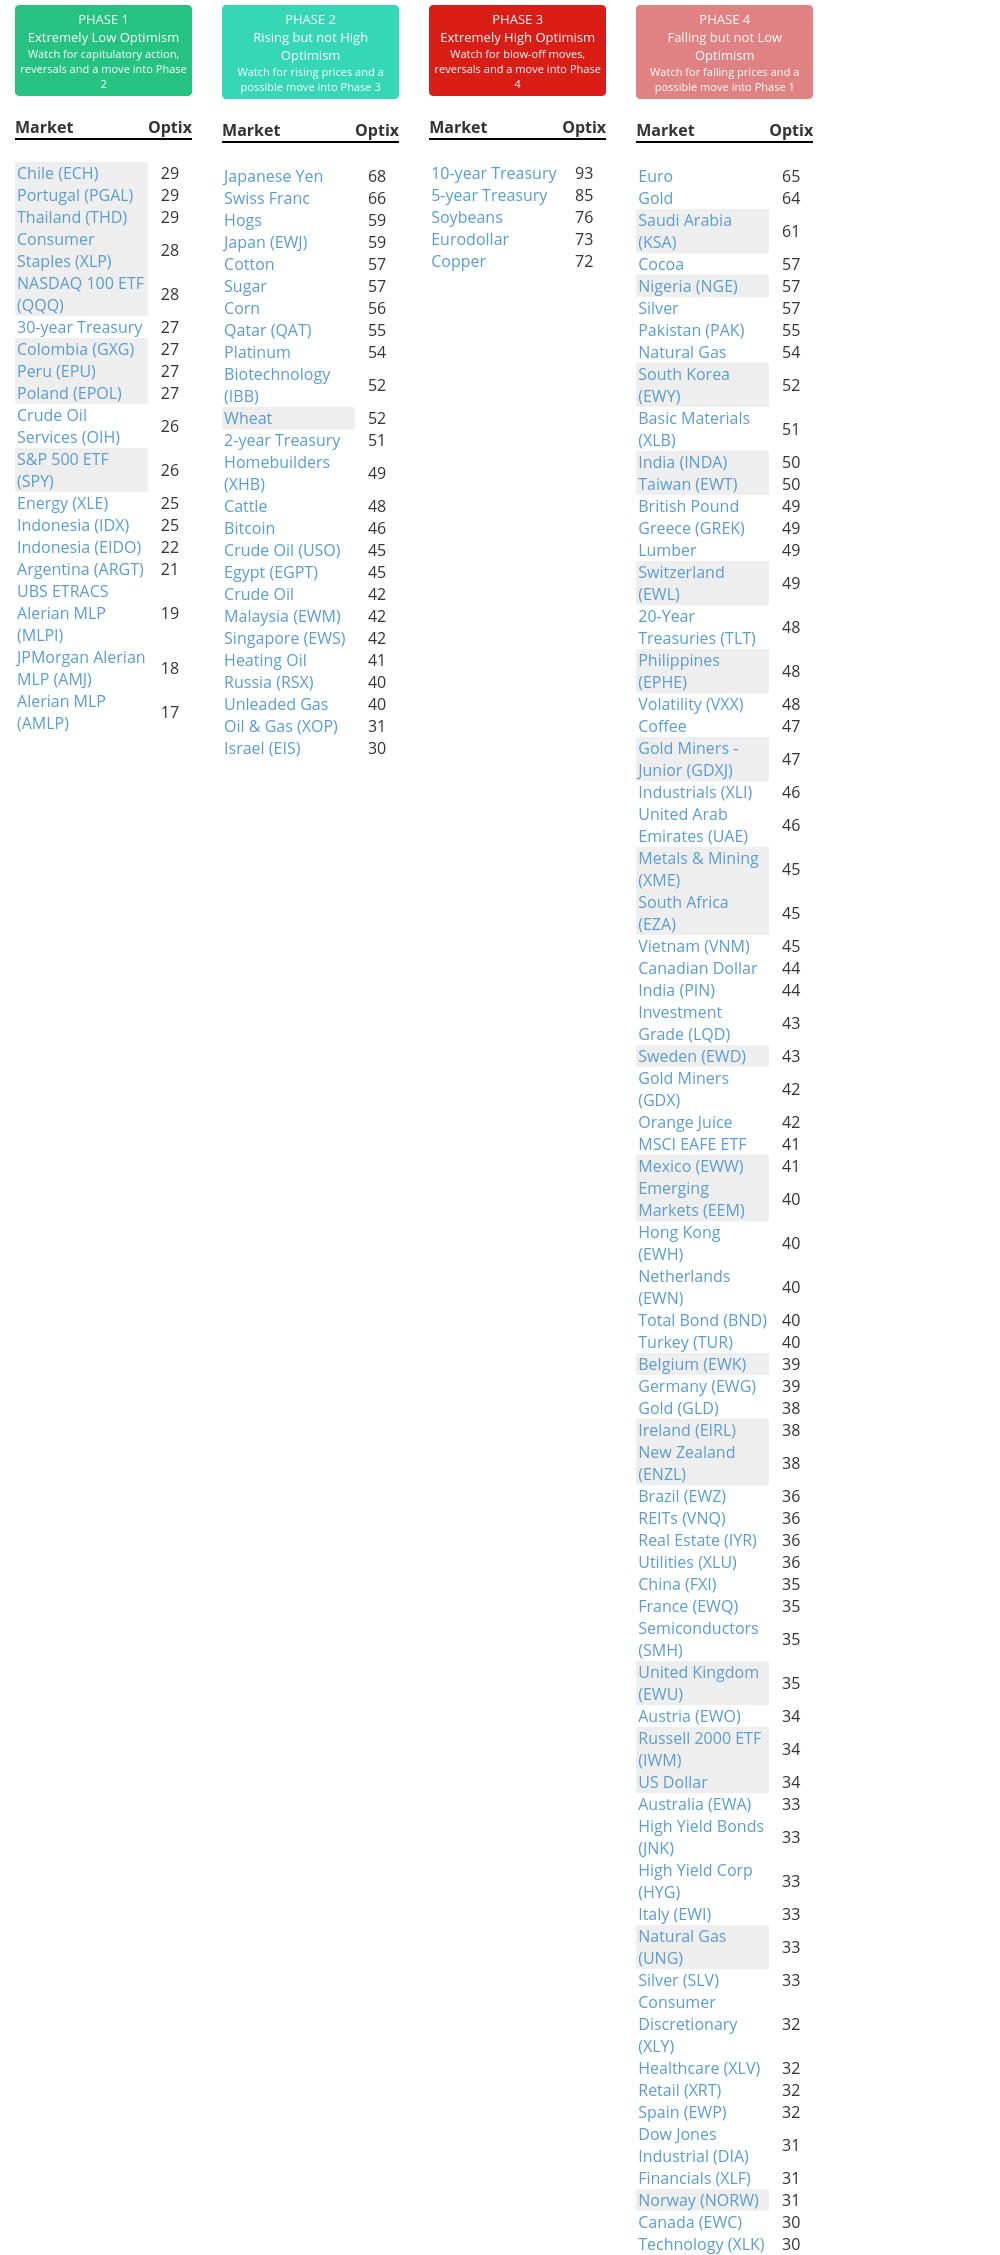
Phase Table
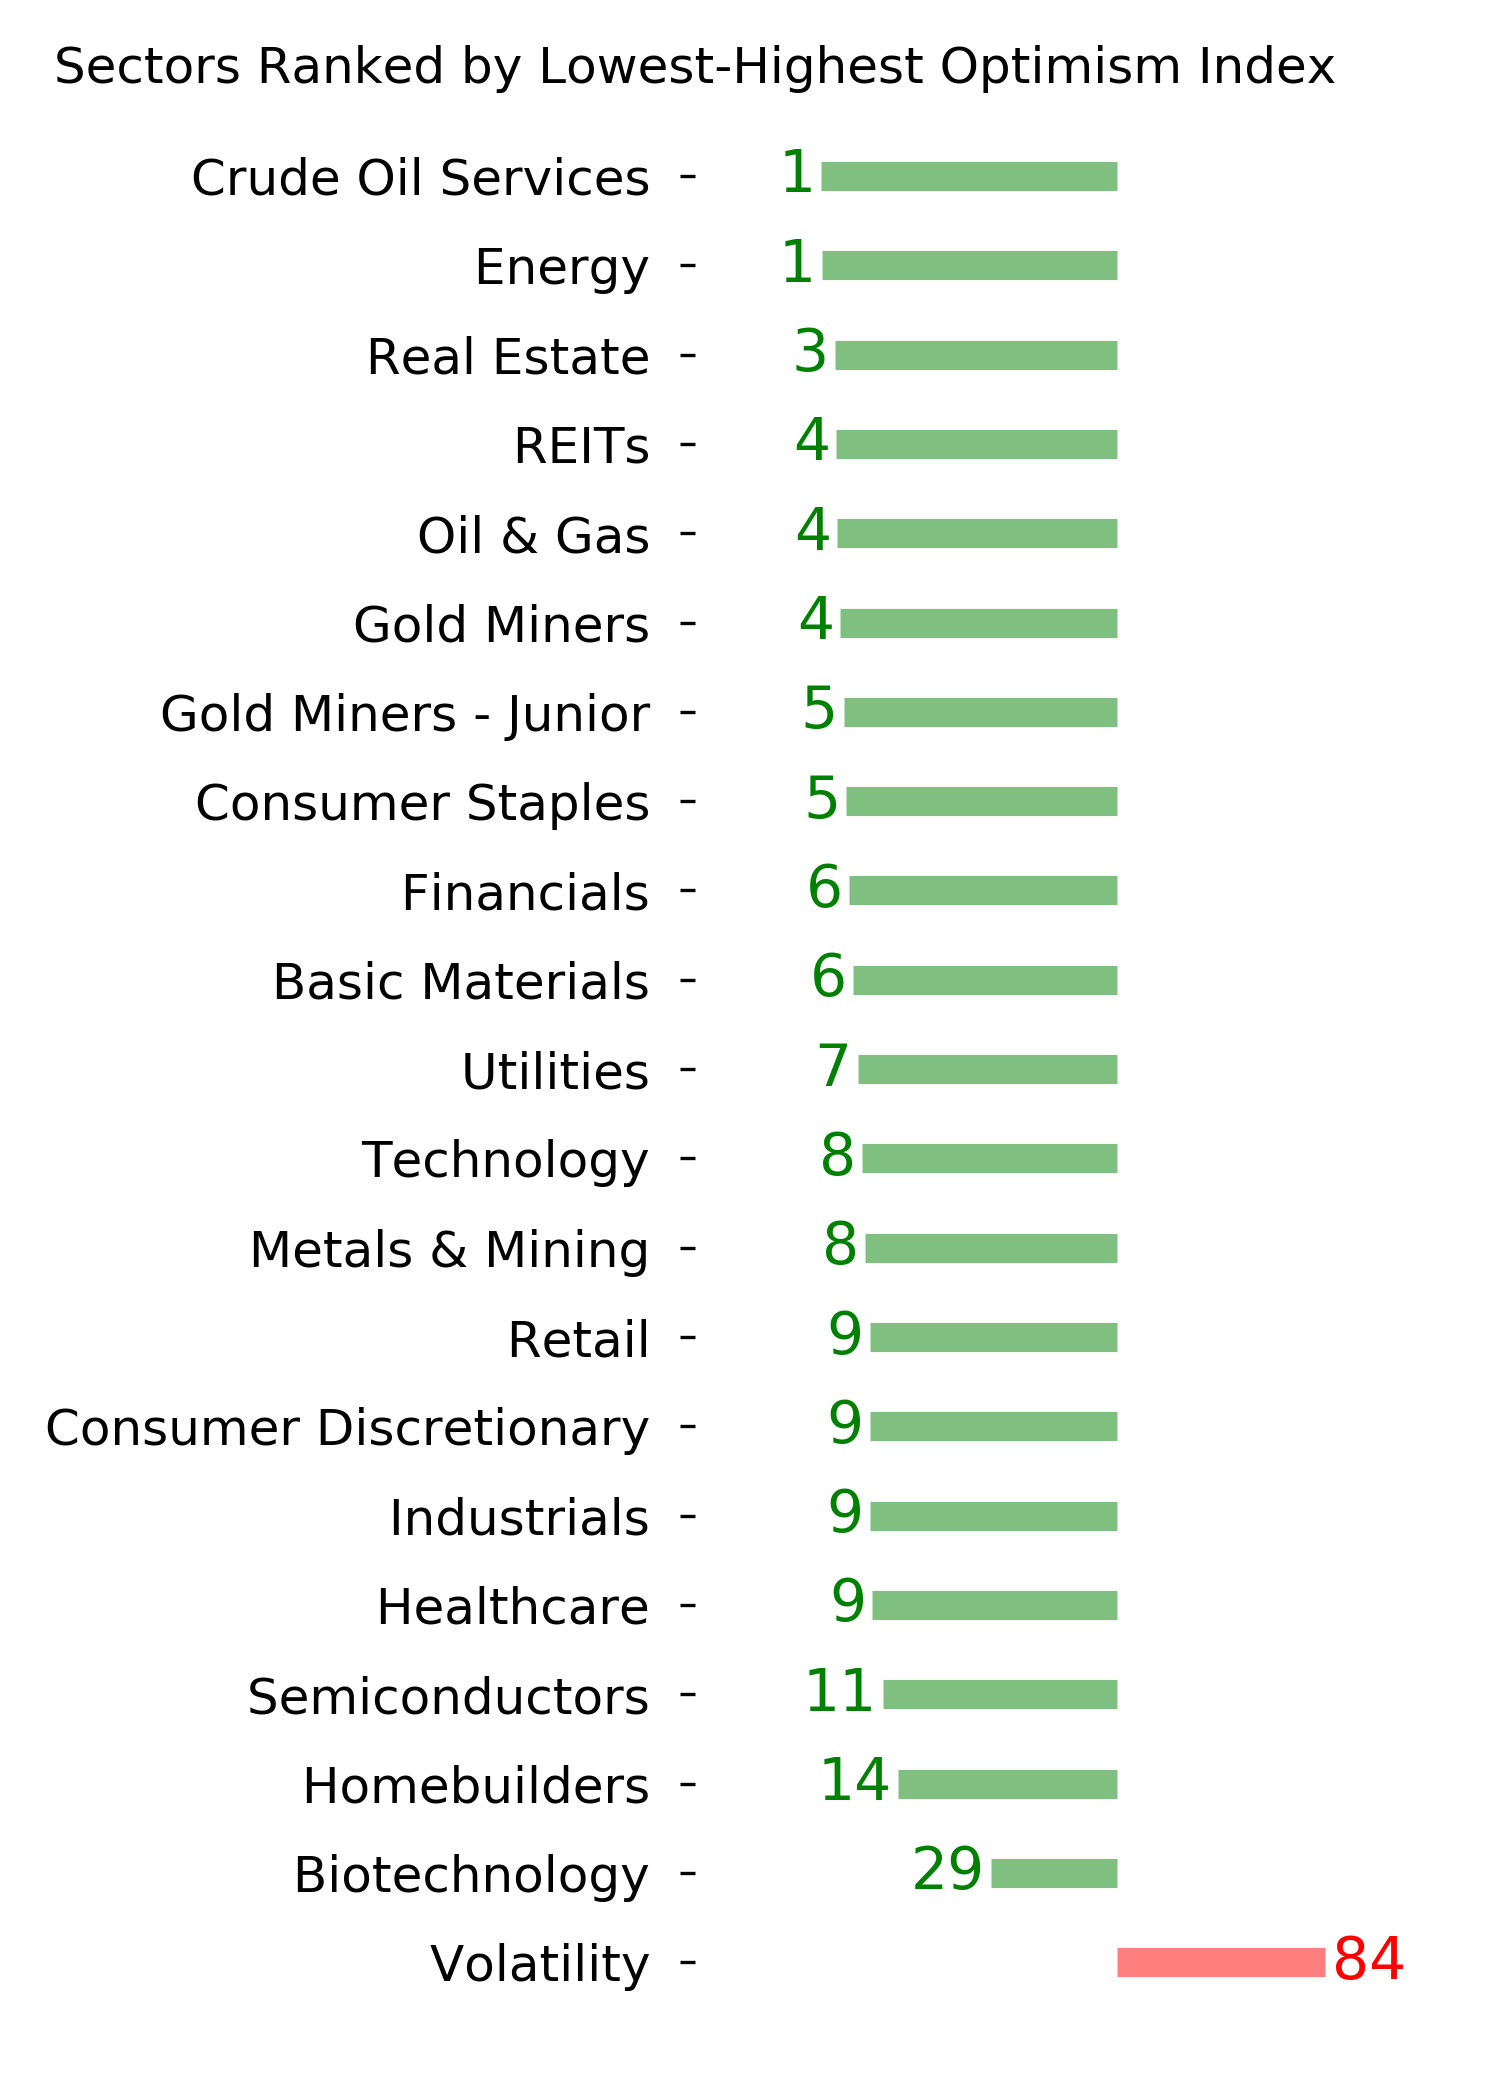
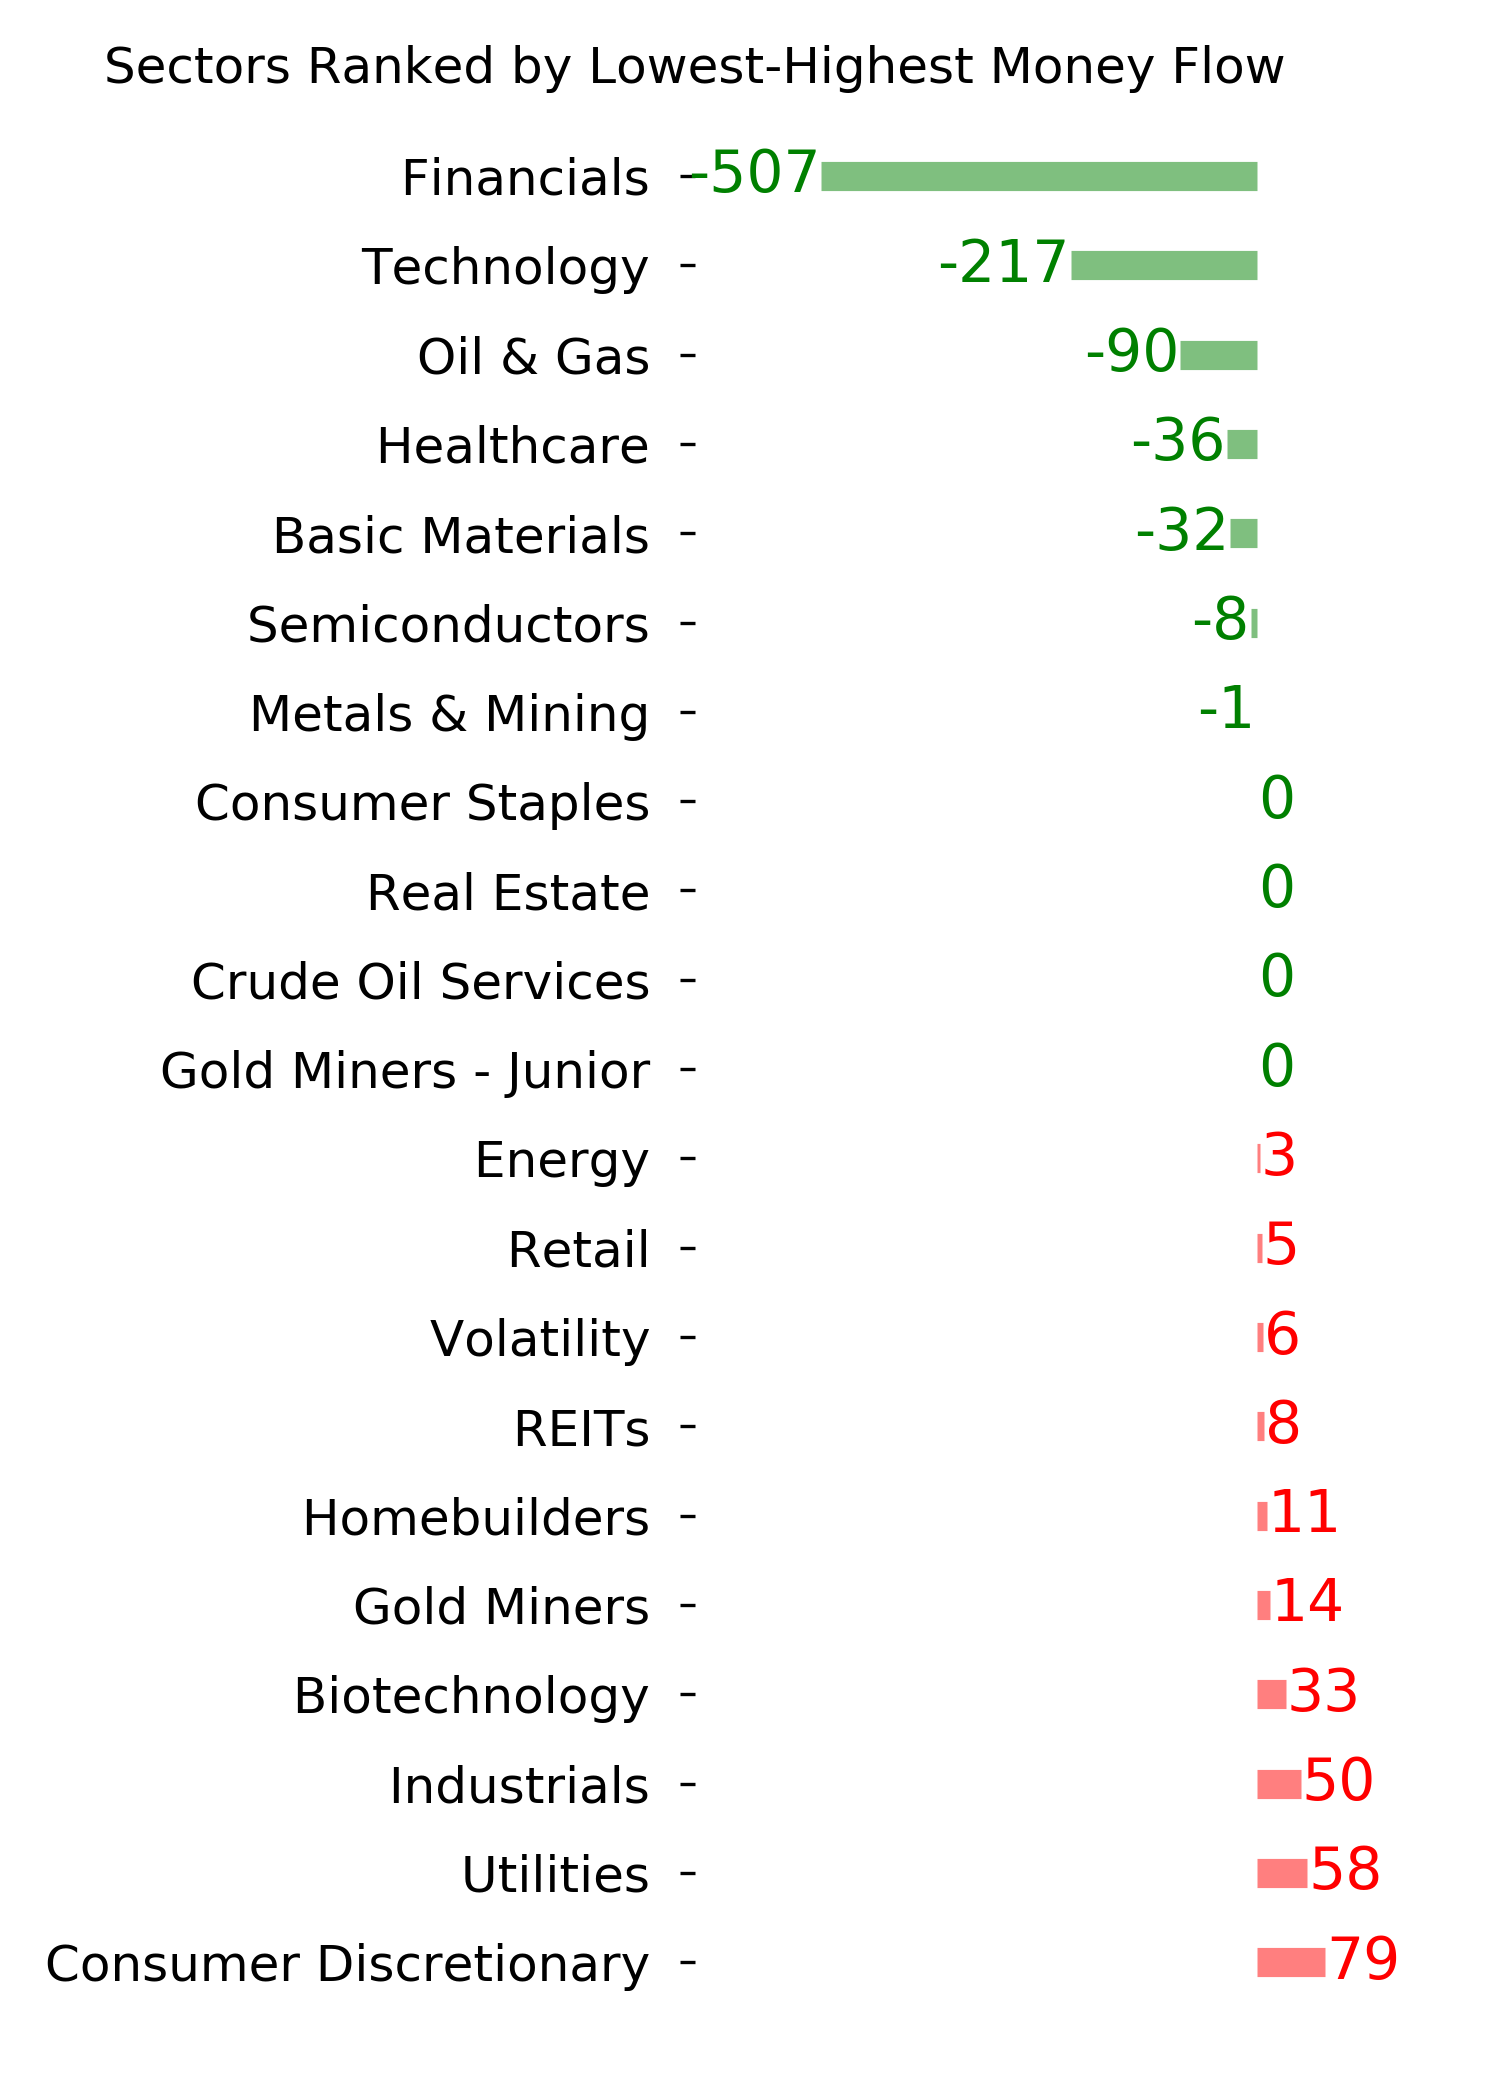
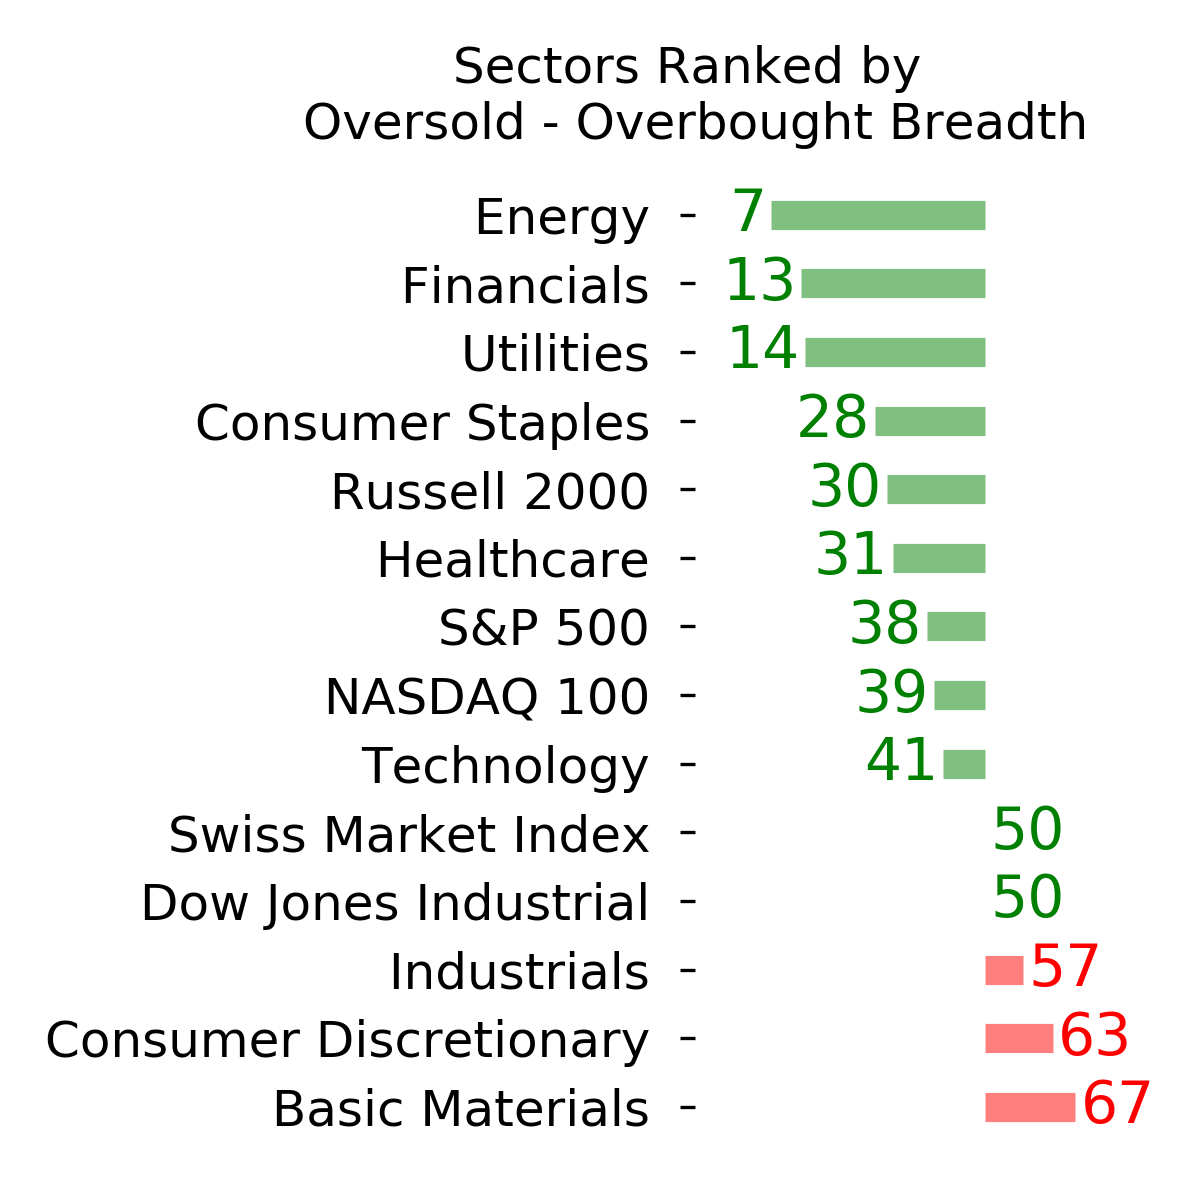
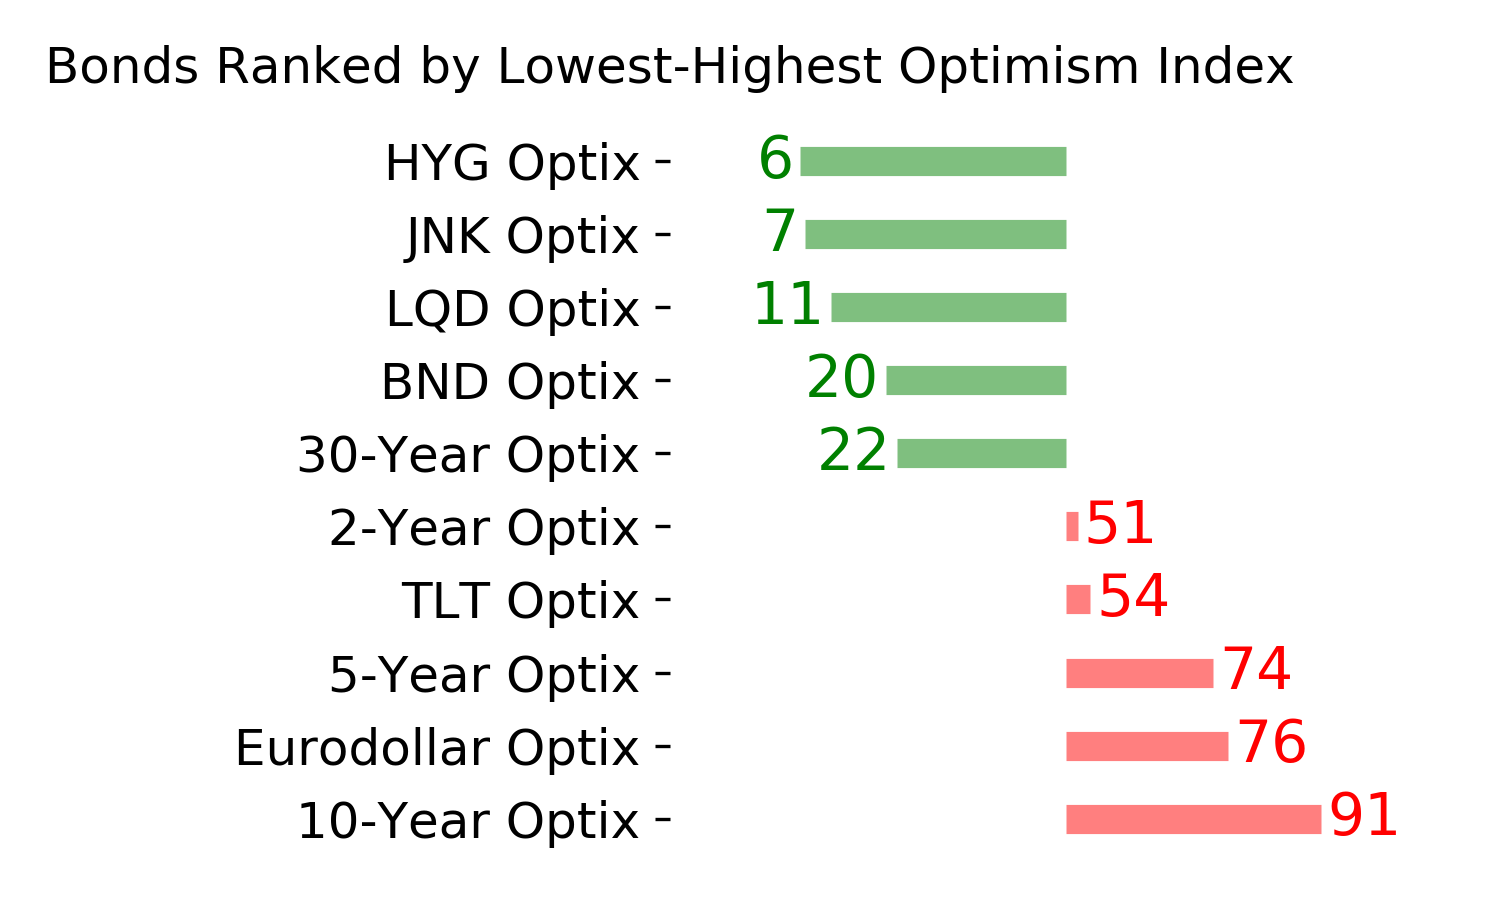
Ranks
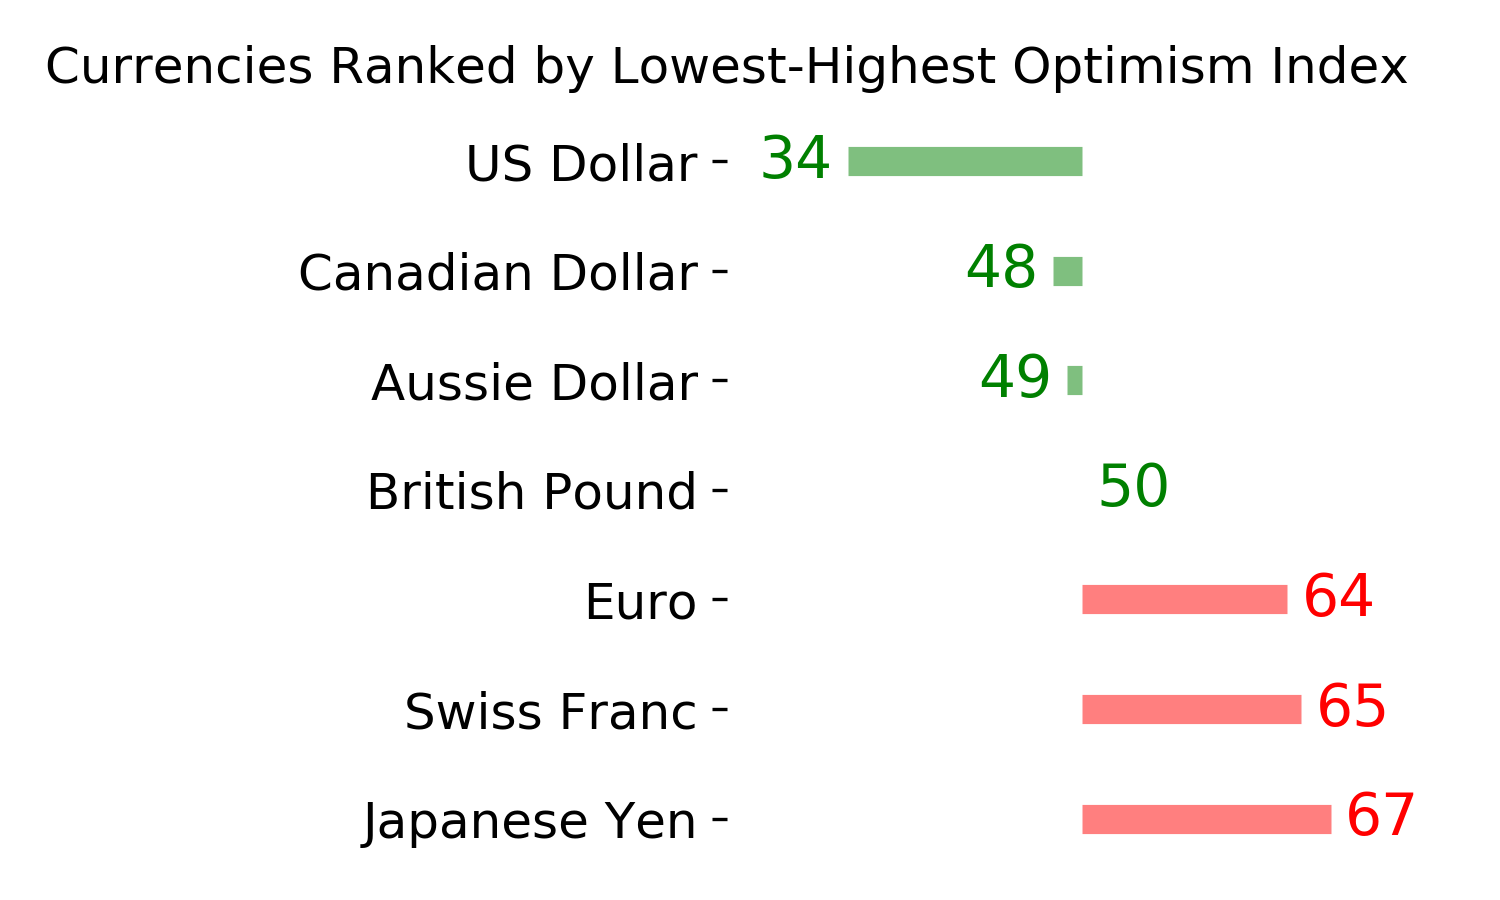
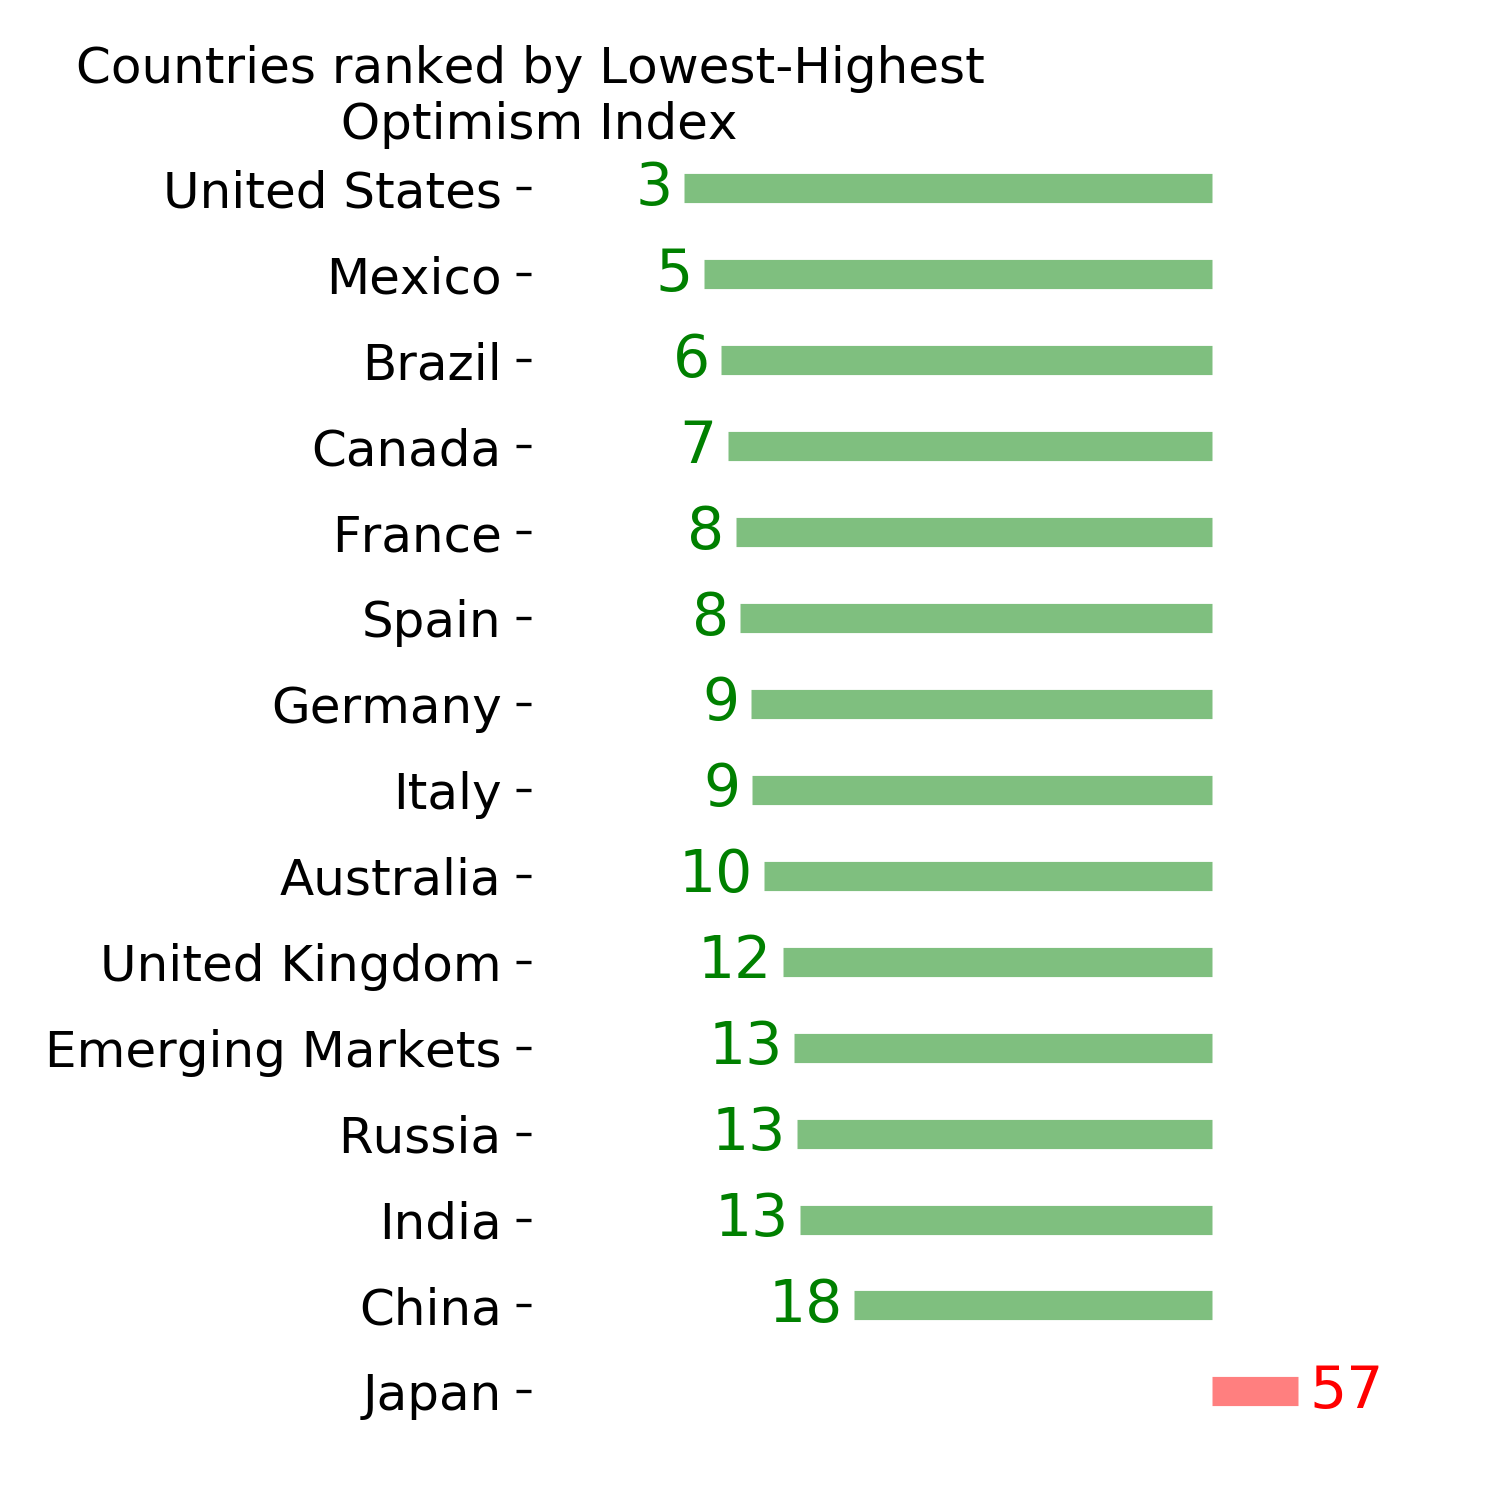
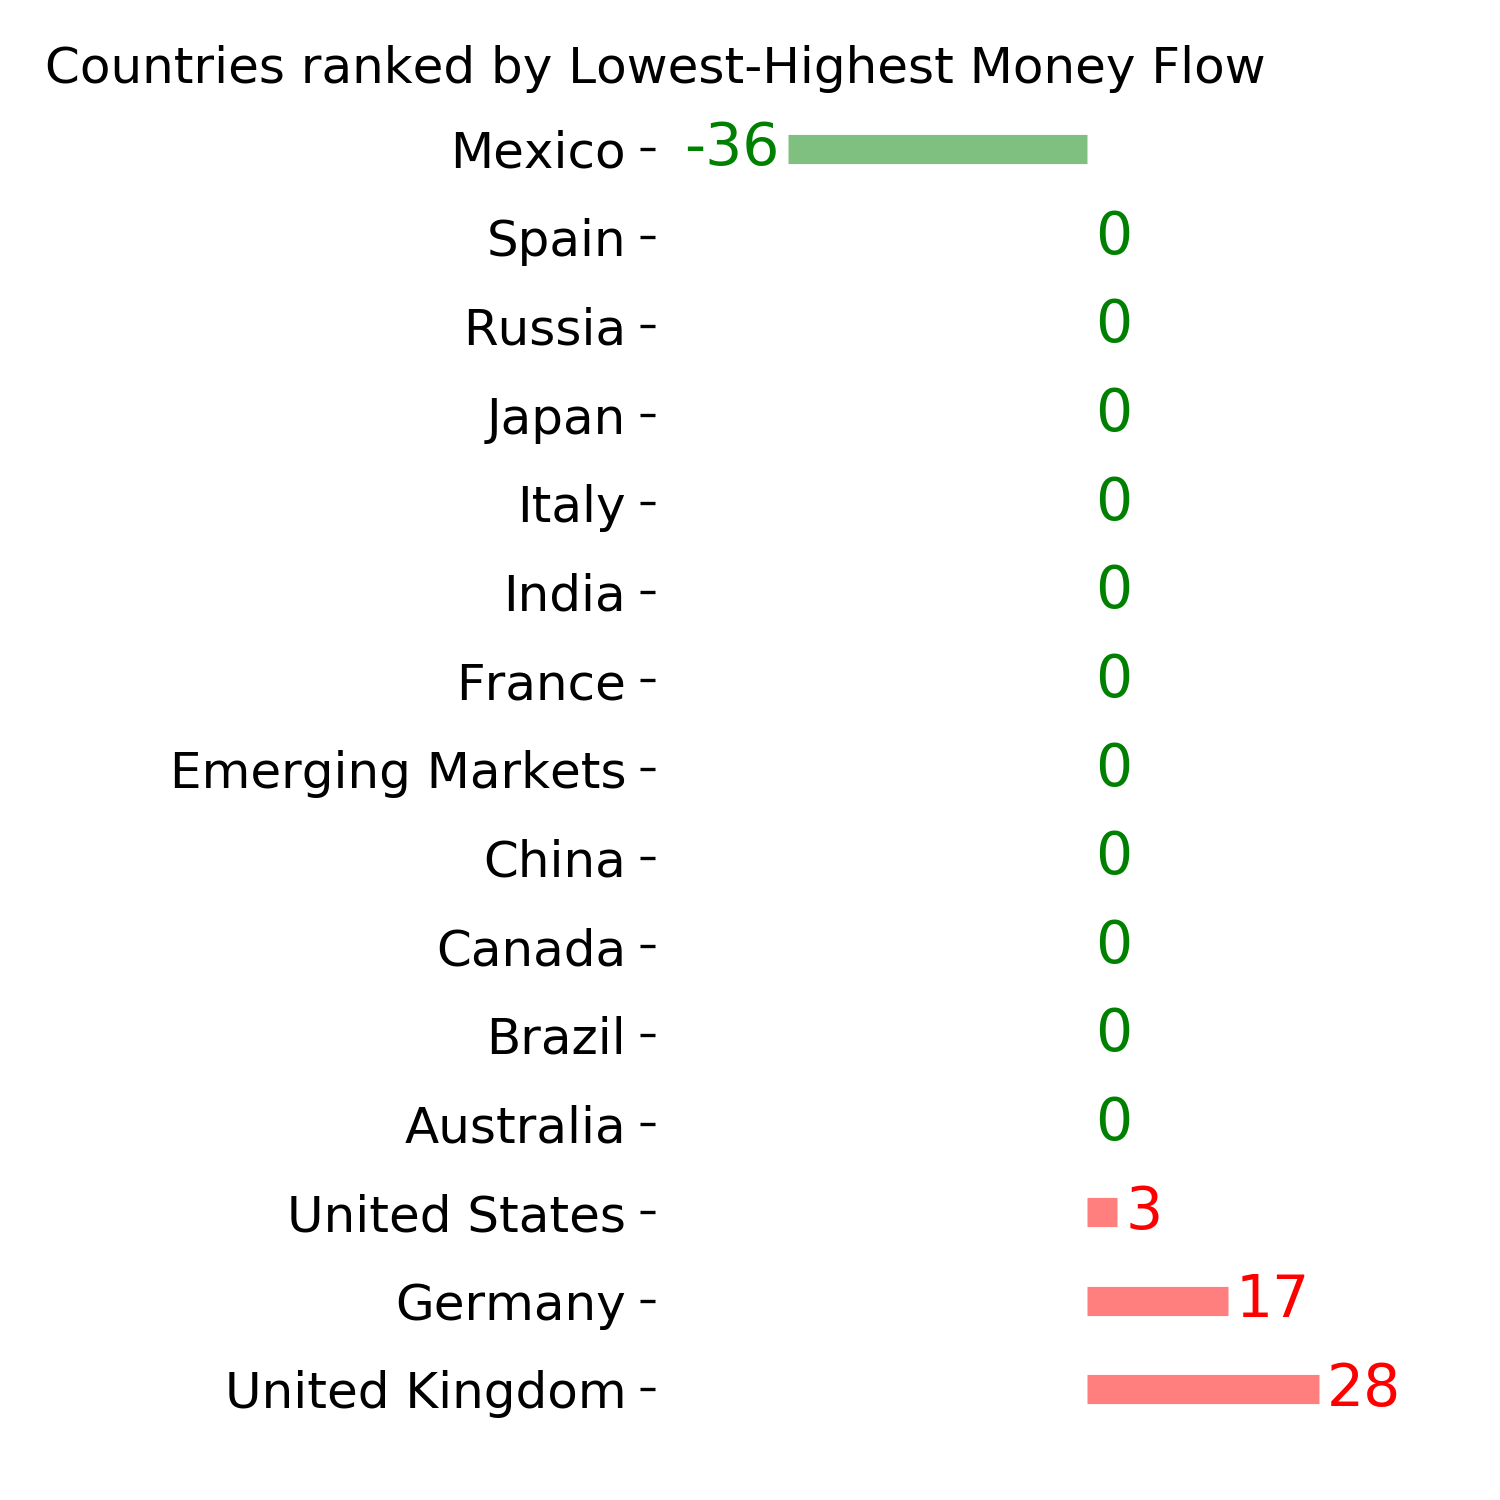
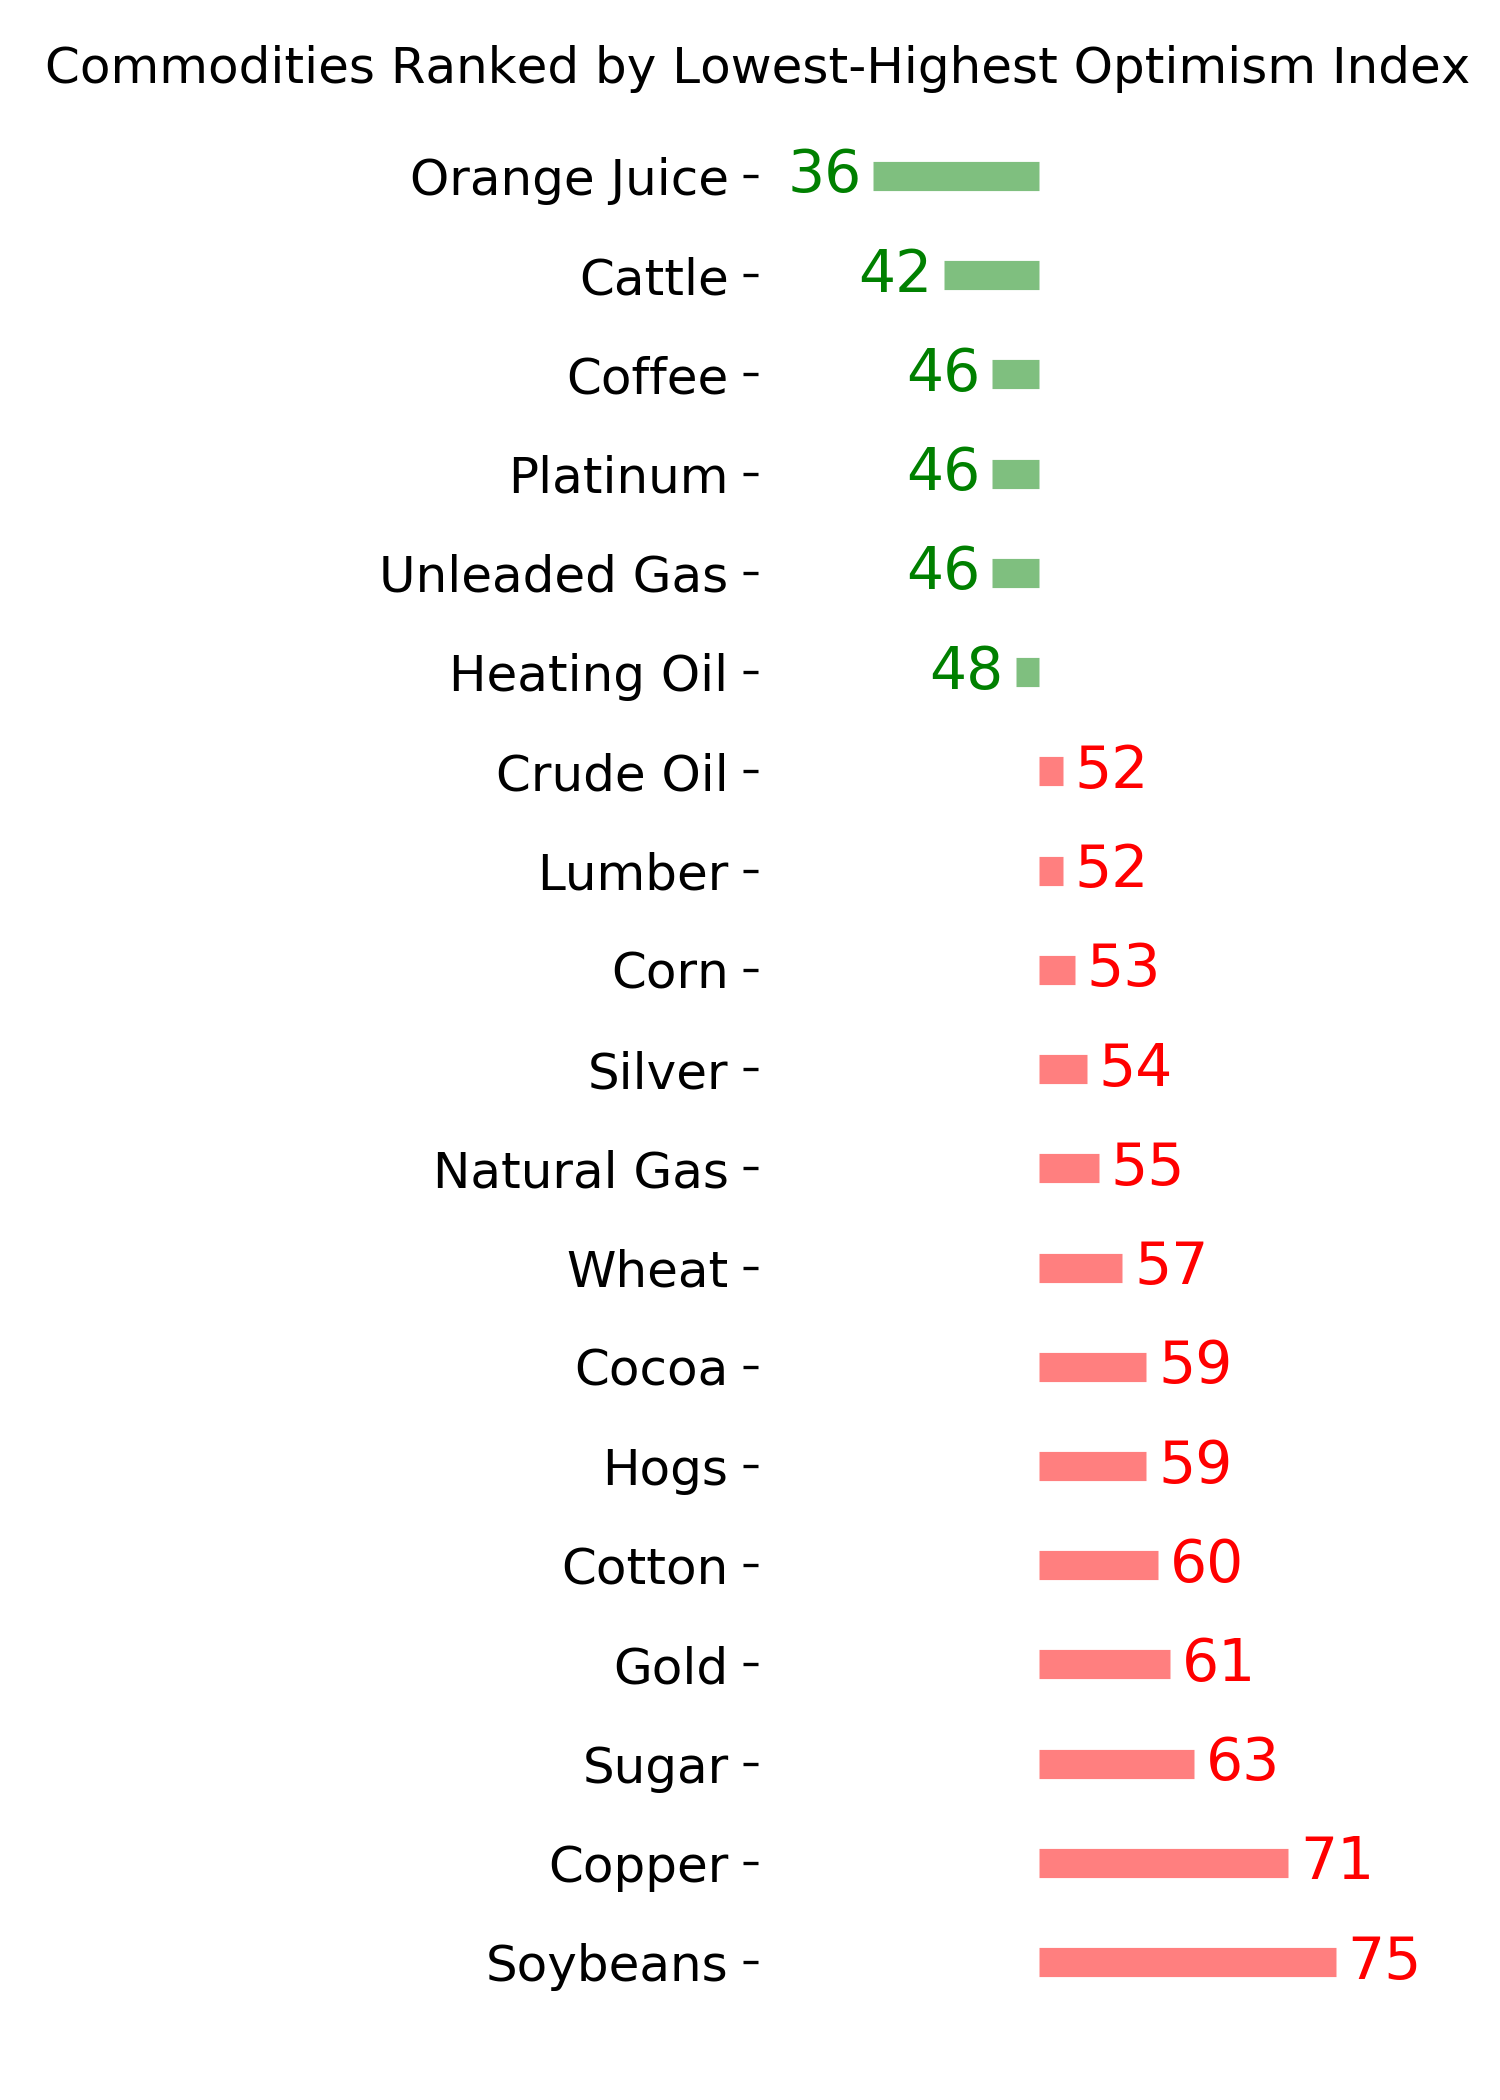
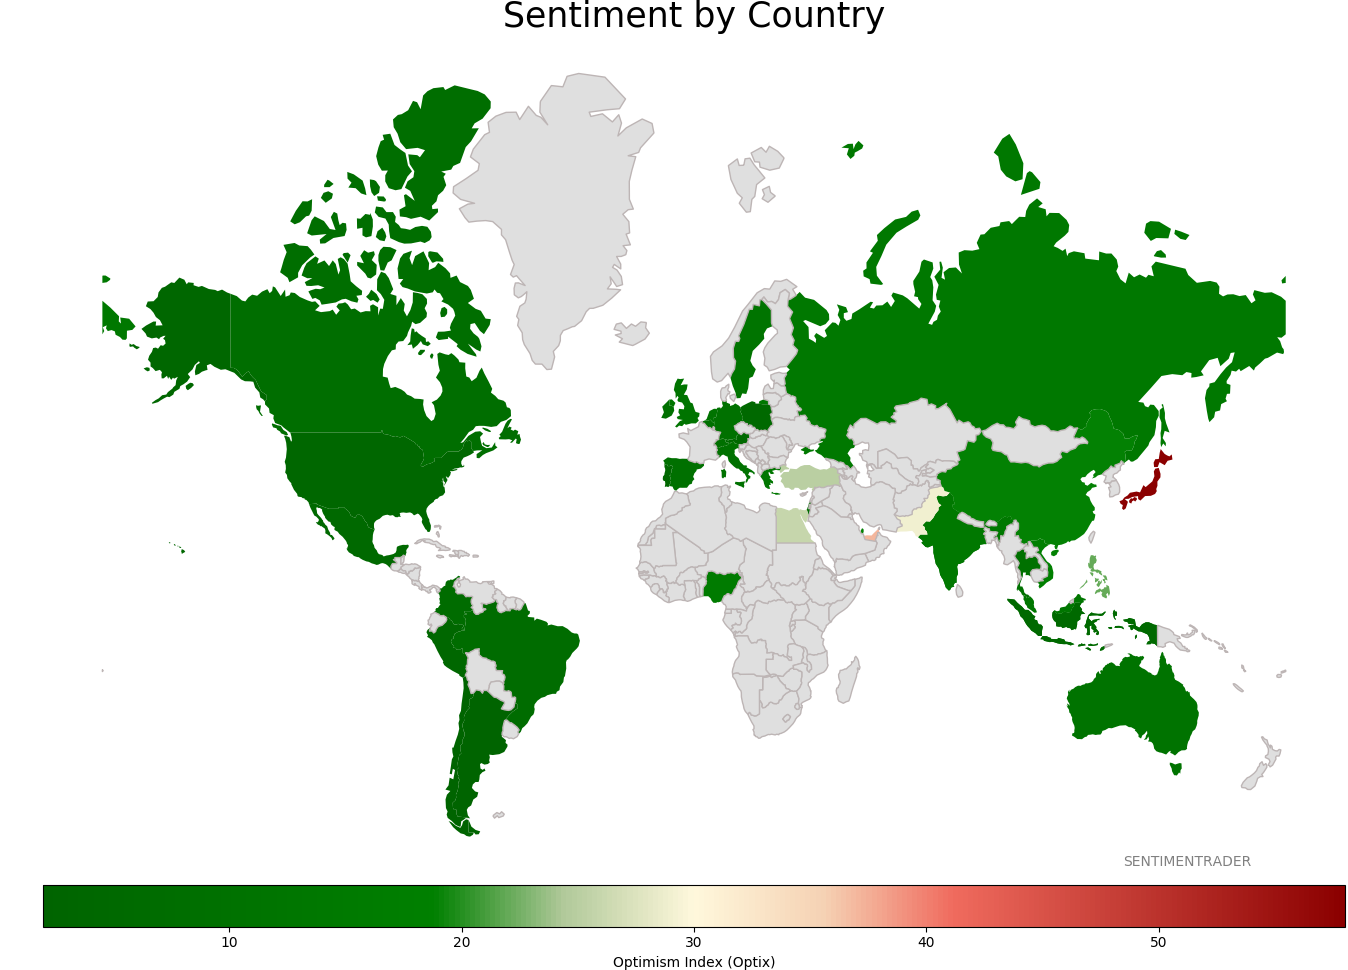
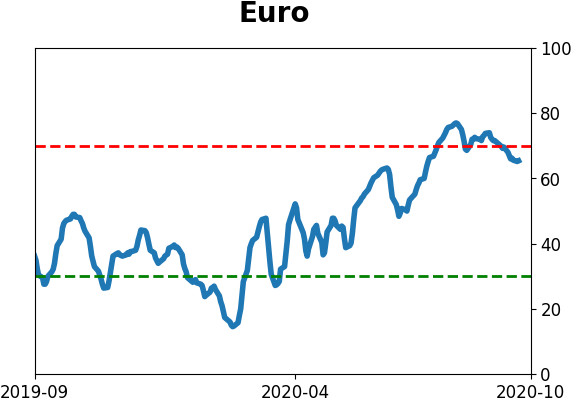
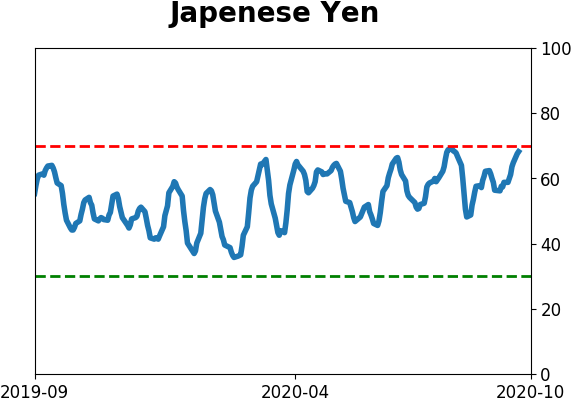
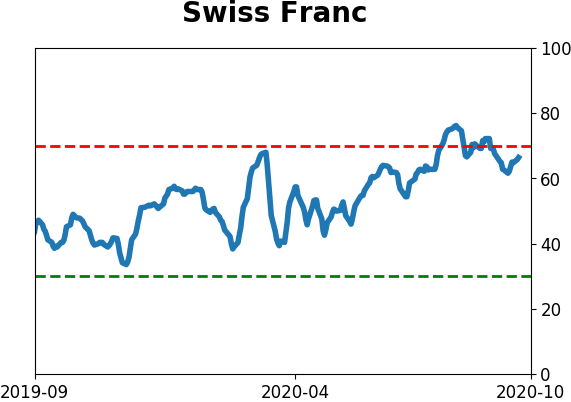
Sentiment Around The World
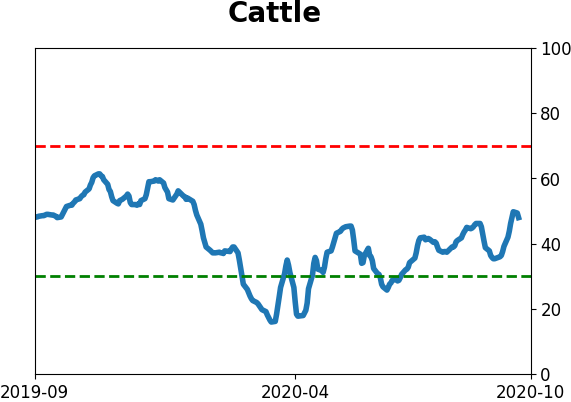
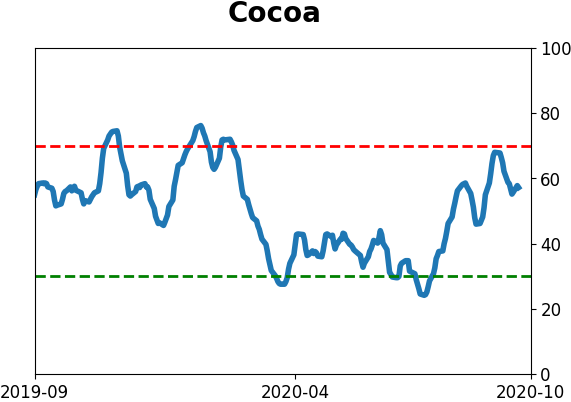
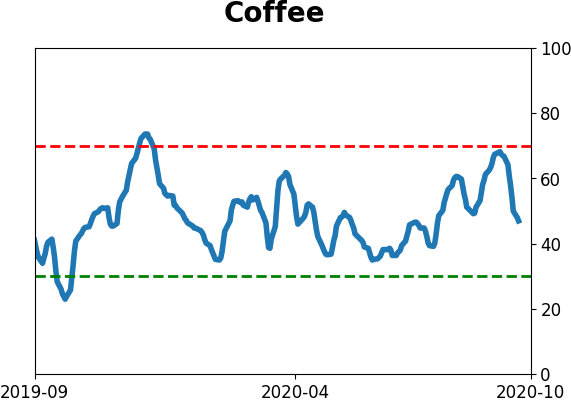
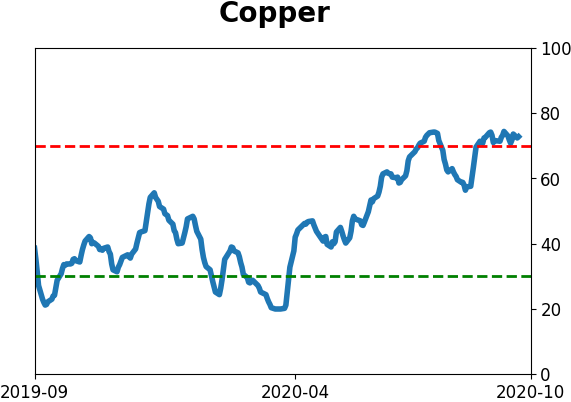
Optimism Index Thumbnails
|
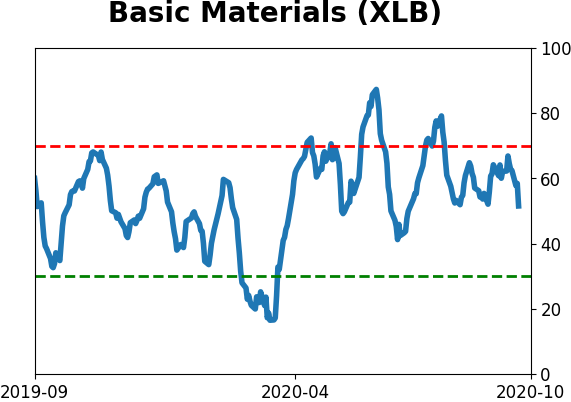
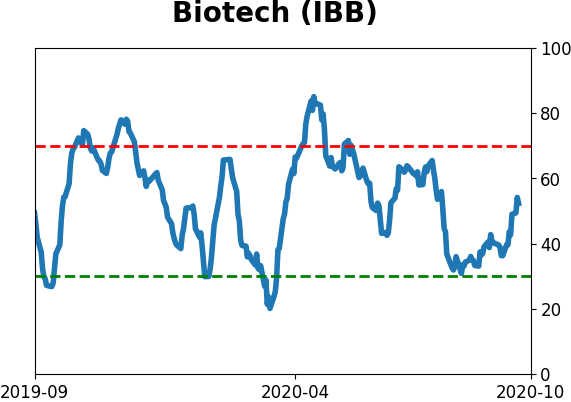
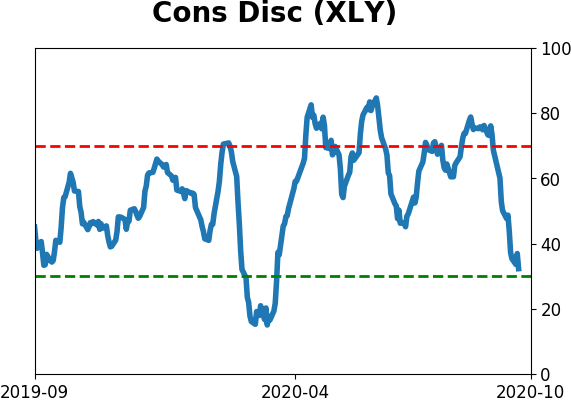
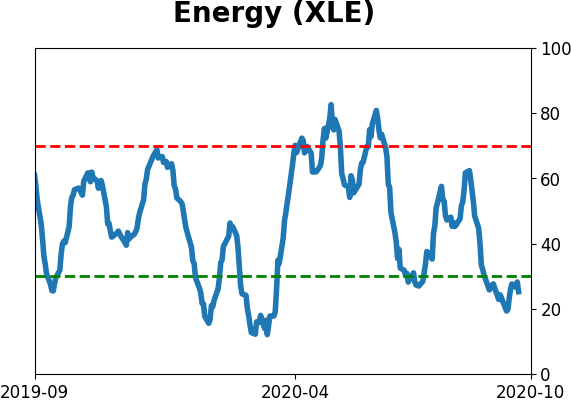
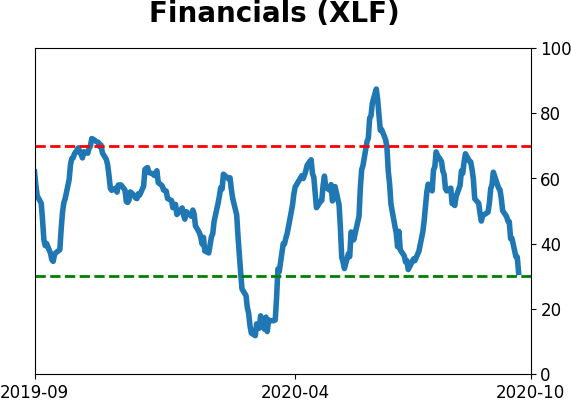
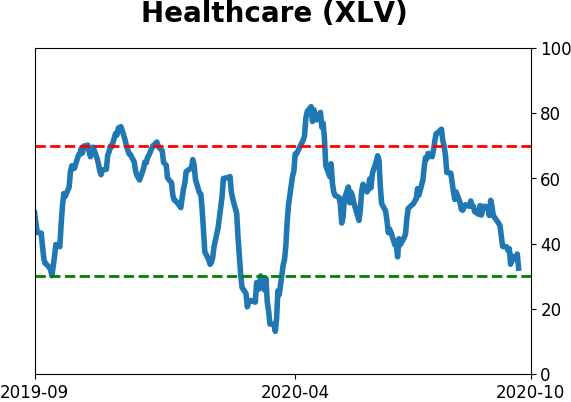
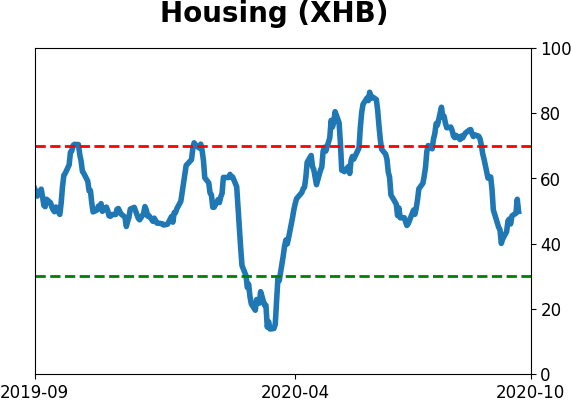
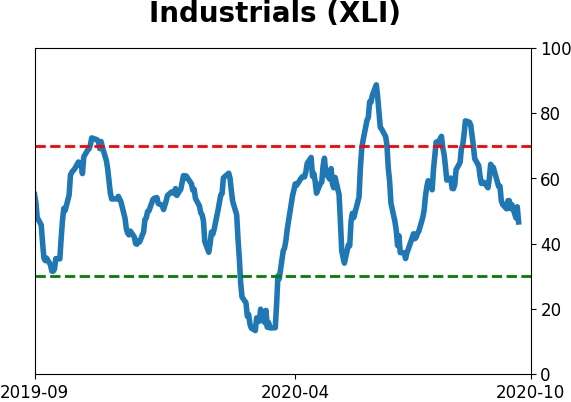
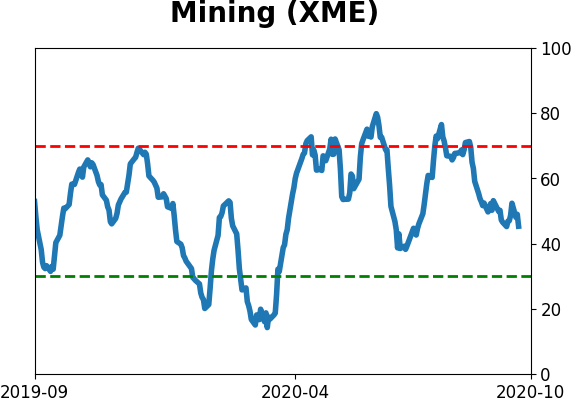
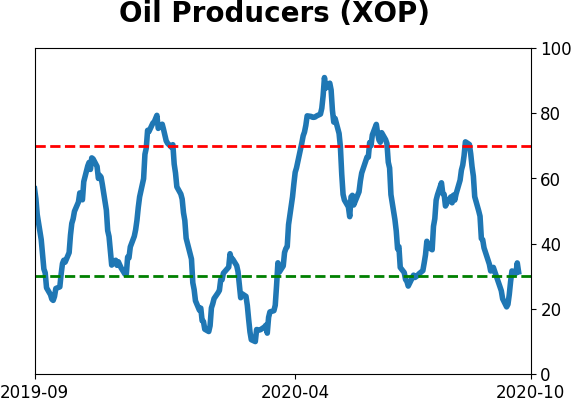
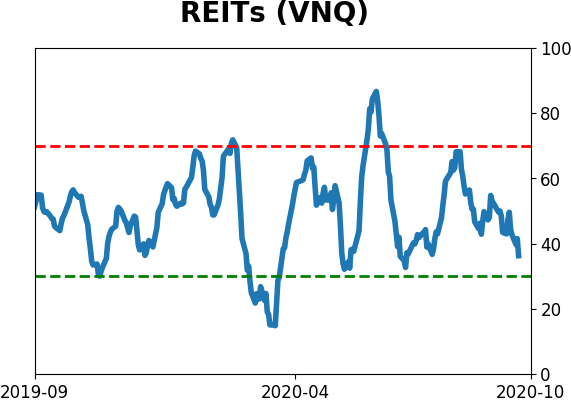
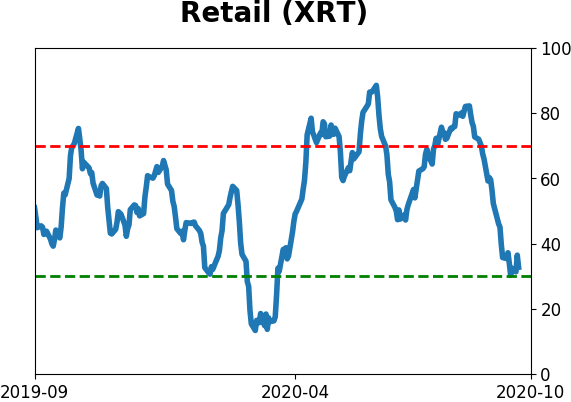
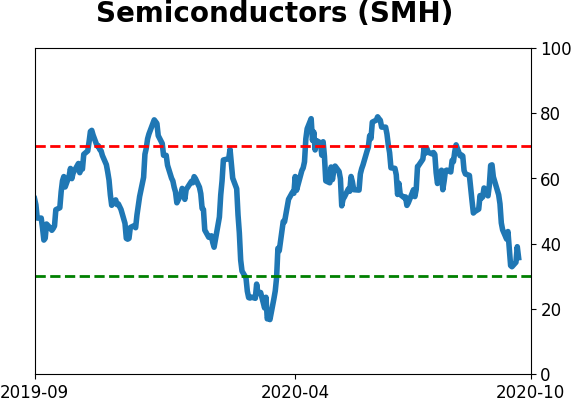
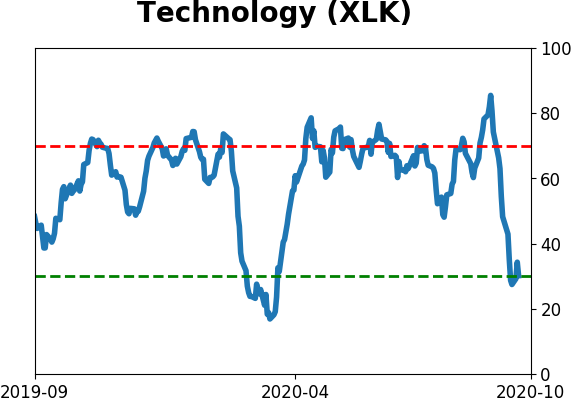
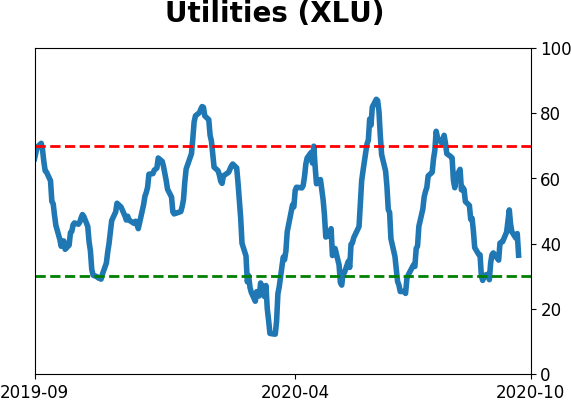
Sector ETF's - 10-Day Moving Average
|
|
|
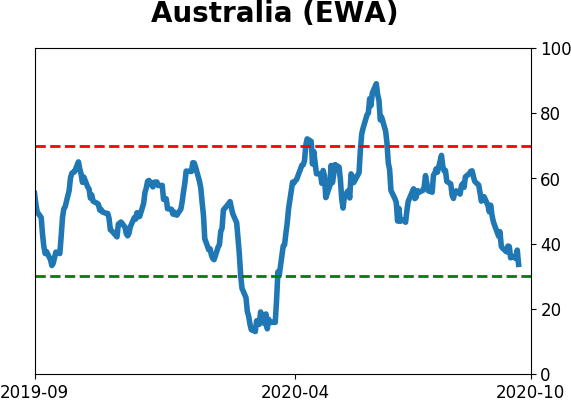
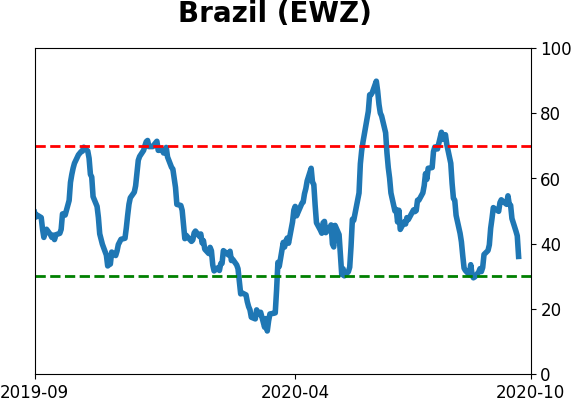
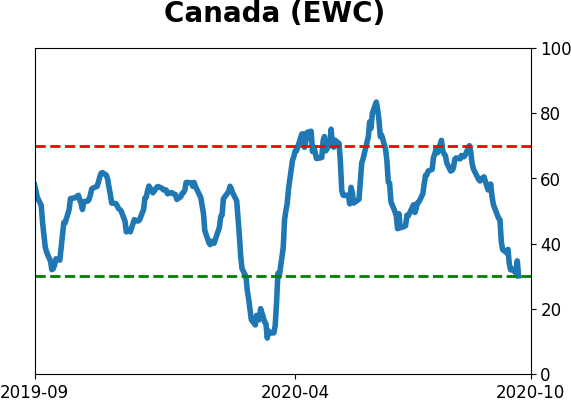
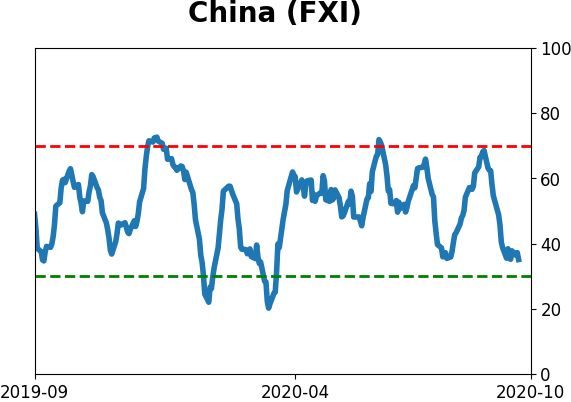
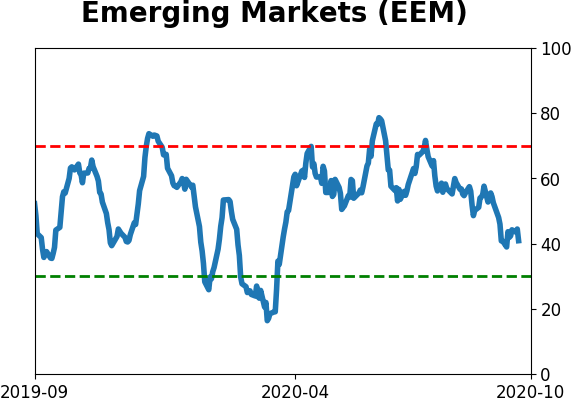
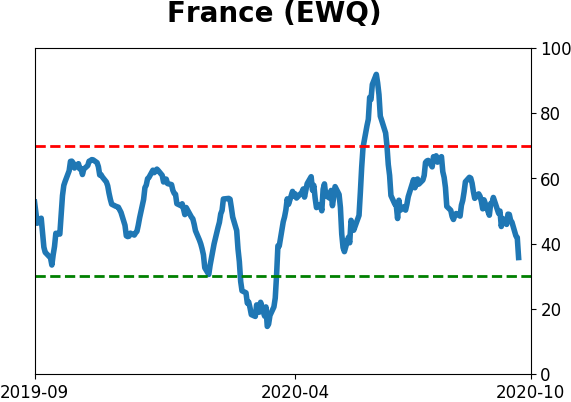
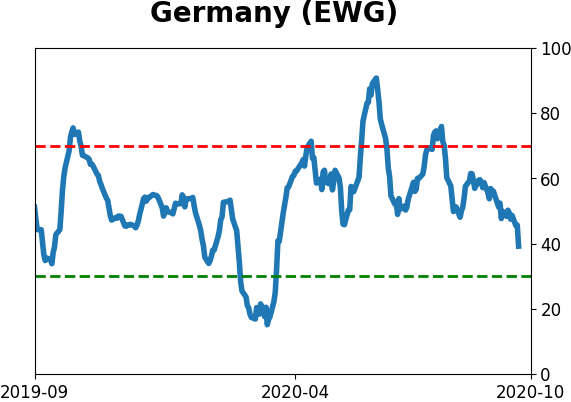
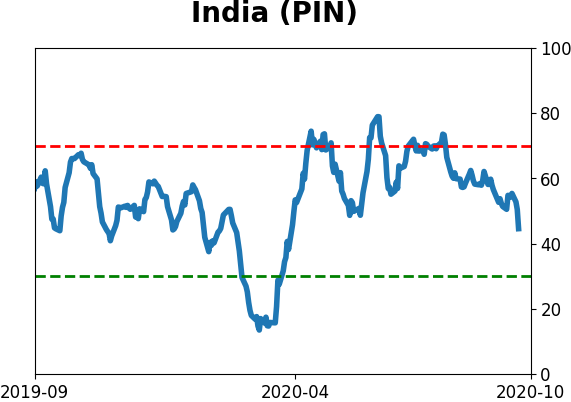
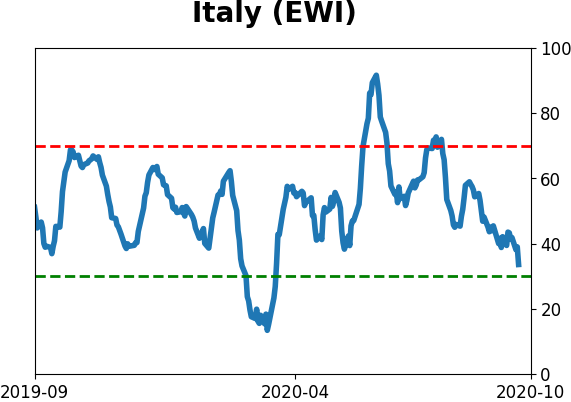
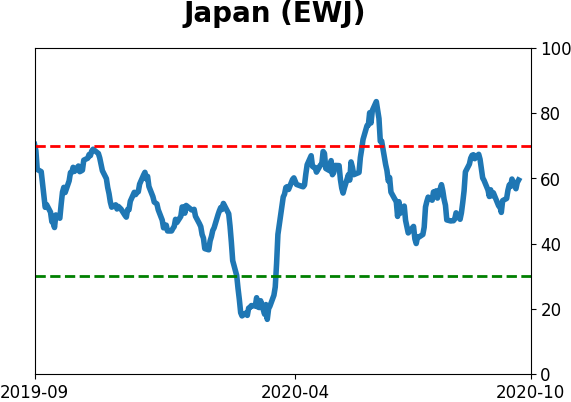
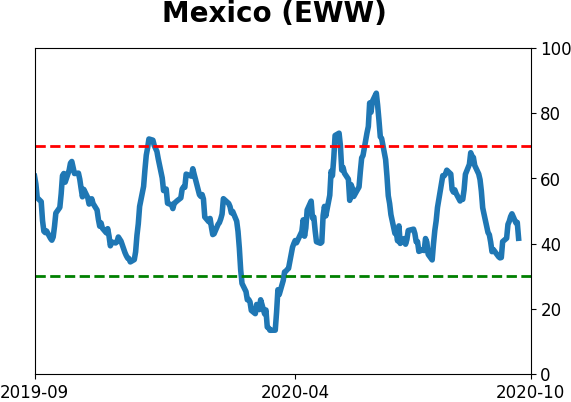
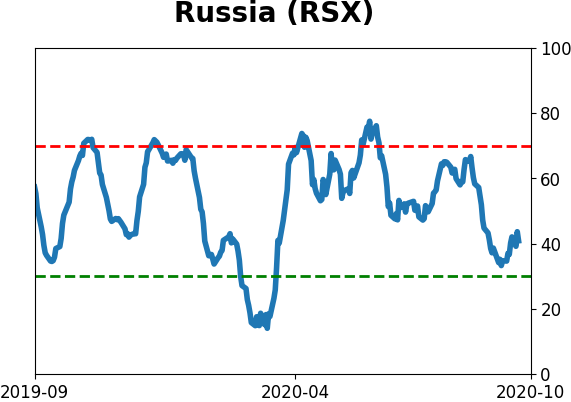
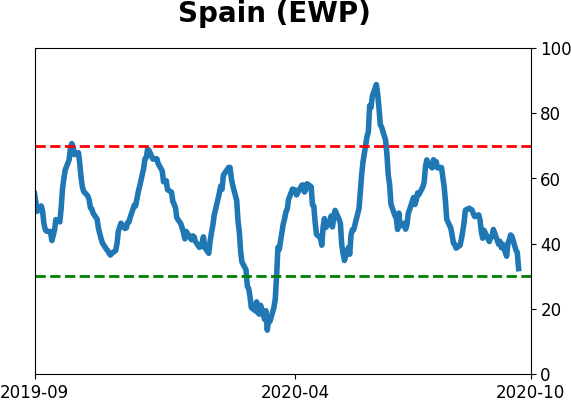
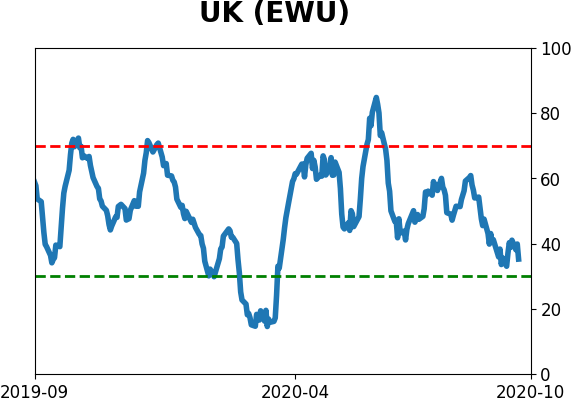
Country ETF's - 10-Day Moving Average
|
|
|
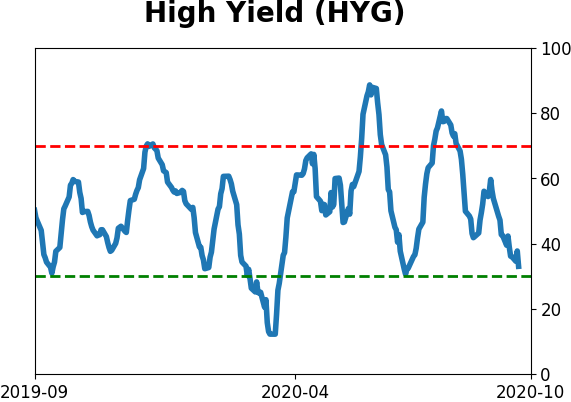
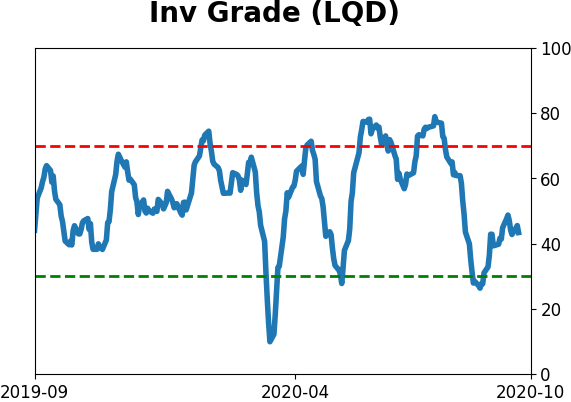
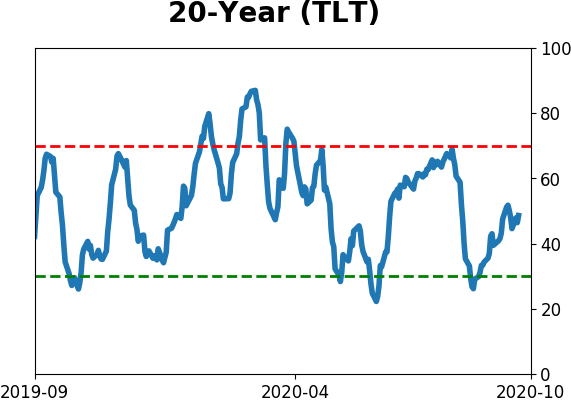
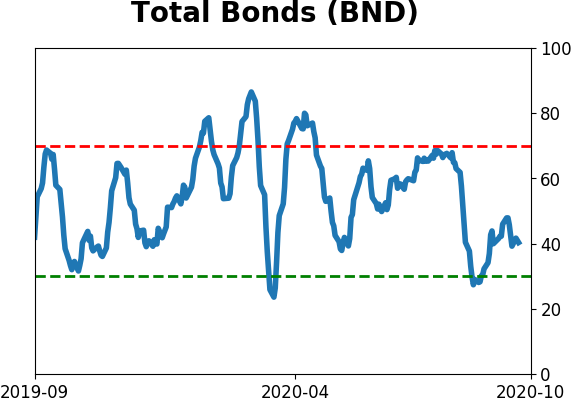
Bond ETF's - 10-Day Moving Average
|
|
|
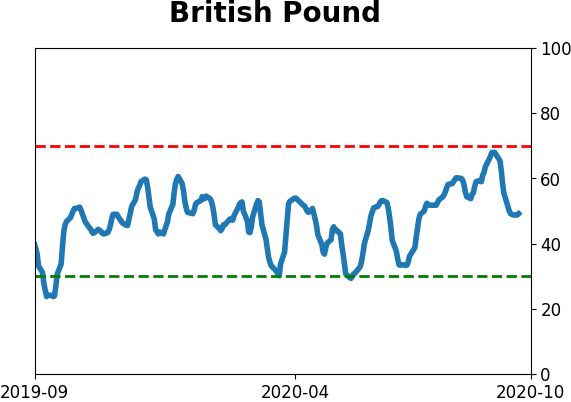
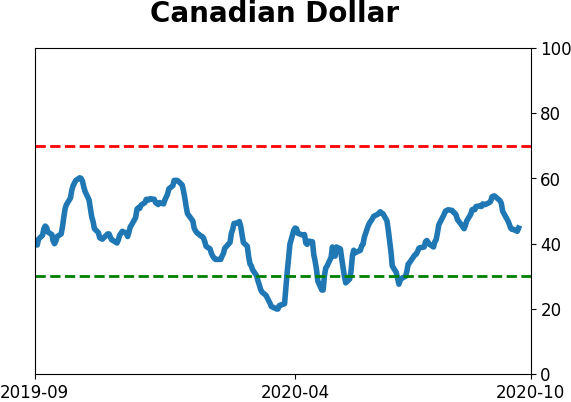
Currency ETF's - 5-Day Moving Average
|
|
|
Commodity ETF's - 5-Day Moving Average
|
|