Headlines
|
|
Financial stocks break out, broadly:
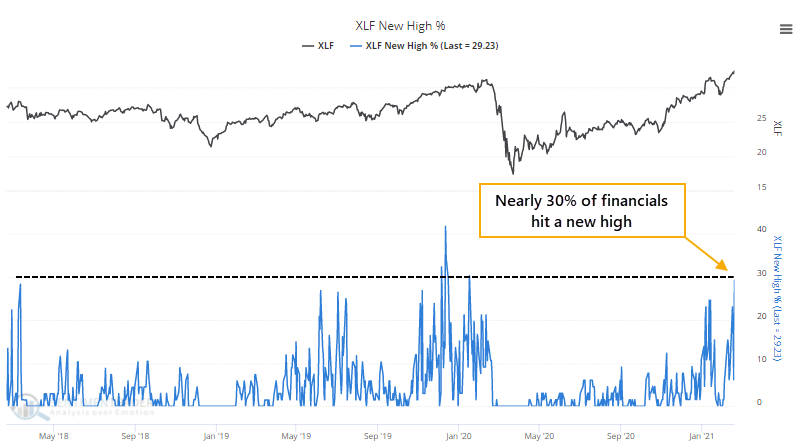
The financial sector broke out to new highs last week, with good support among member stocks. Nearly 30% of financial stocks reached a 52-week high, the most in a year. That's supposed to be a good sign, but the evidence is mixed.
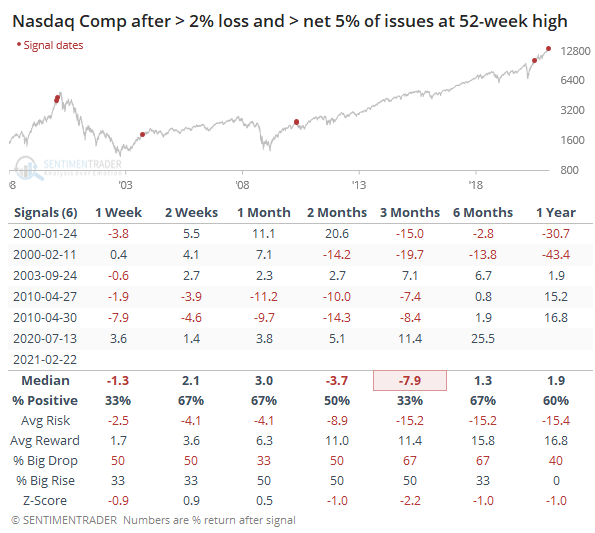
Still so many new highs: Thanks to increasingly easy comparisons from a year ago, and a deluge of SPACs and other detritus, the number of securities hitting 52-week highs on the Nasdaq continued to overwhelm the number falling to 52-week lows, even though the Composite lost more than 2% on the day. Today marked only the 2nd time since at least 1984 when the Nasdaq lost more than 2% and yet more than a net of 8% of securities on the Nasdaq exchange hit a 52-week high. The other day was January 24, 2000. The table below shows all days since '84 when the Nasdaq lost 2% or more and yet more than a net 5% of issues reached 52-week highs.
Bottom Line:
See the Outlook & Allocations page for more details on these summaries STOCKS: Weak sell
We're in an extremely speculative environment that is enough to become defensive, especially with recent cracks showing in what had been pristine breadth conditions. The spike in fear from a couple of weeks ago has dissipated and likely not enough to offset the negatives over a medium-term time frame. BONDS: Weak buy
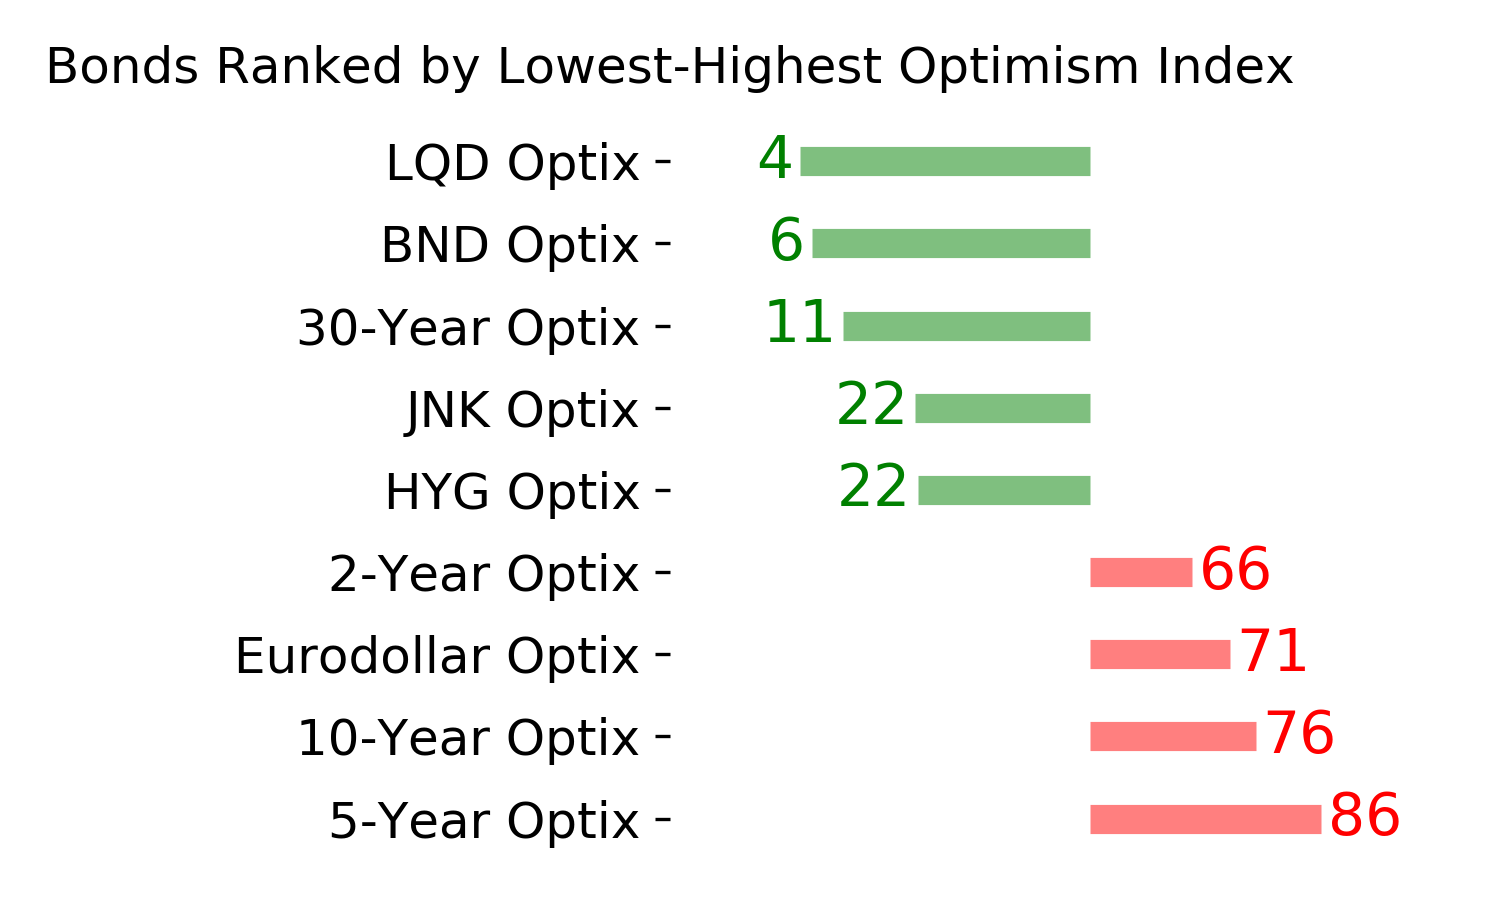
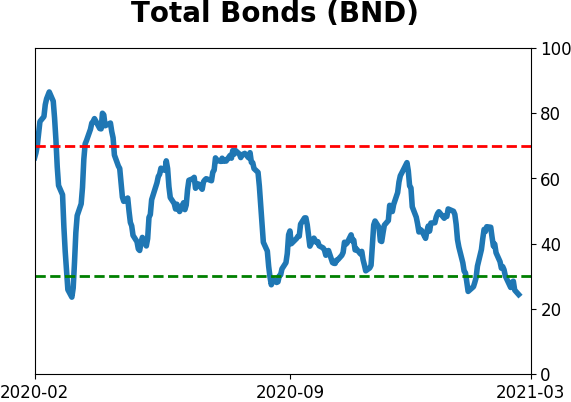
Various parts of the market have been hit in recent weeks, with mild oversold conditions. The Bond Optimism Index is now about as low as it gets during healthy bond market environments. GOLD: Weak buy
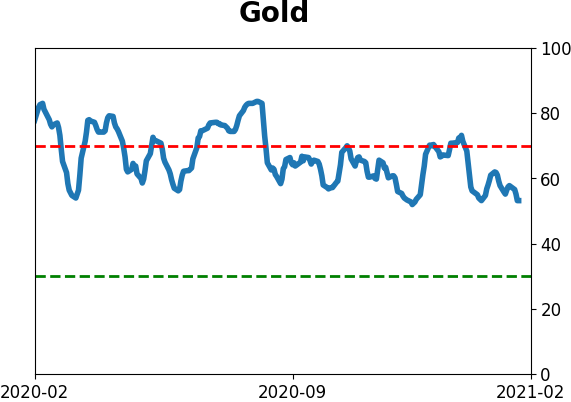
A dollar trying to rebound from a severe short position has weighed on gold and miners. The types of signals they've given in recent weeks, within the context of their recent surge, have usually resulted in higher prices over a medium- to long-term time frame.
|
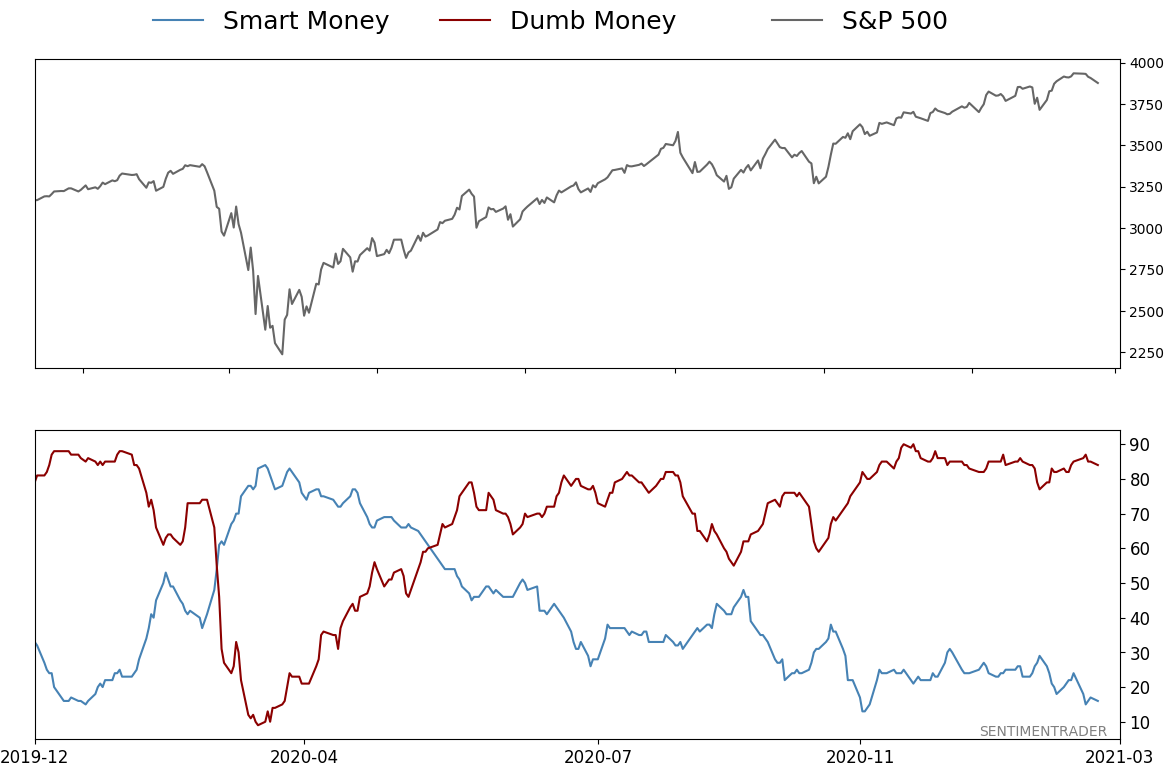
Smart / Dumb Money Confidence
|
Smart Money Confidence: 16%
Dumb Money Confidence: 84%
|
|
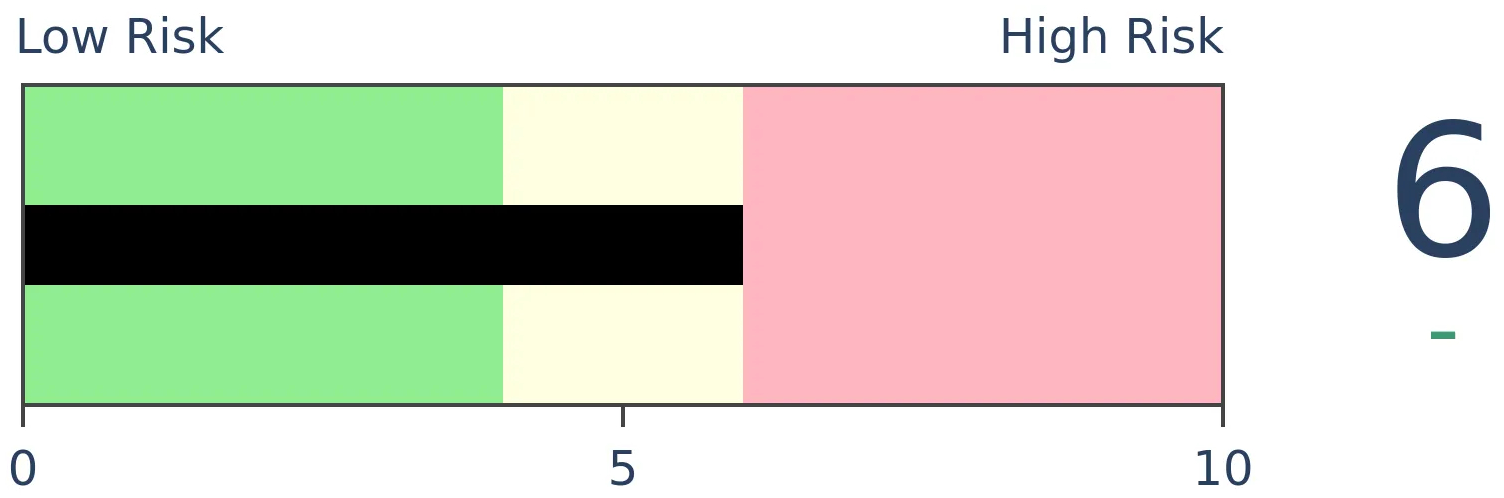
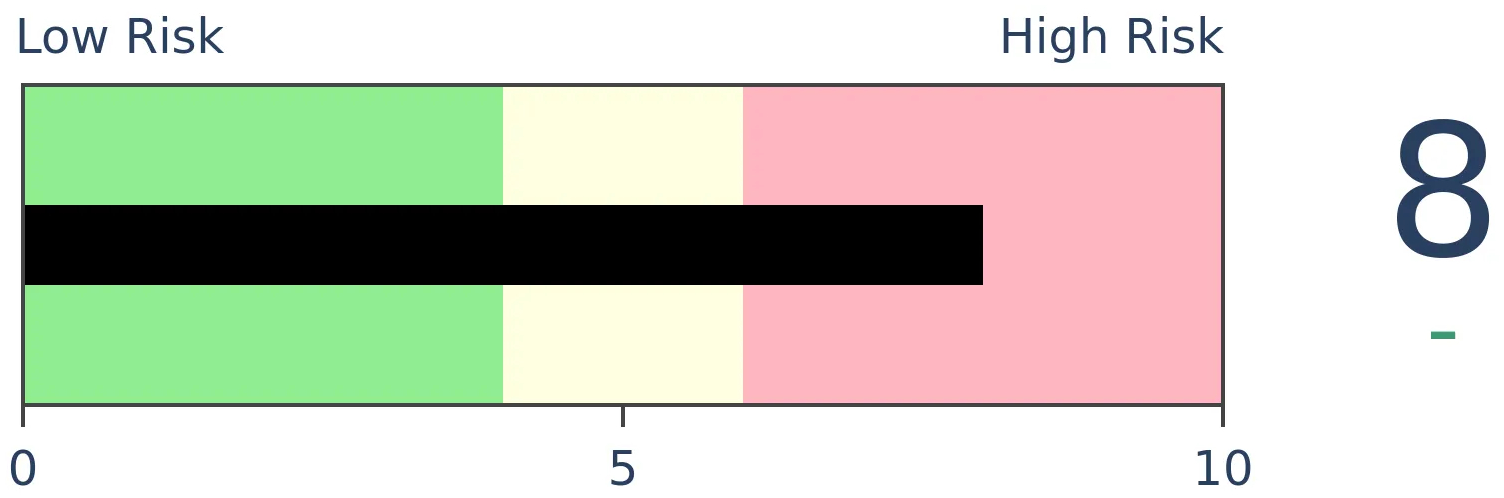
Risk Levels
Stocks Short-Term
|
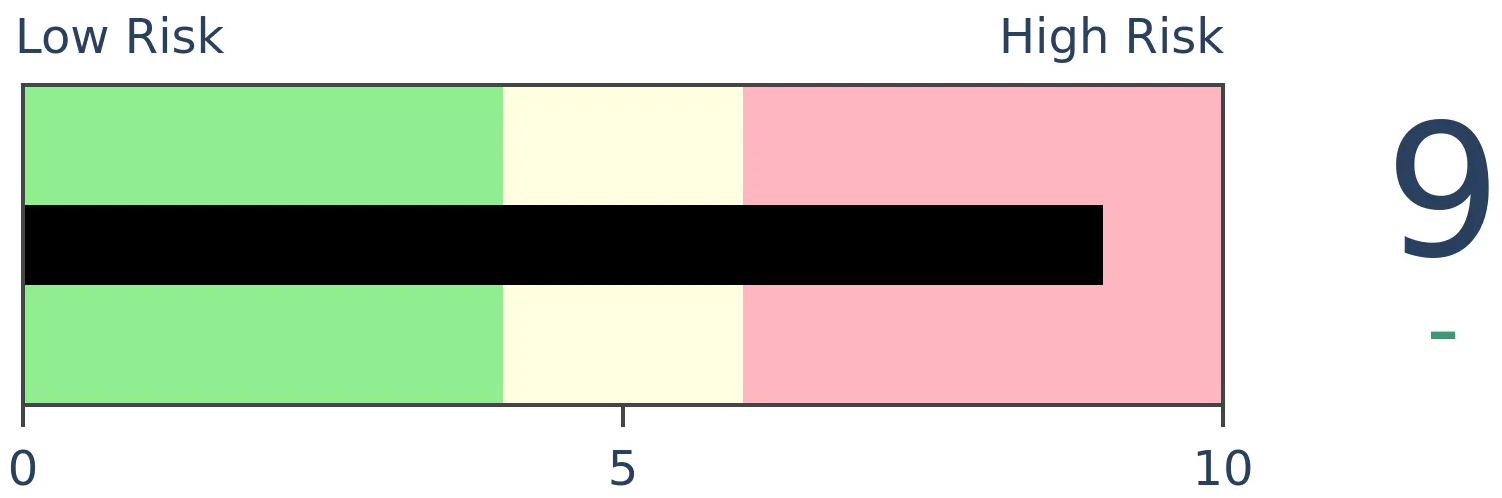
Stocks Medium-Term
|
|
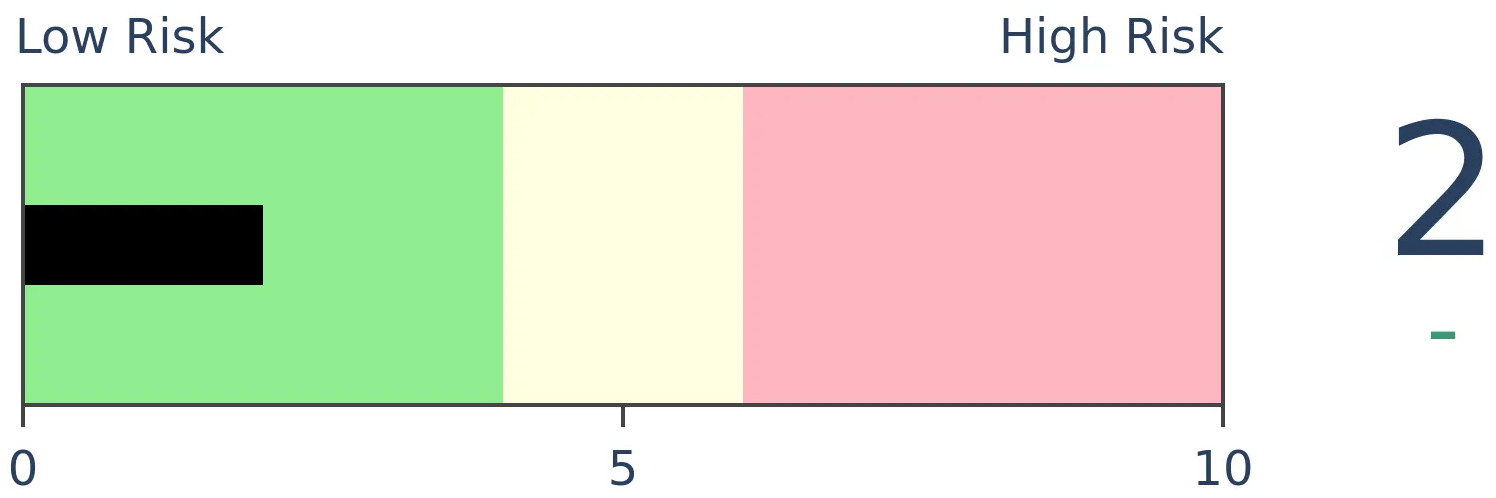
Bonds
|
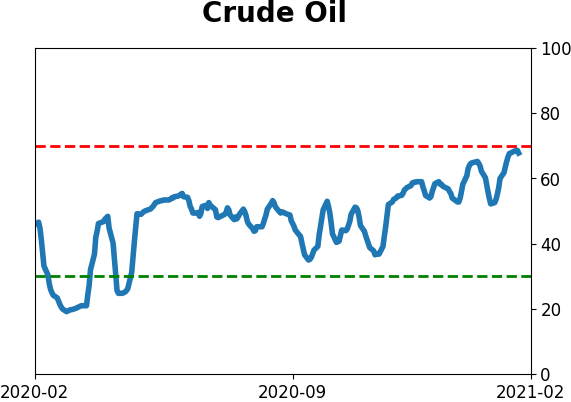
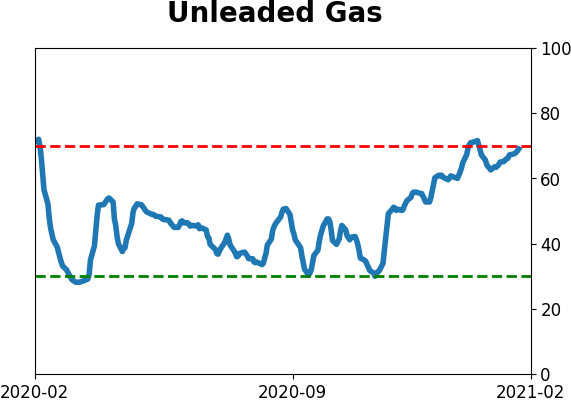
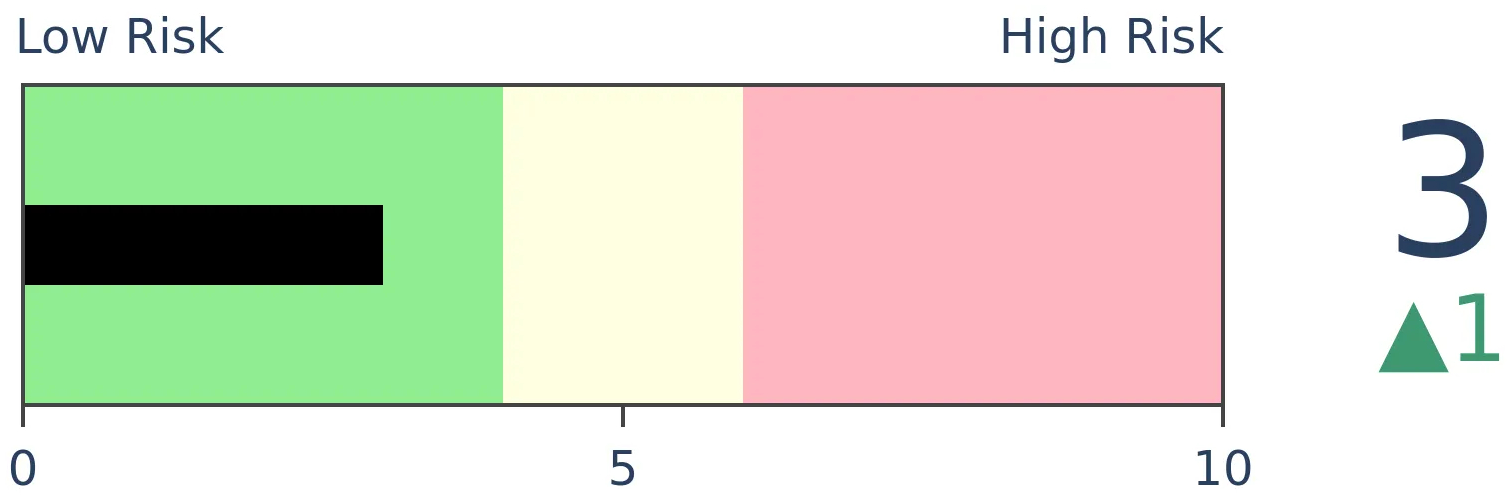
Crude Oil

|
|
Gold
|
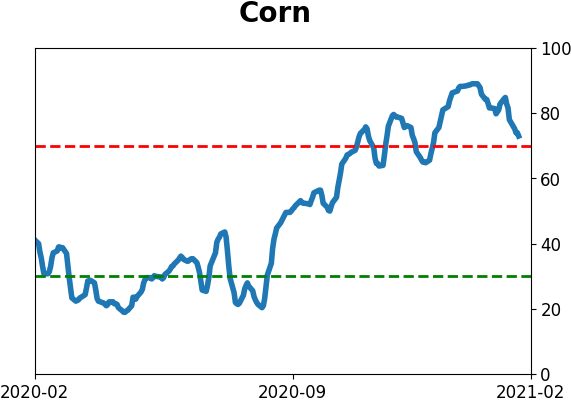
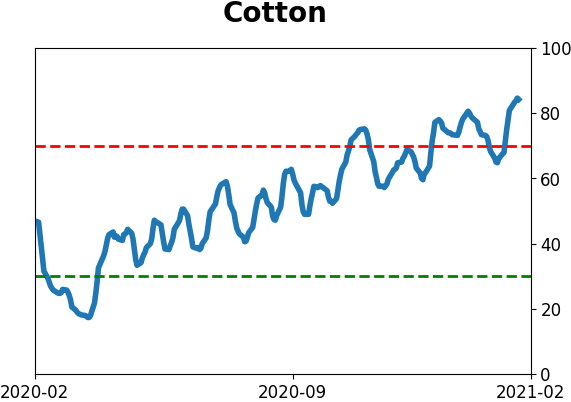
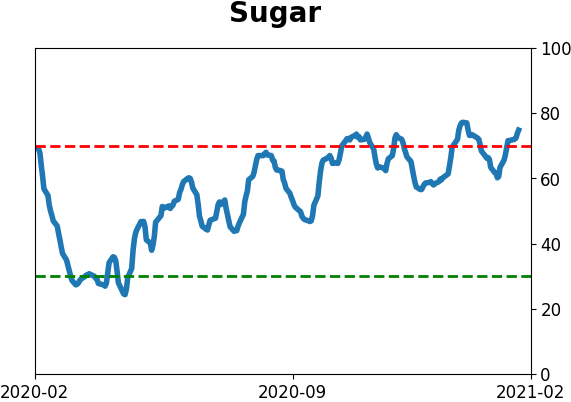
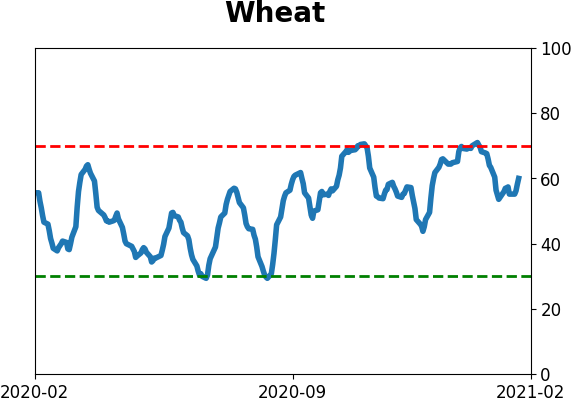
Agriculture
|
|
Research
BOTTOM LINE
The financial sector broke out to new highs last week, with good support among member stocks. Nearly 30% of financial stocks reached a 52-week high, the most in a year. That's supposed to be a good sign, but the evidence is mixed.
FORECAST / TIMEFRAME
None
|
Providing some succor to long-underperforming investors in financials, the sector finally broke out to new highs last week.
Like we've seen market-wide, the sector's move was powered by a pretty good base of stocks. By Friday, nearly 30% of financials tickled new highs, the most in over a year.
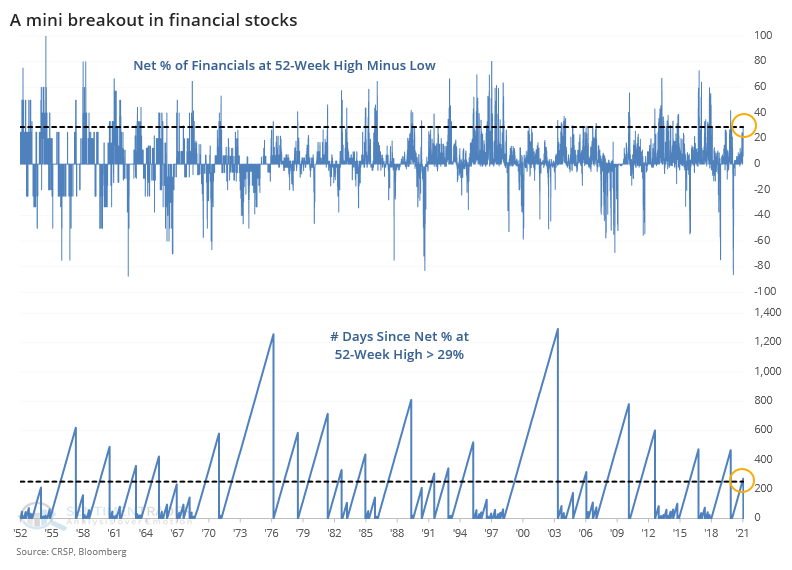
There were no financials sinking to a 52-week low, so the net percentage of stocks at new highs, at nearly 30%, was still the most in over a year. While there have been many days with more stocks hitting new highs, and longer stretches without at least 29% of them doing so, this breakout still ranks among the largest, after one of the longest dry stretches, in 70 years.
We use total return (price gains + dividends) for sector performance going back decades, and below we can see how an investor in this sector would have fared after buying these broad breakouts in financials.
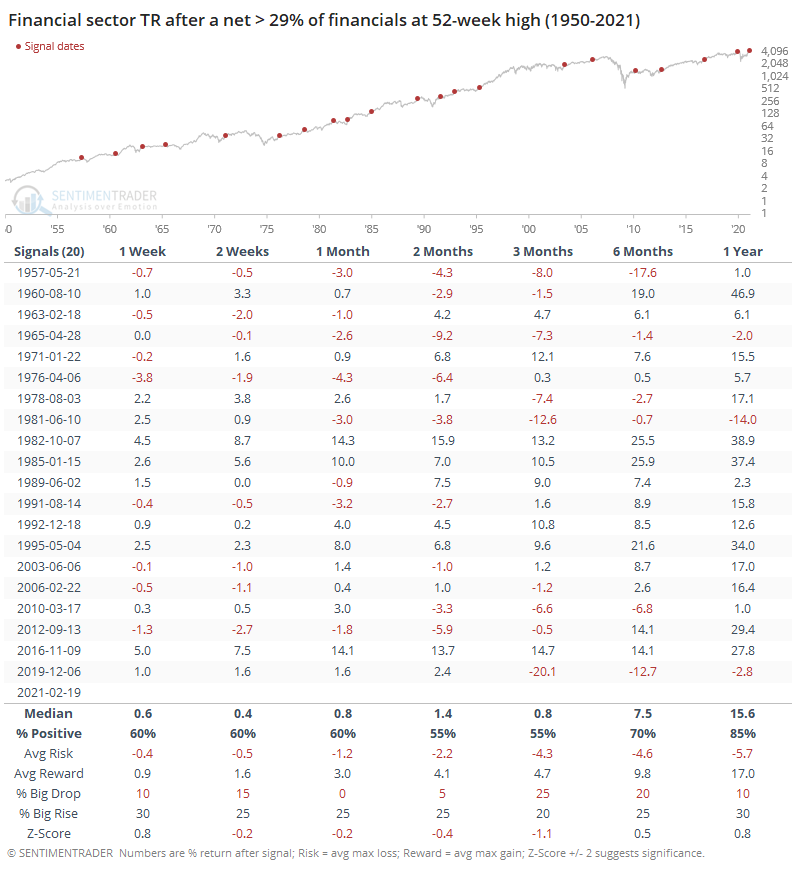
Overall, it was "meh." The sector showed a median total return over the next 3 months of only +0.8%, which was more than a standard deviation below any random 3-month span. It was positive barely half the time, and with risk that was about even with reward. Out of the last 5 signals, 4 of them preceded losses.
This kind of move, in this kind of sector, is supposed to be a good sign for the broader market, so below we can see returns (price only) in the S&P 500 after nearly a third of financial stocks broke out to new highs.

Again, forward returns over the medium-term were okay, but nothing special. Not even particularly positive. Returns were barely positive, barely half the time, with risk about equal to reward, and a larger probability of suffering a big drop than enjoying a big gain.
We test so much because it helps to generate a base case and serves as a check against assumptions and theories that always sound good, but rarely have sound evidence backing them. A big, broad breakout in financials is universally considered to be a great sign for that sector, and the market as a whole. Maybe it will be - it has several times in the past. But just as often, it has preceded average, or even weaker-than-average, returns, and we wouldn't consider it consistent enough to be a positive for investors here.
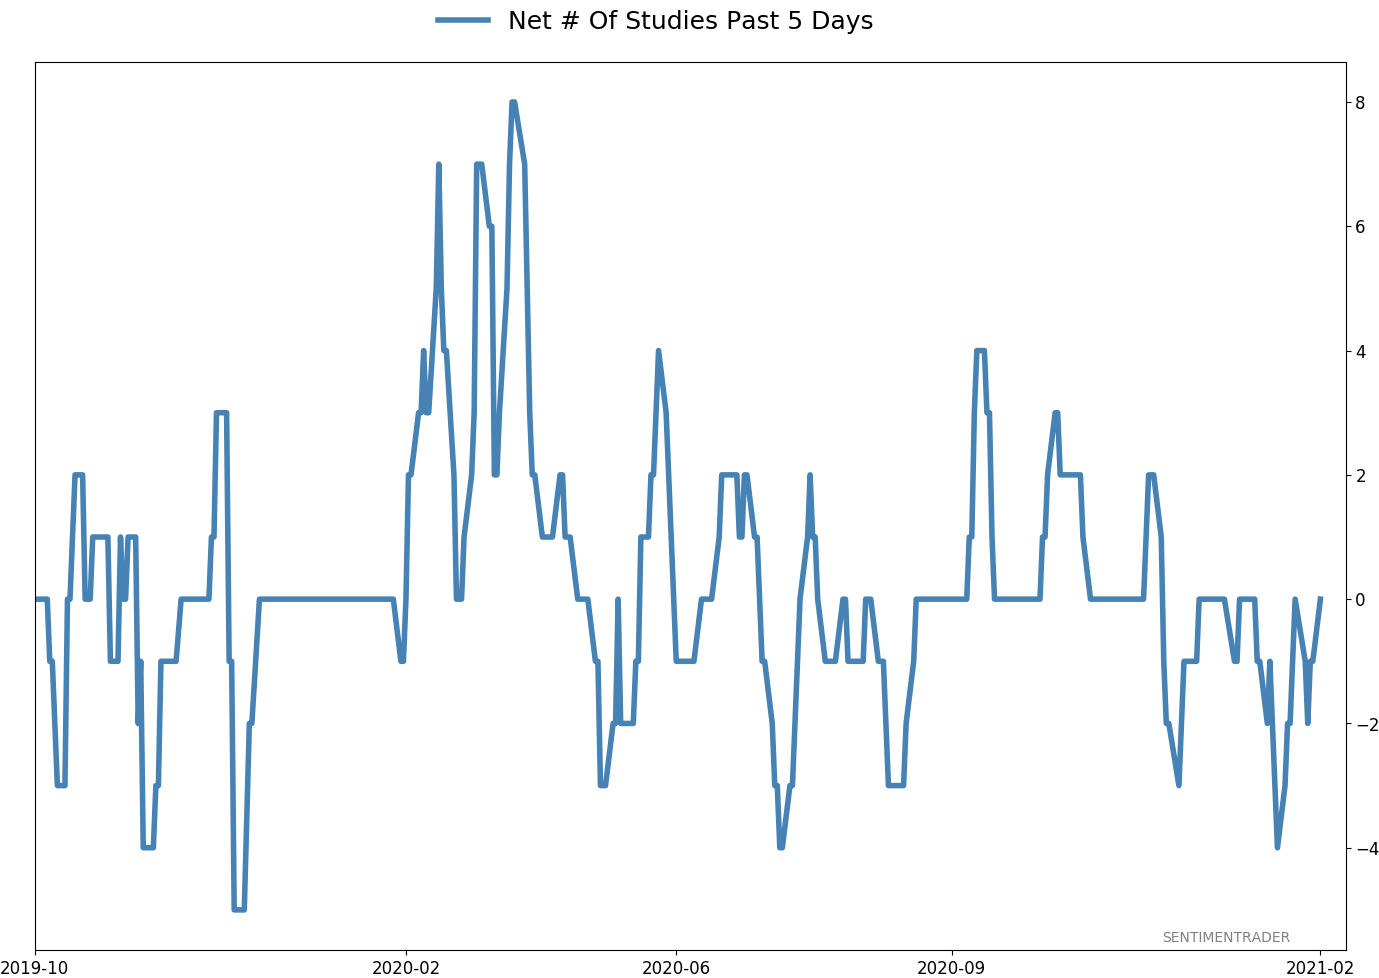
Active Studies
| Time Frame | Bullish | Bearish | | Short-Term | 0 | 0 | | Medium-Term | 2 | 8 | | Long-Term | 16 | 3 |
|
Indicators at Extremes
Portfolio
| Position | Description | Weight % | Added / Reduced | Date | | Stocks | RSP | 4.9 | Reduced 4% | 2021-02-09 | | Bonds | 30.0% BND, 8.8% SCHP | 38.8 | Added 15.1% | 2021-02-18 | | Commodities | GCC | 2.3 | Reduced 2.1%
| 2020-09-04 | | Precious Metals | GDX | 9.0 | Added 0.1% | 2021-02-18 | | Special Situations | 7.3% XLE, 4.8% PSCE | 12.1 | Reduced 5.6% | 2021-02-18 | | Cash | | 32.8 | | |
|
Updates (Changes made today are underlined)
With a market that has seen the kinds of broad participation and big breath thrusts like we did in the fall, it's hard to become too negative. Those kinds of conditions have consistently preceded higher returns over the next 6-12 months. It's the interim that's more of an issue. Even conditions like that haven't prevented some shorter-term pullbacks. And when we combine an environment where speculation is rampant and recent days have seen an increase in cracks under the surface of the indexes, it's enough to become more defensive over a short- to medium-term time frame. We still don't have much confirmation from the price action in the indexes, so those who are more conservative would likely wait before increasing cash levels. I've decreased risk exposure a bit more, mainly in terms of energy stocks and the ANGL fund, while adding more to the broader bond market. RETURN YTD: 6.1% 2020: 8.1%, 2019: 12.6%, 2018: 0.6%, 2017: 3.8%, 2016: 17.1%, 2015: 9.2%, 2014: 14.5%, 2013: 2.2%, 2012: 10.8%, 2011: 16.5%, 2010: 15.3%, 2009: 23.9%, 2008: 16.2%, 2007: 7.8%
|
|
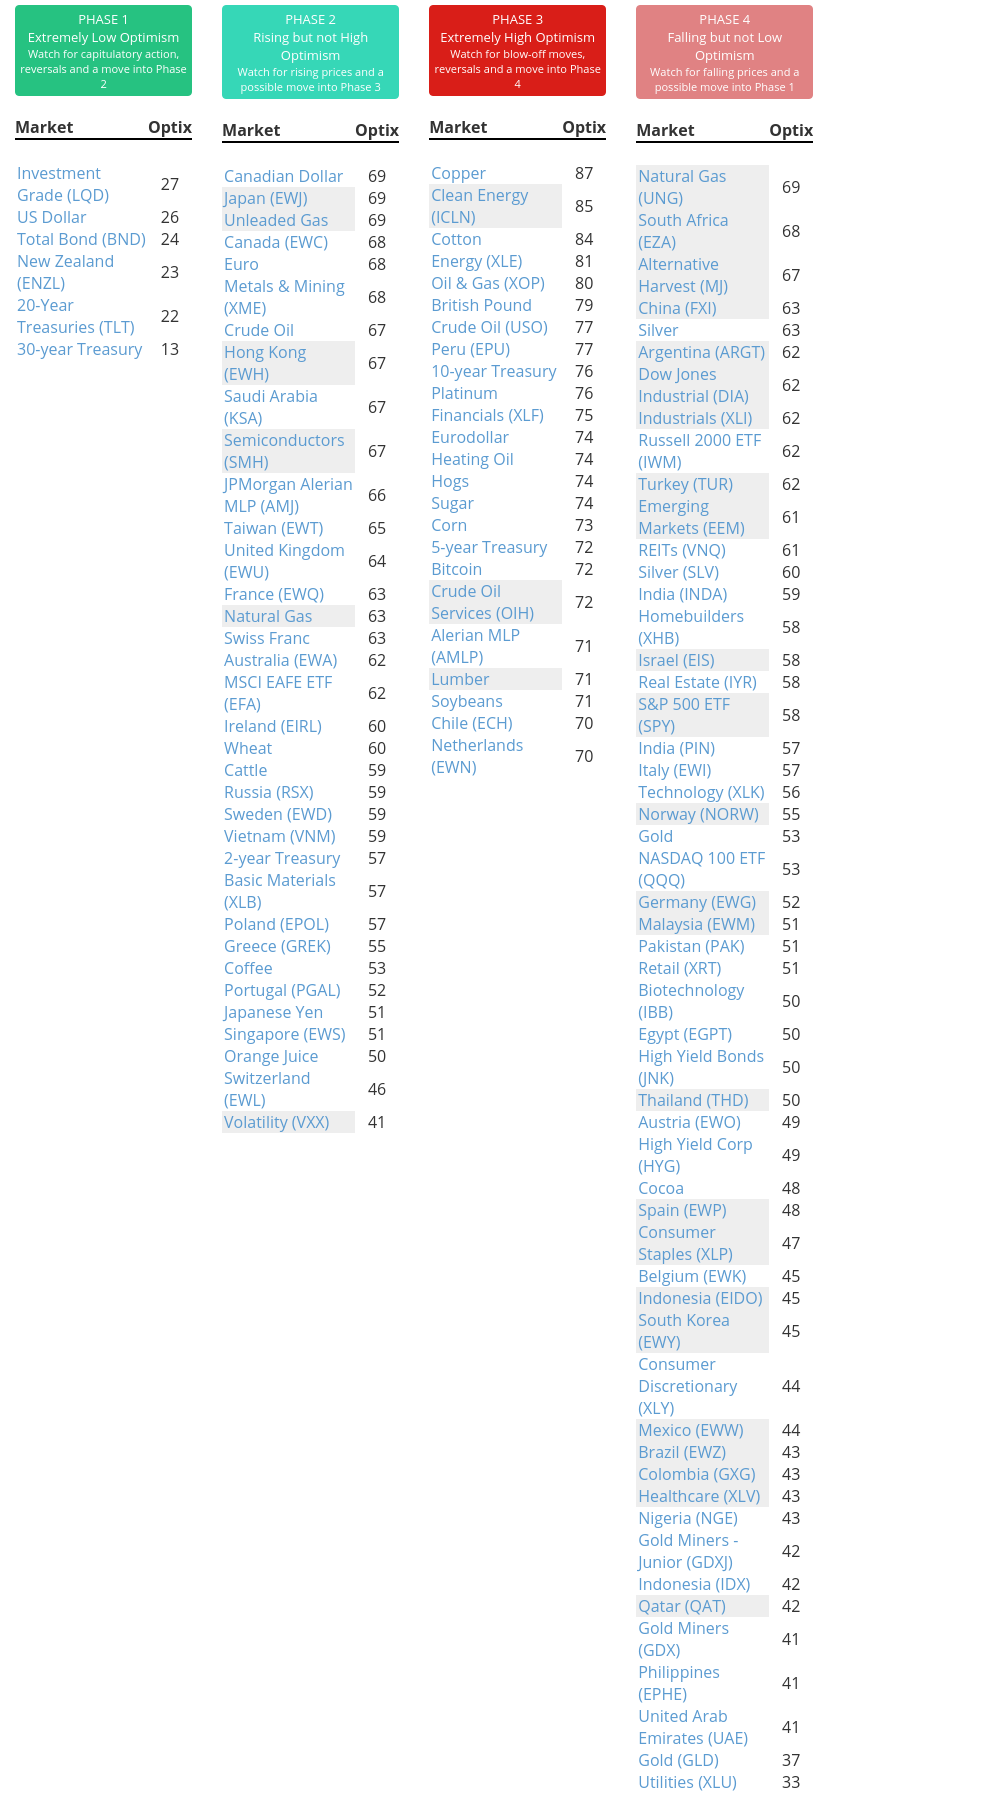
Phase Table
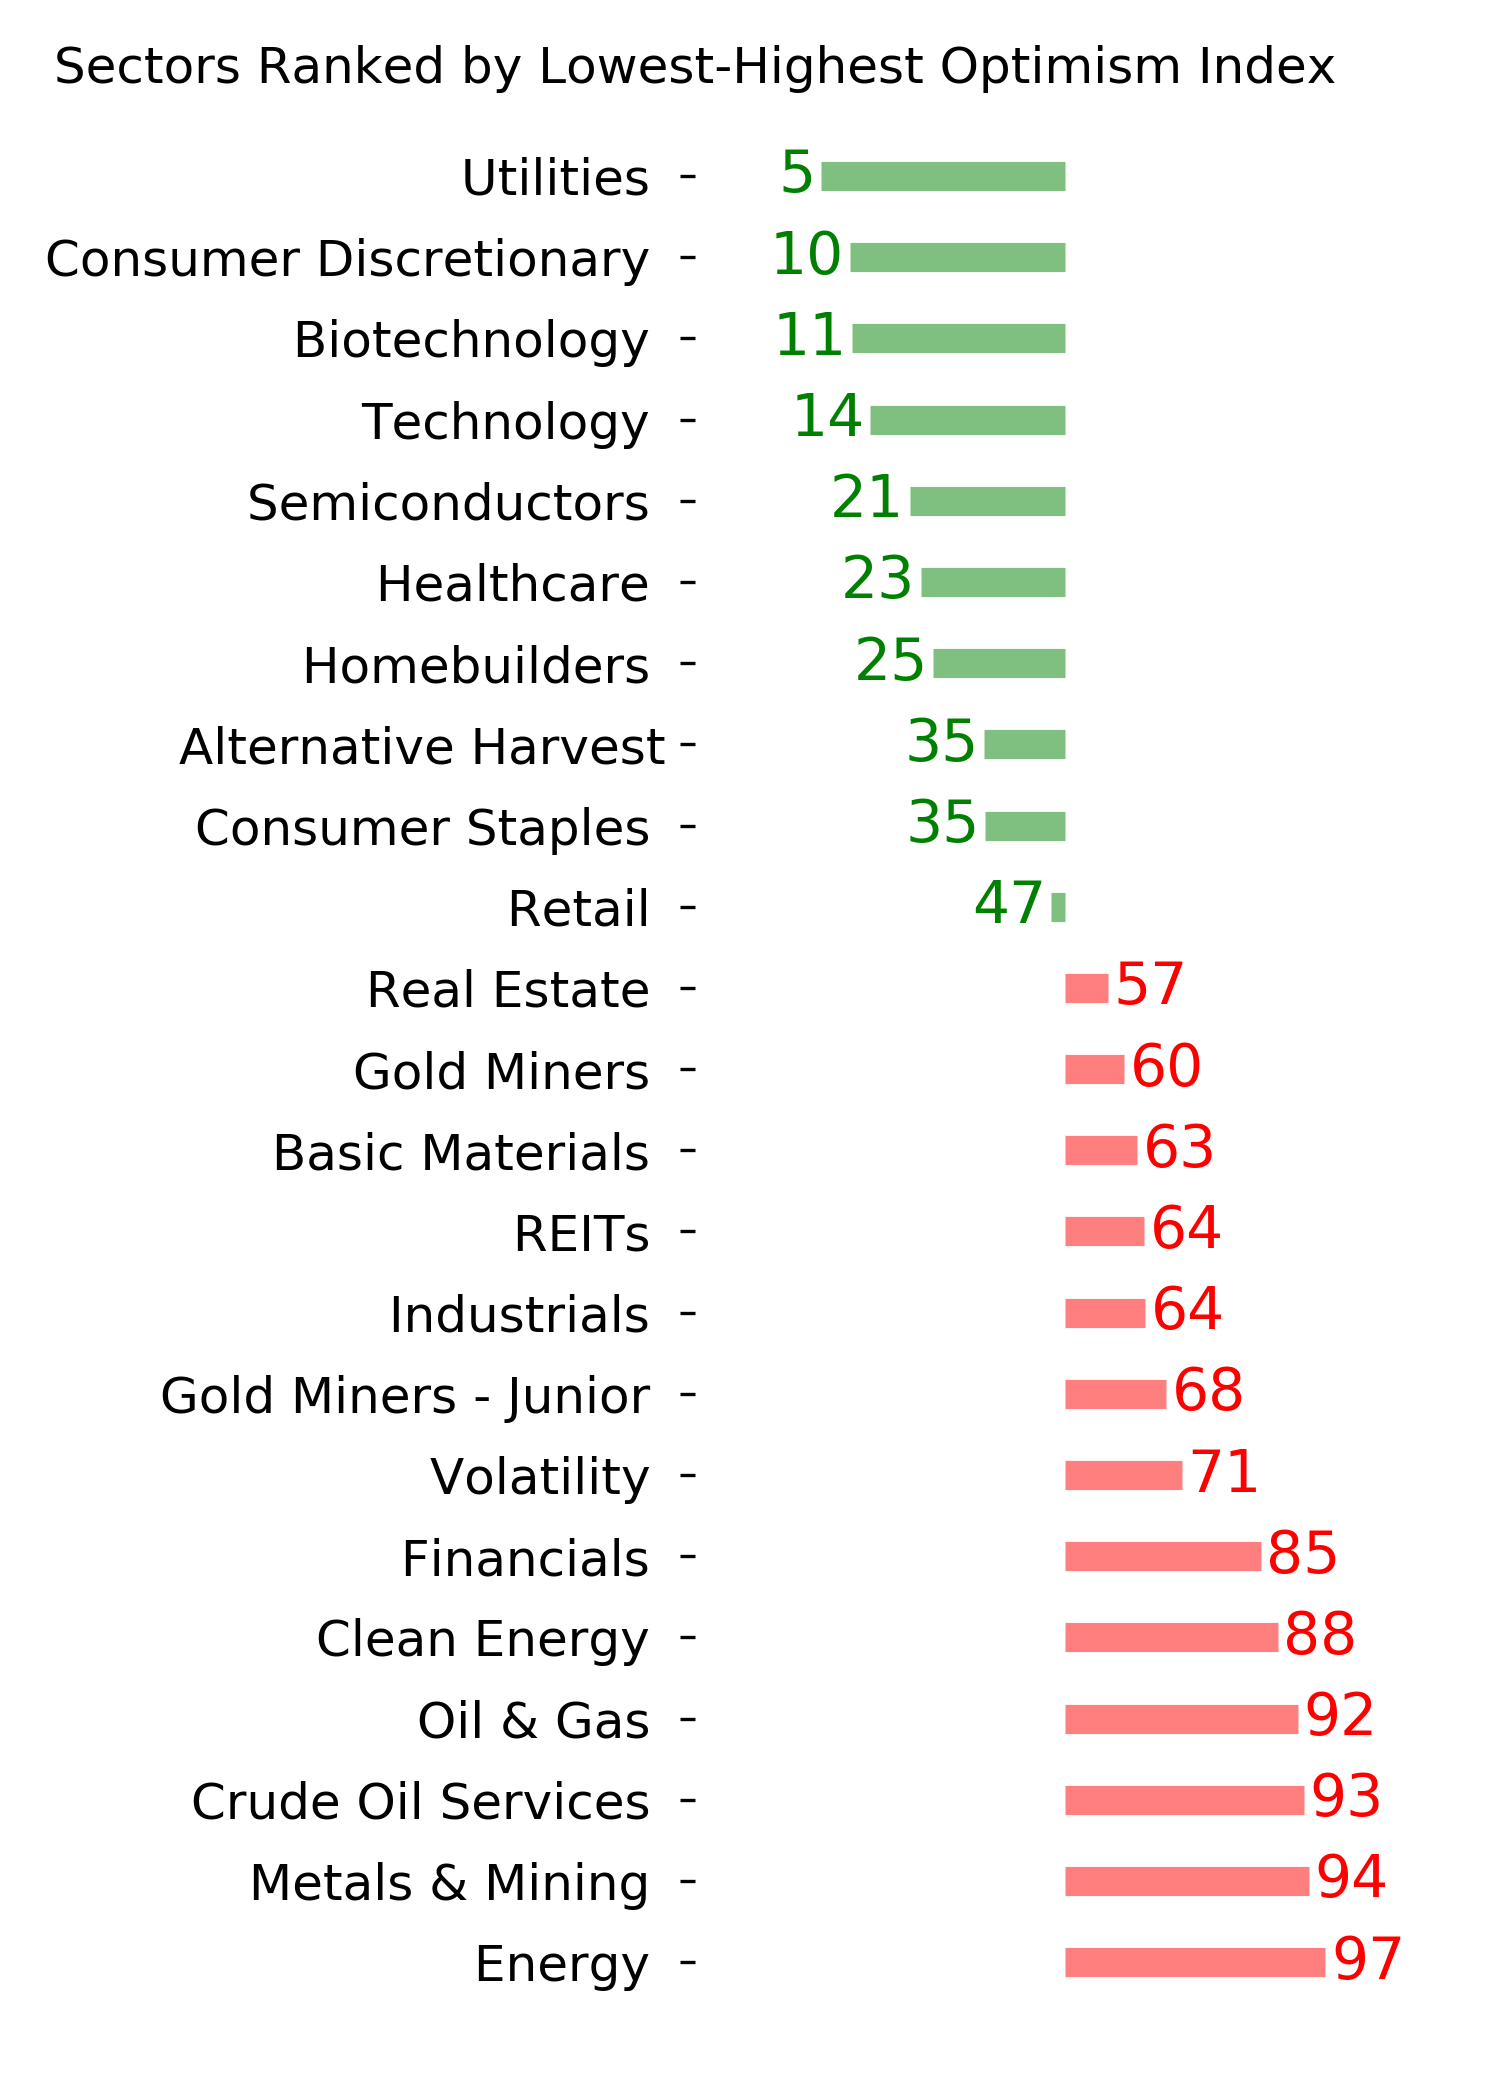
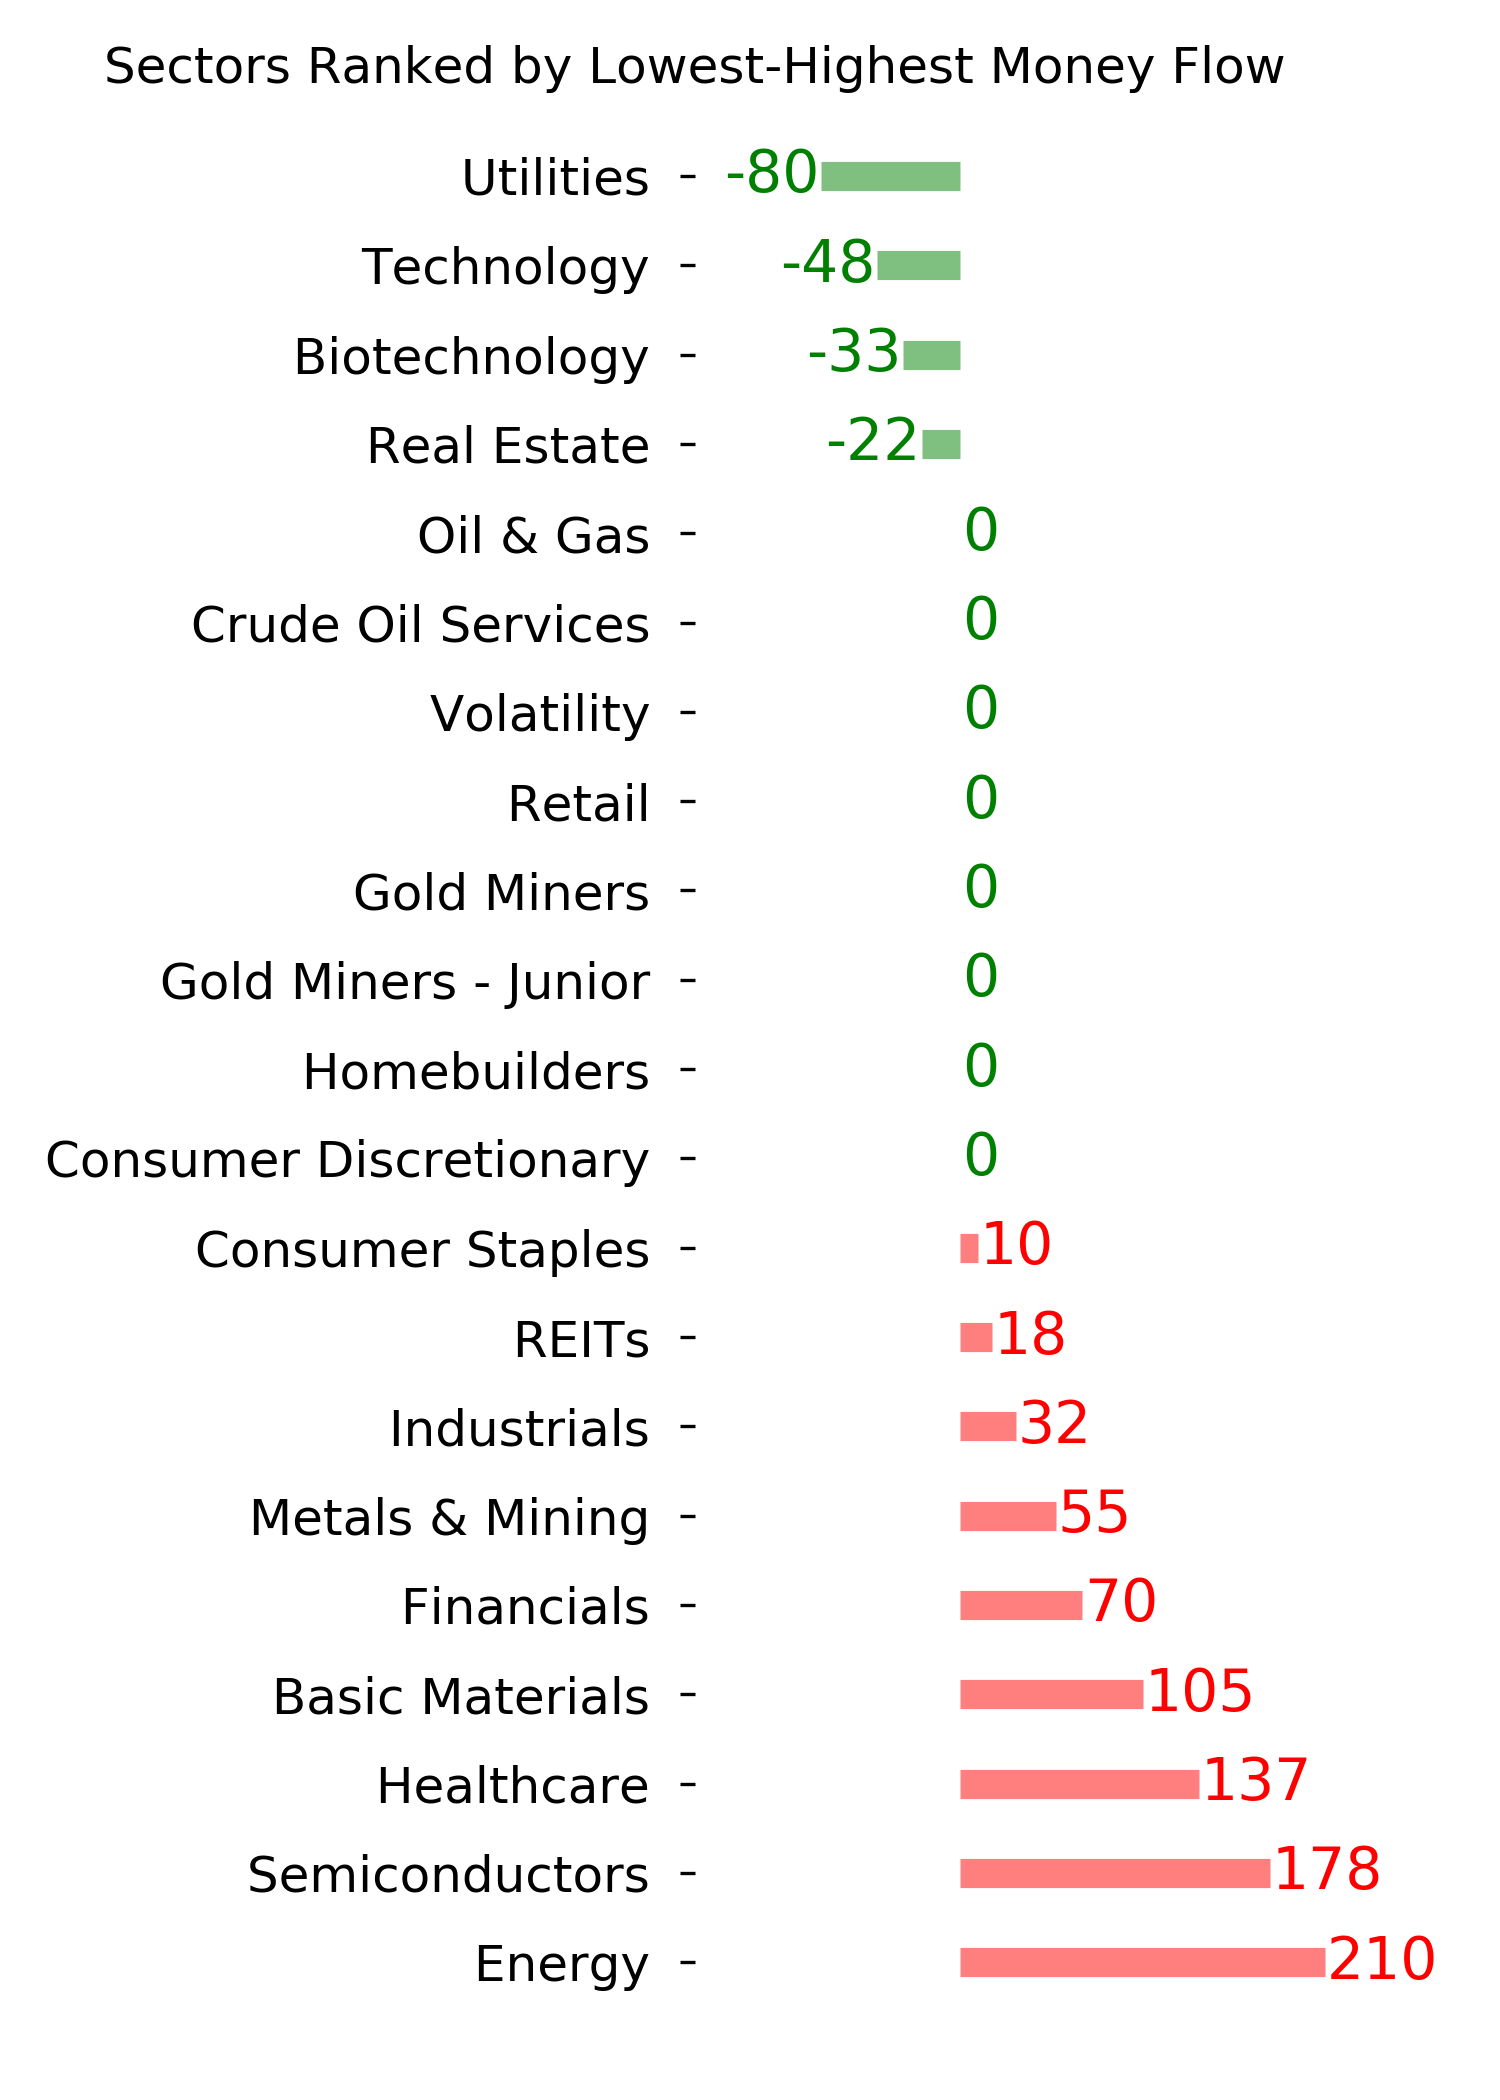
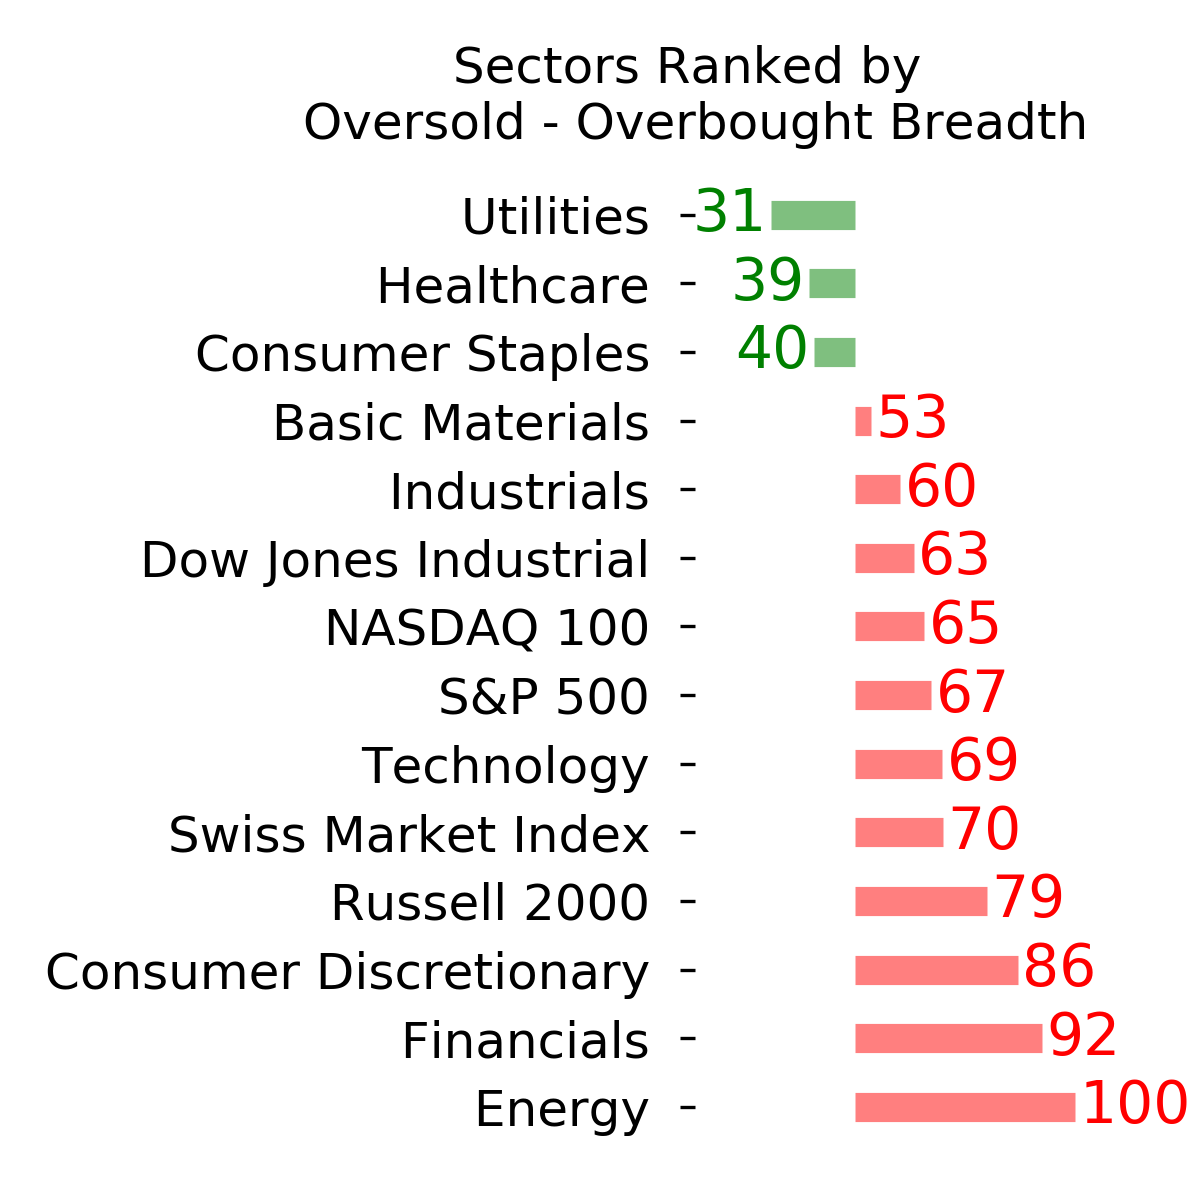
Ranks
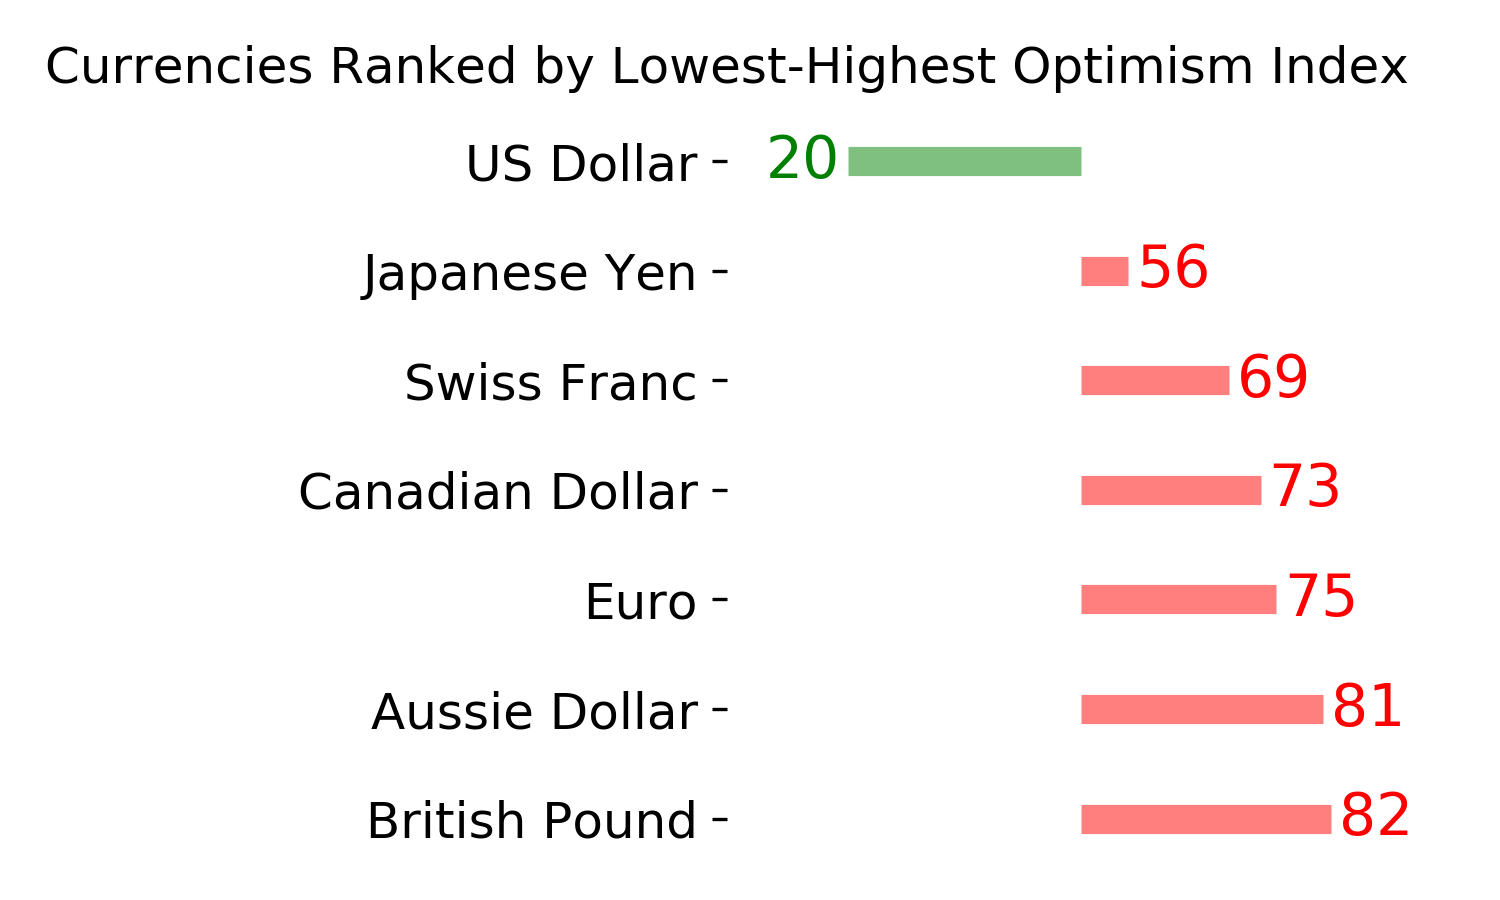
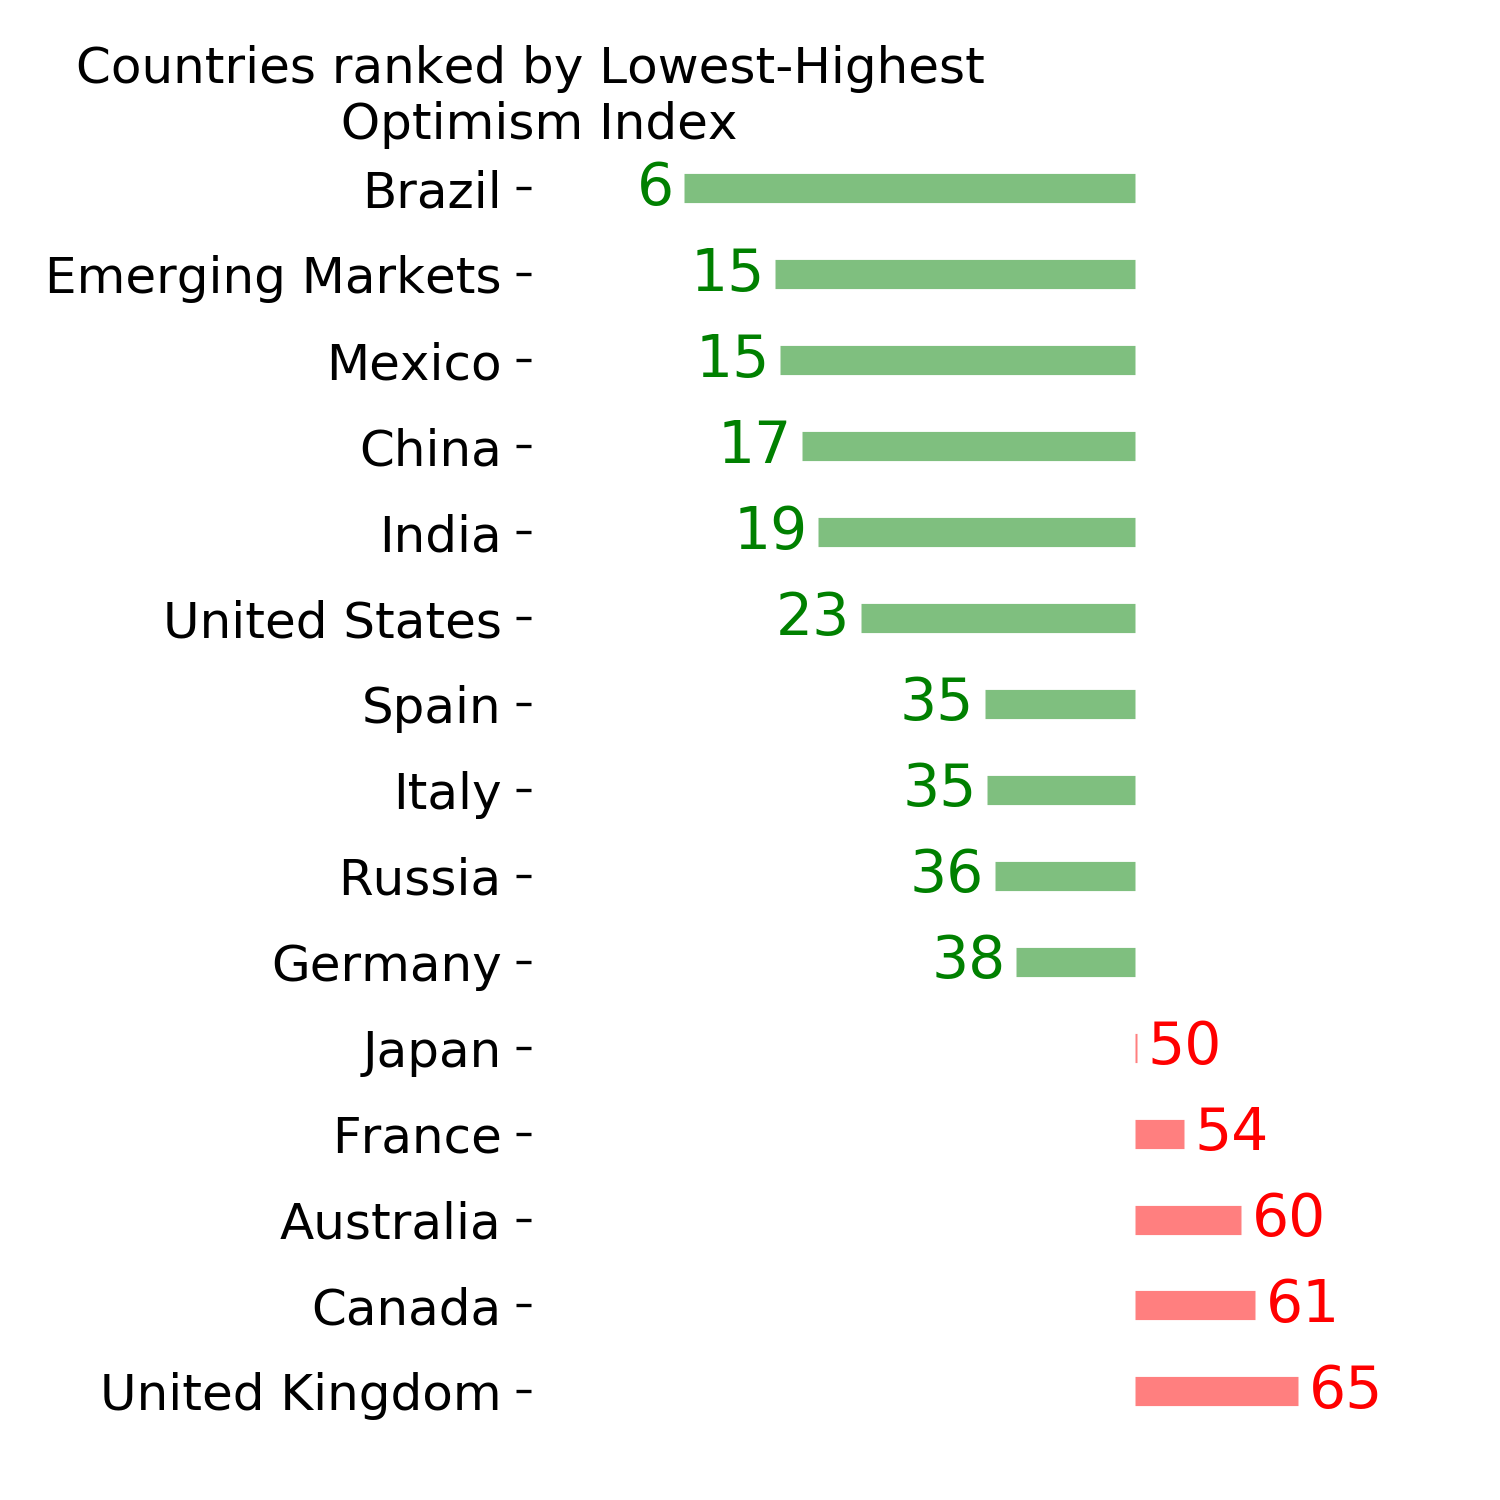
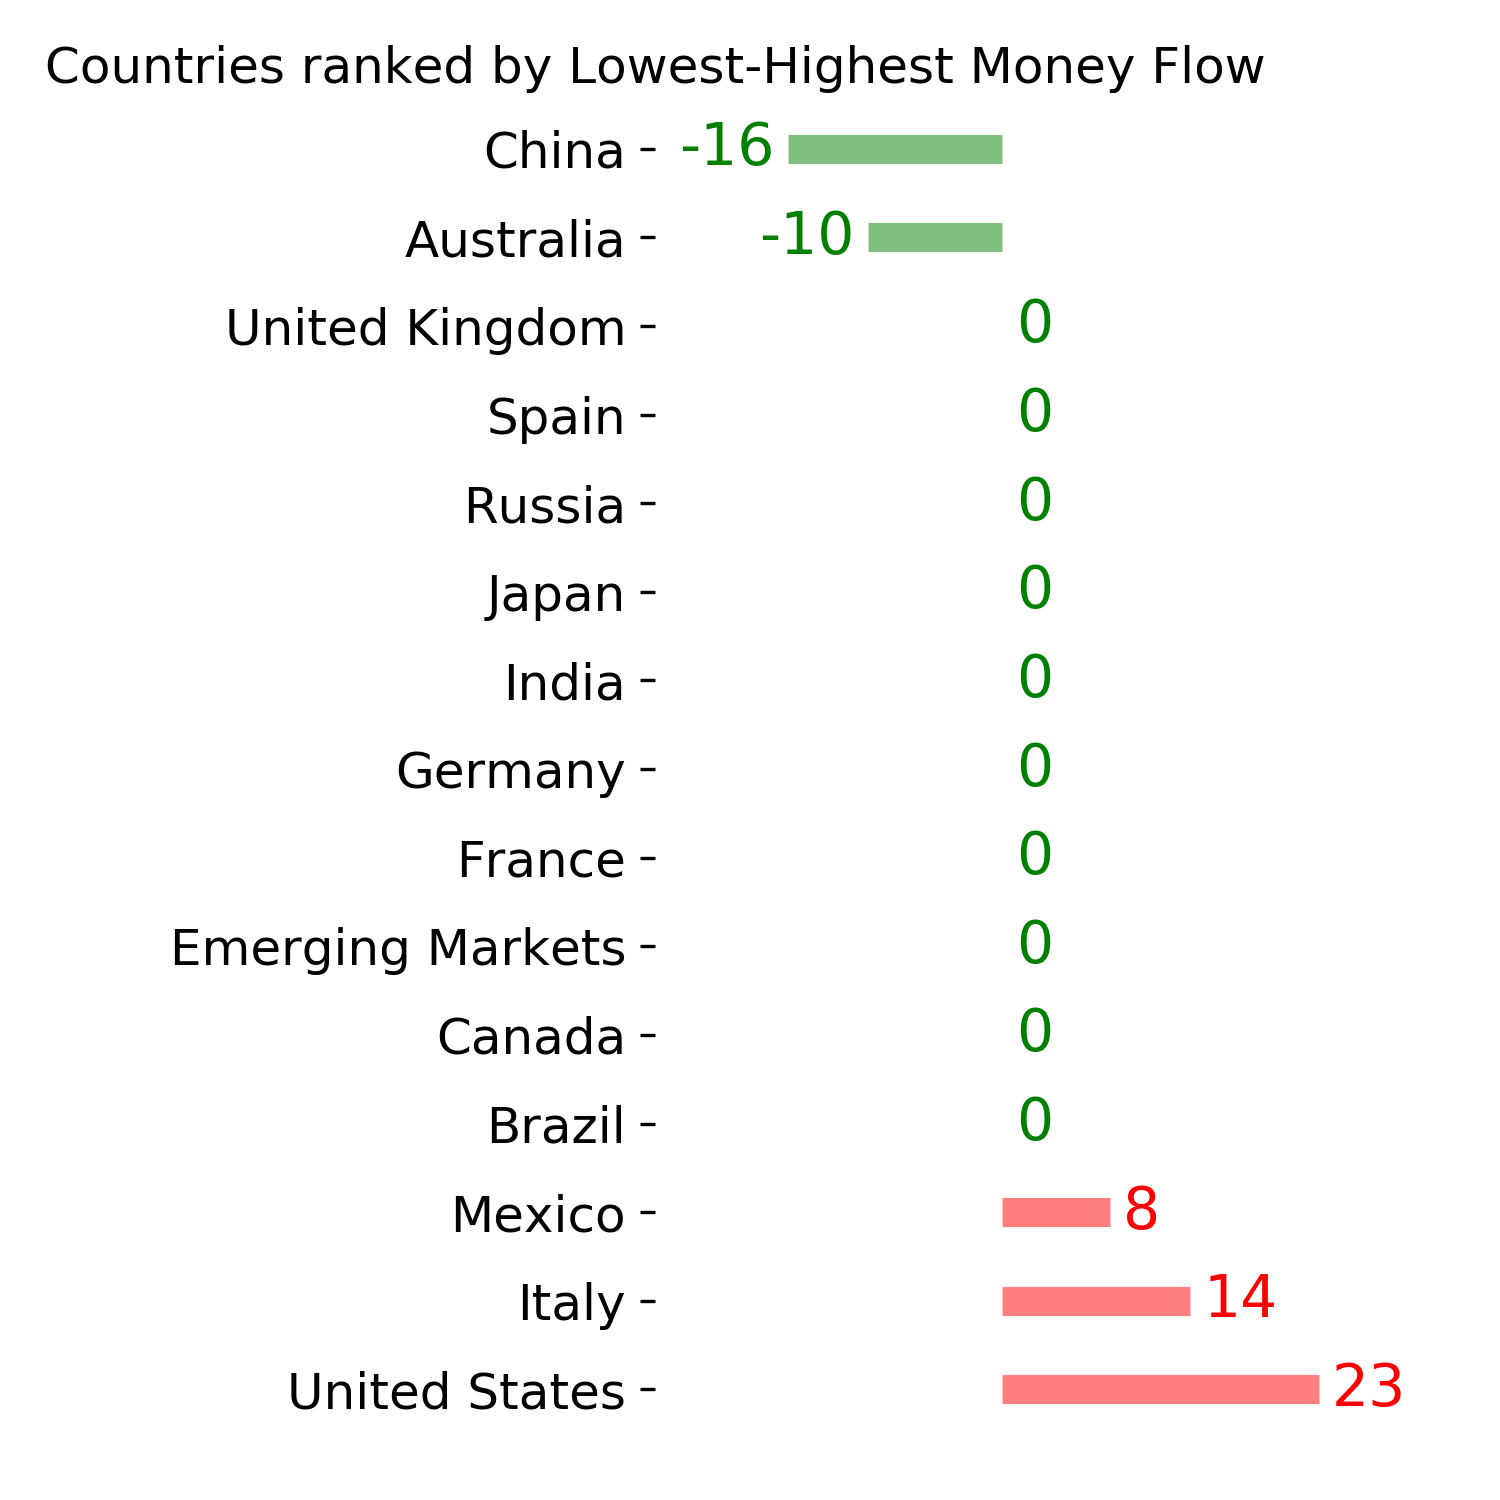
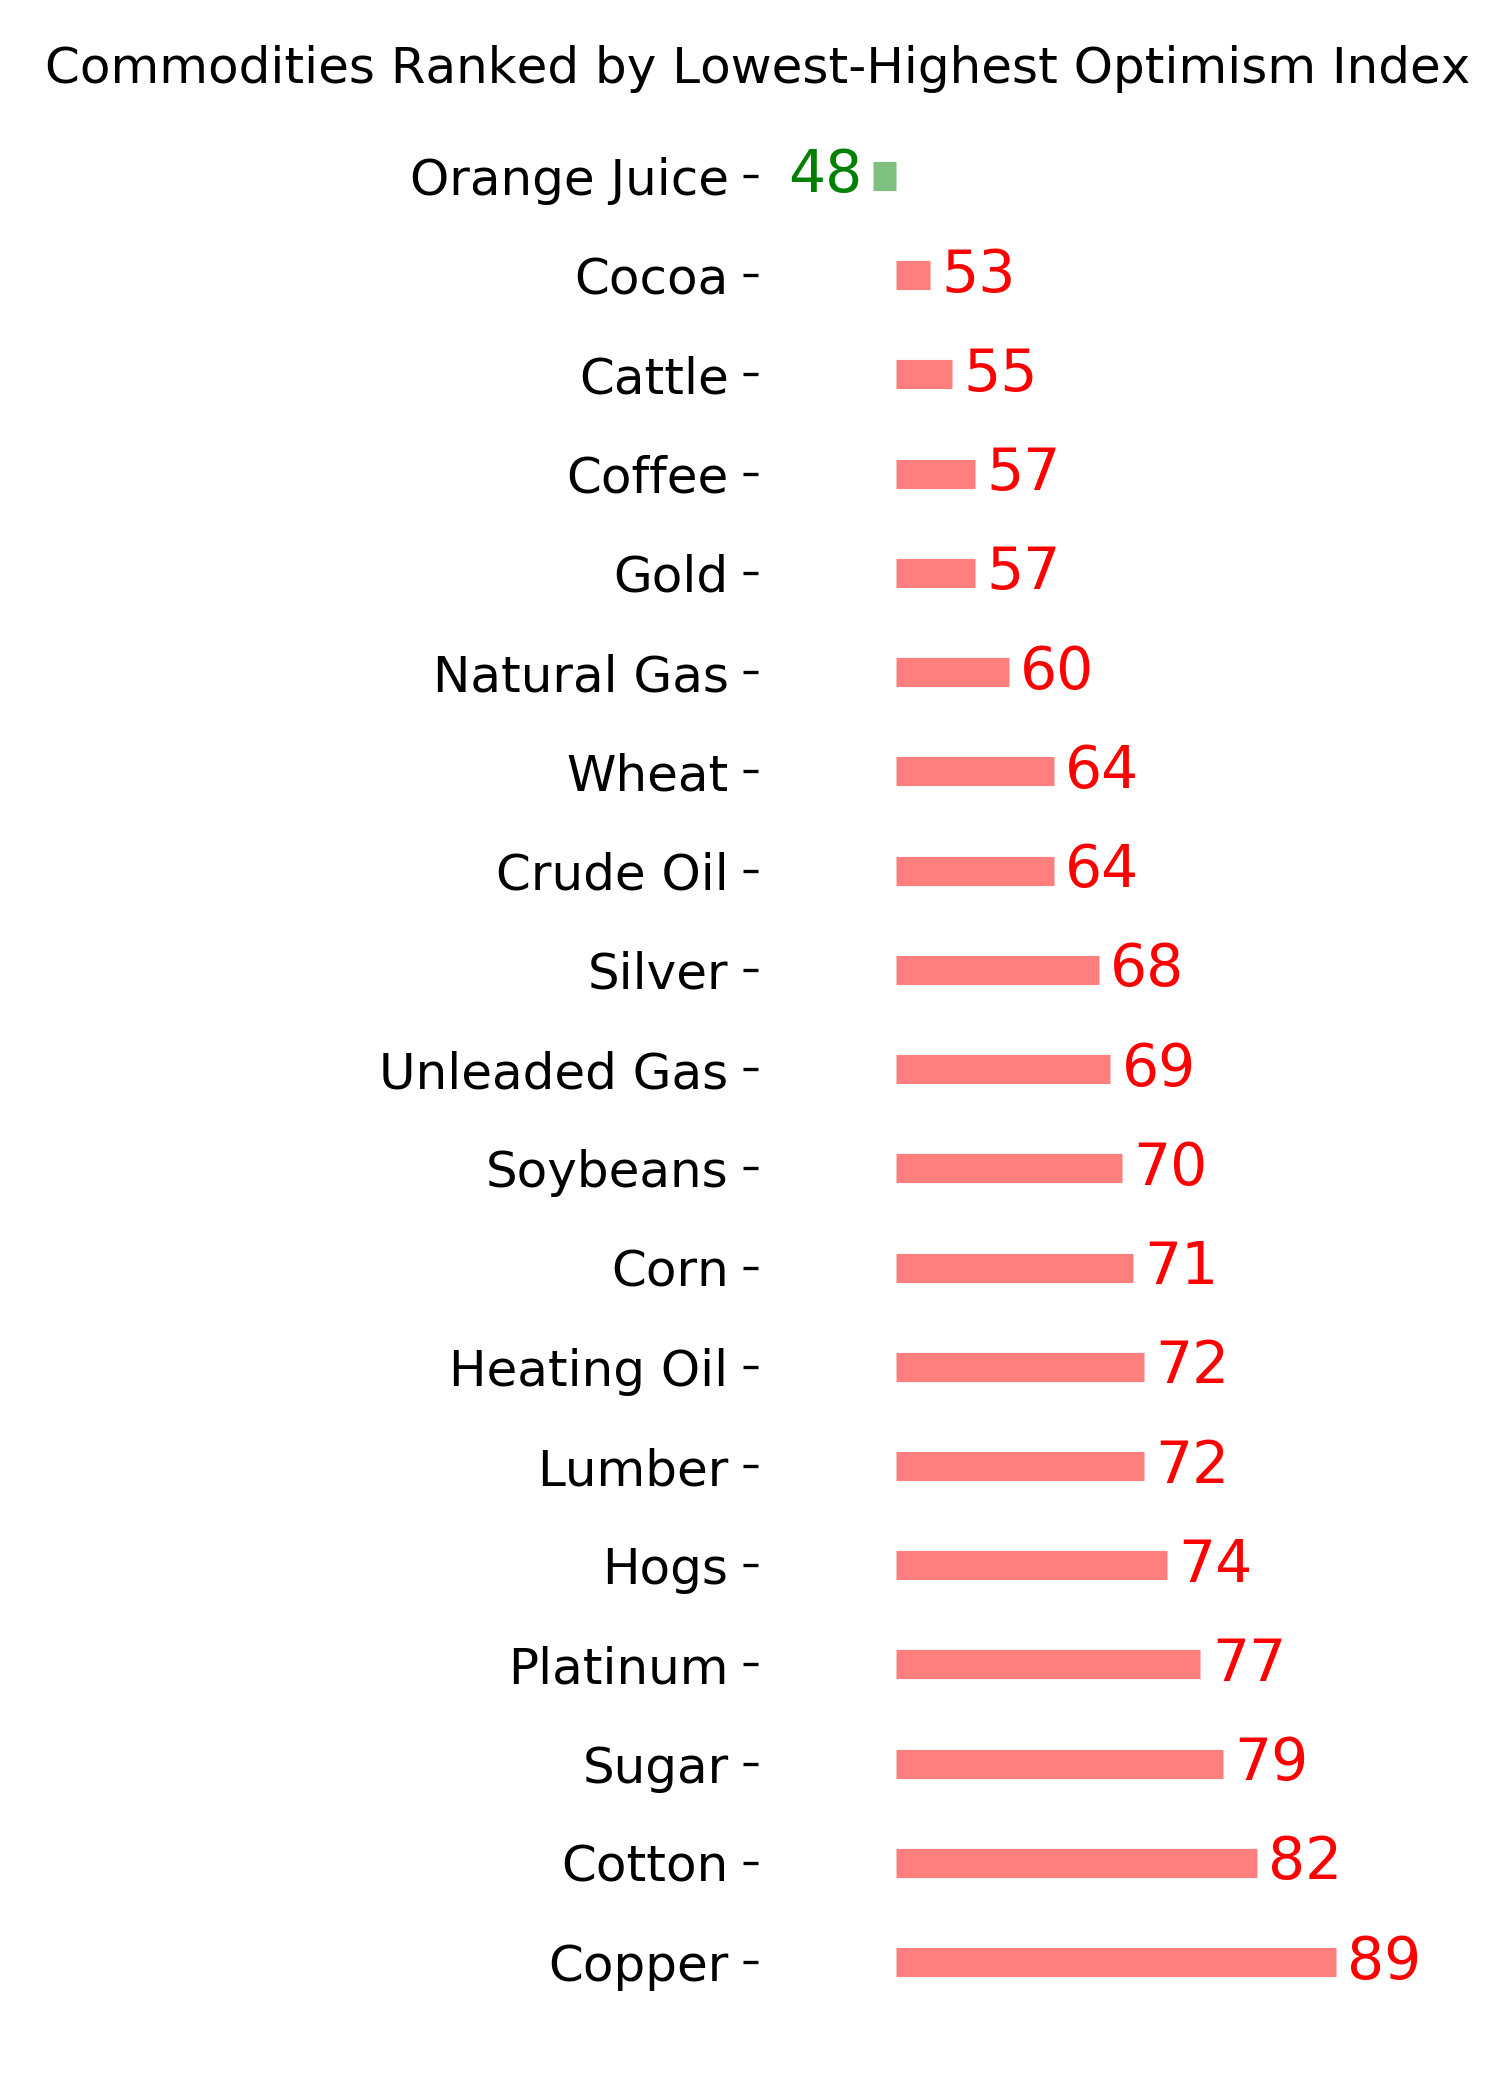
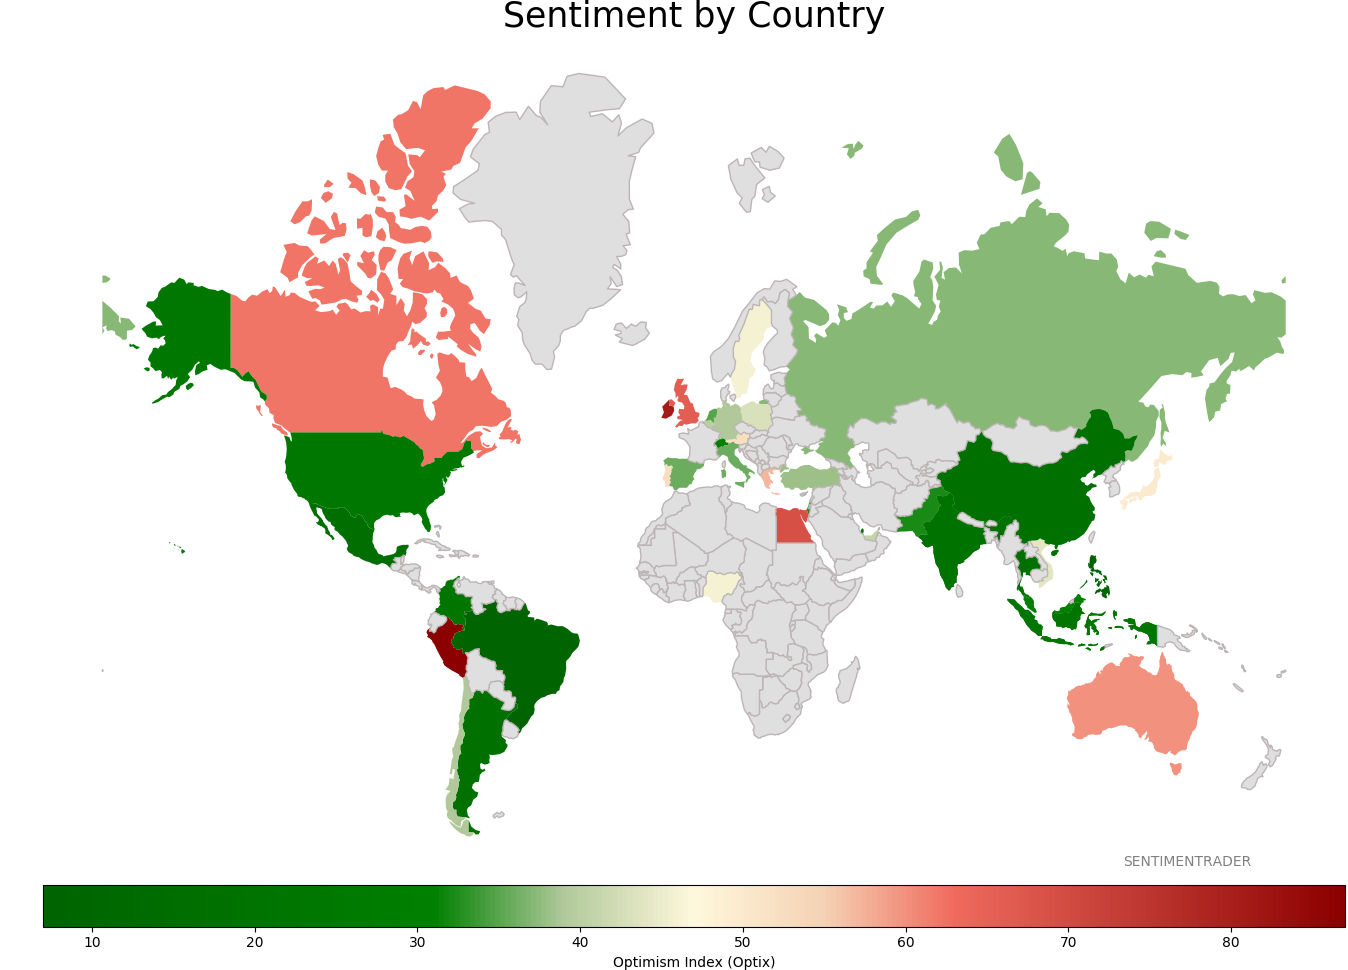
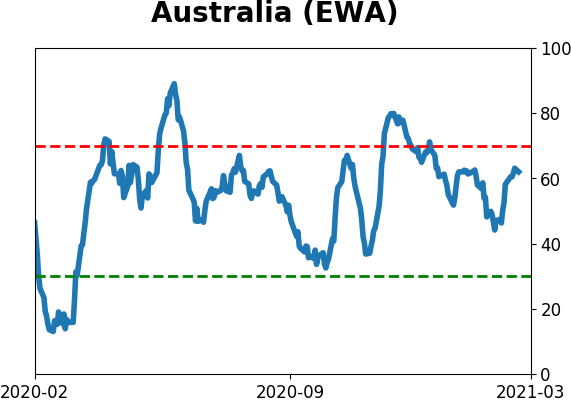
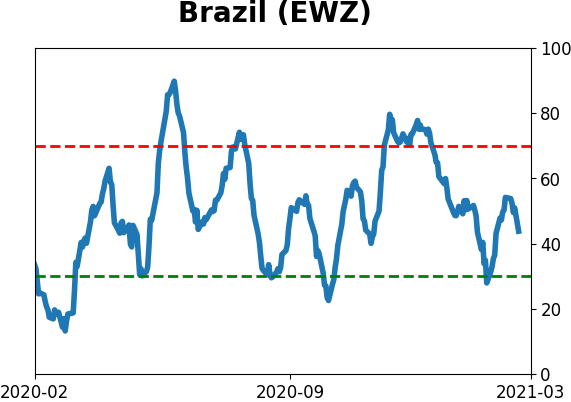
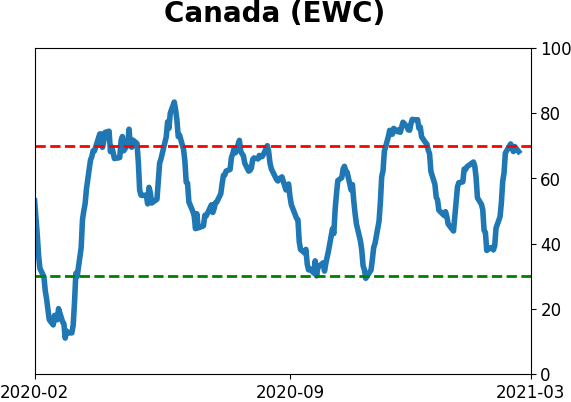
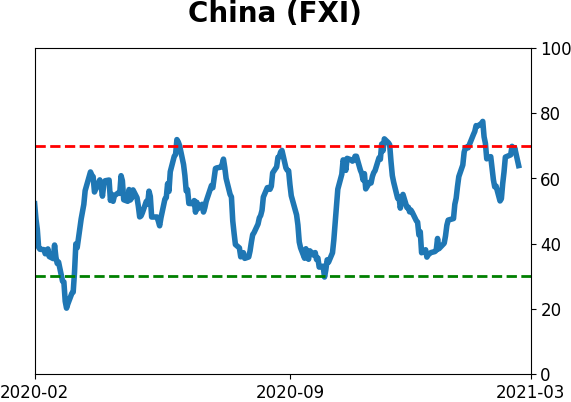
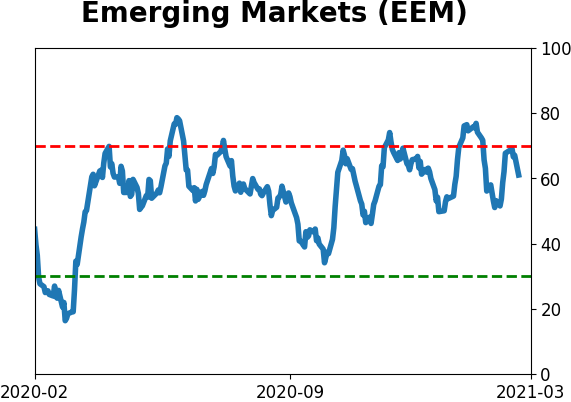
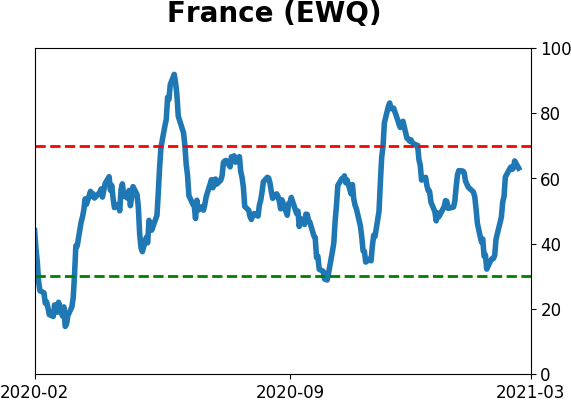
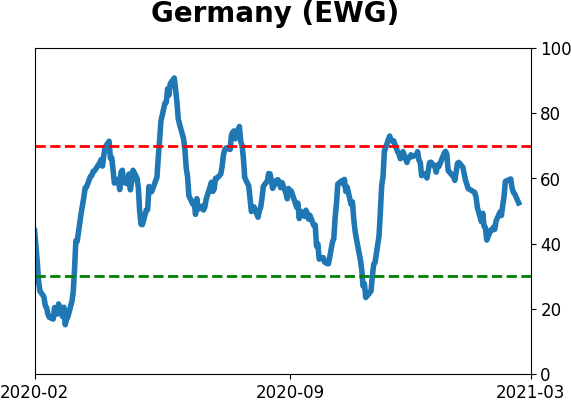
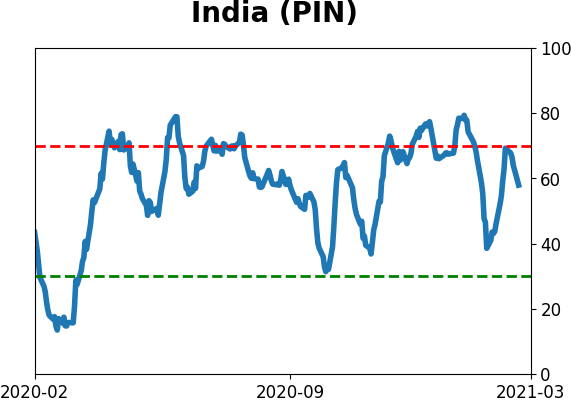
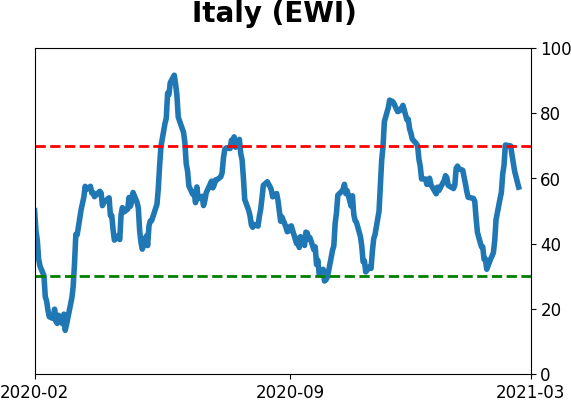
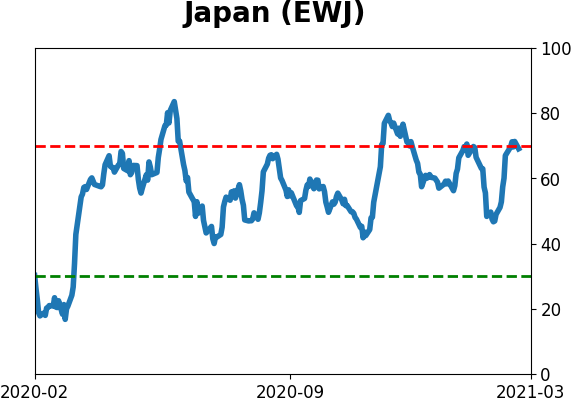
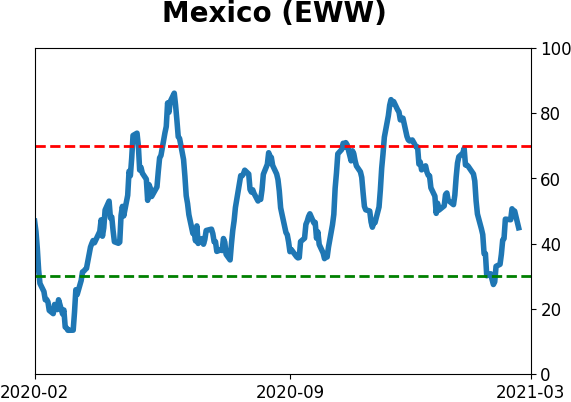
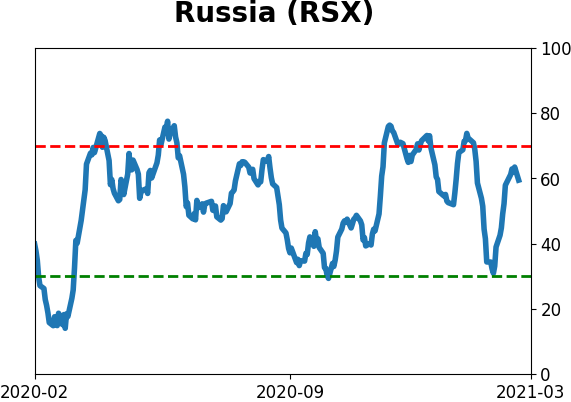
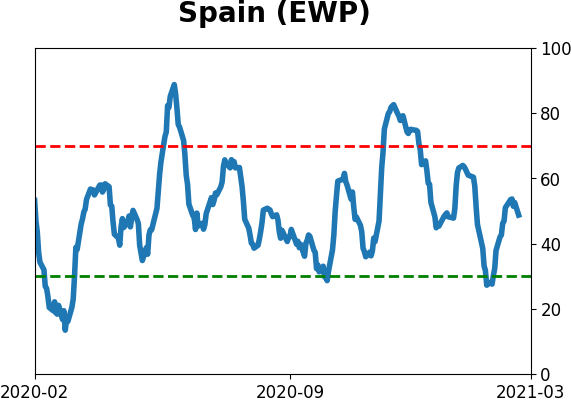
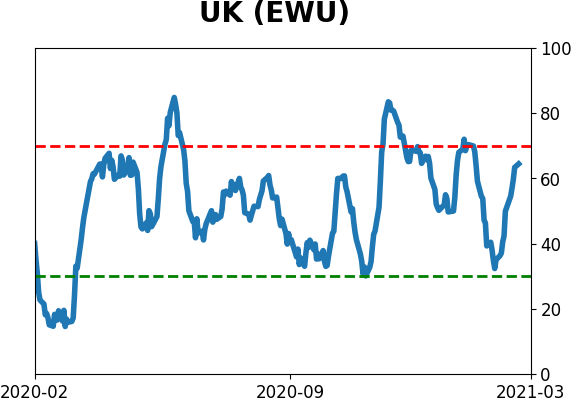
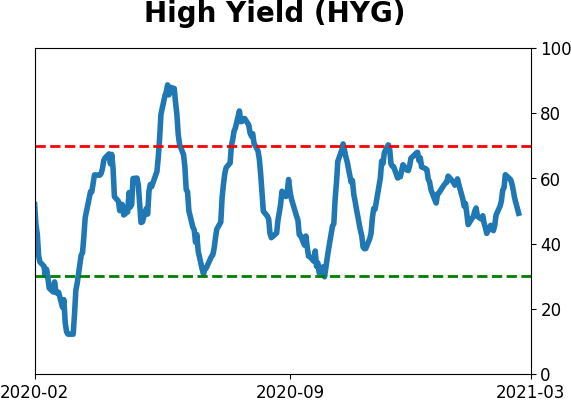
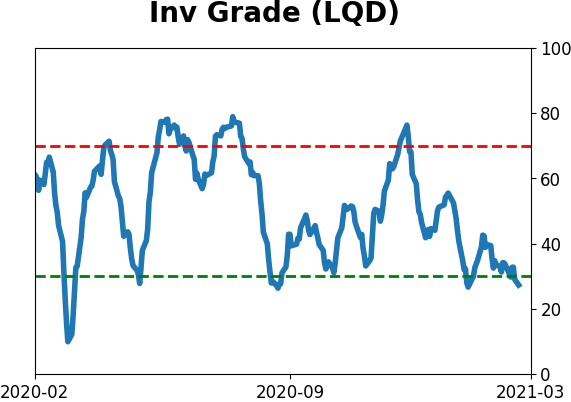
Sentiment Around The World
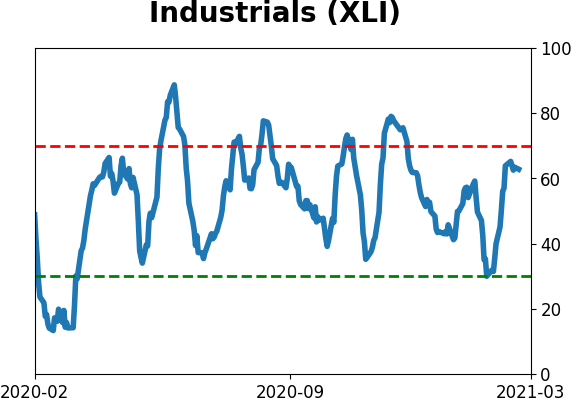
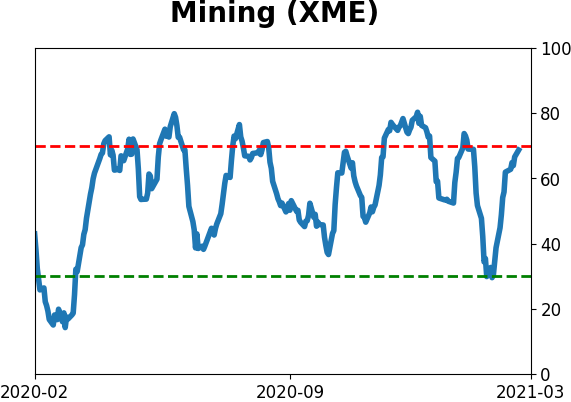
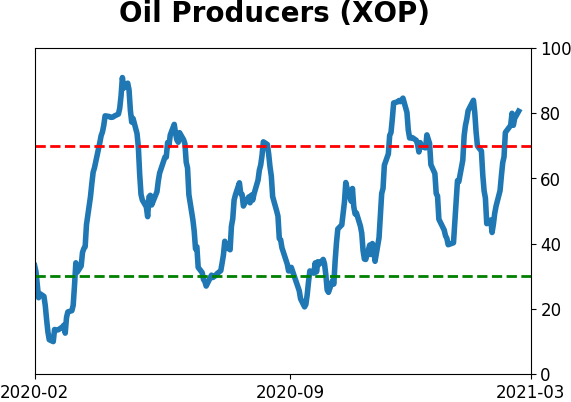
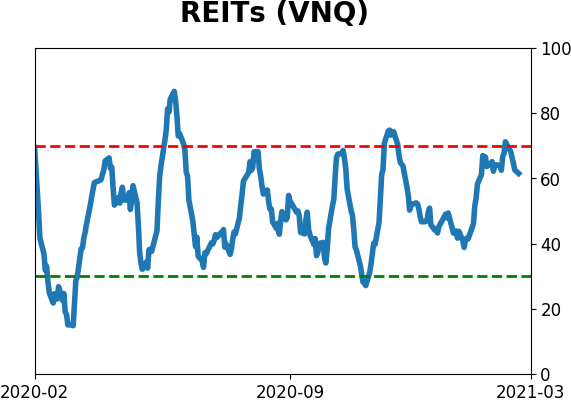
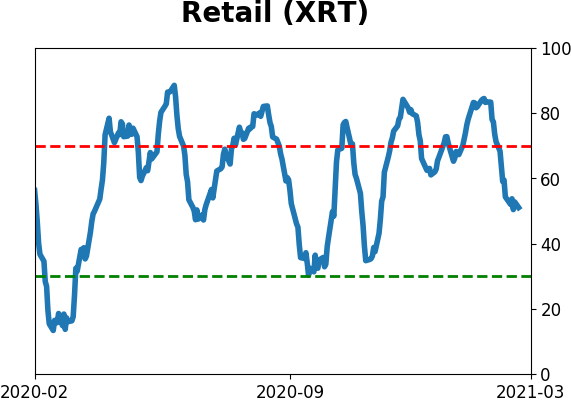
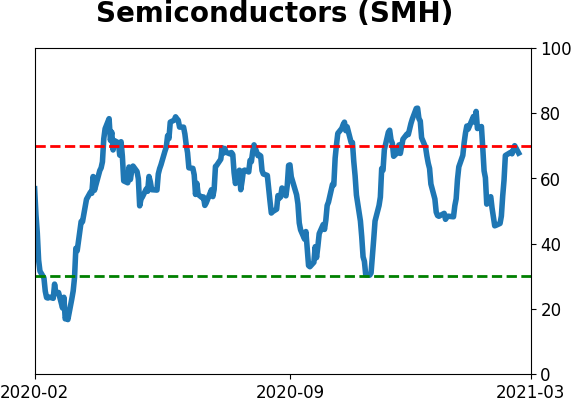
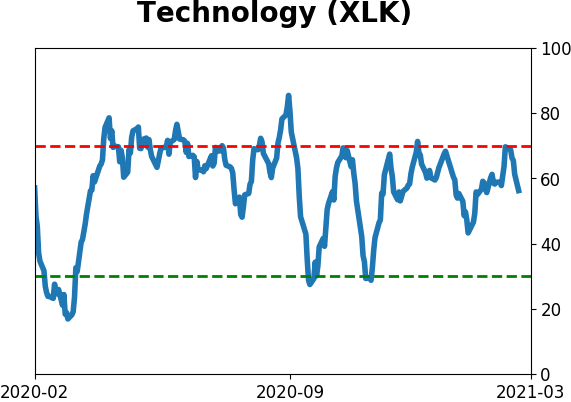
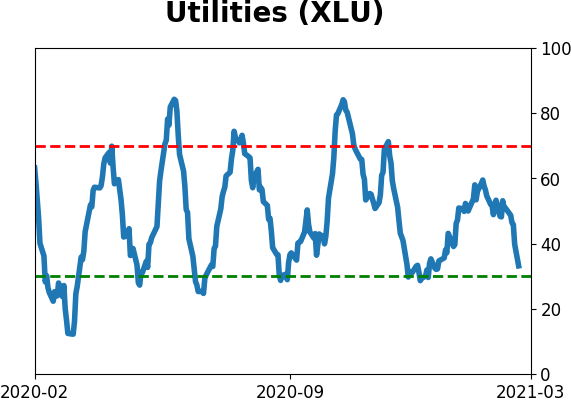
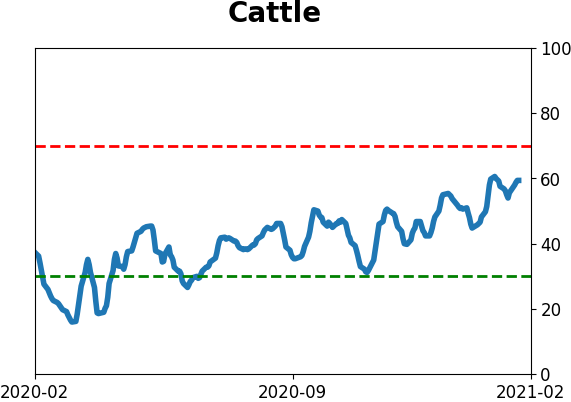
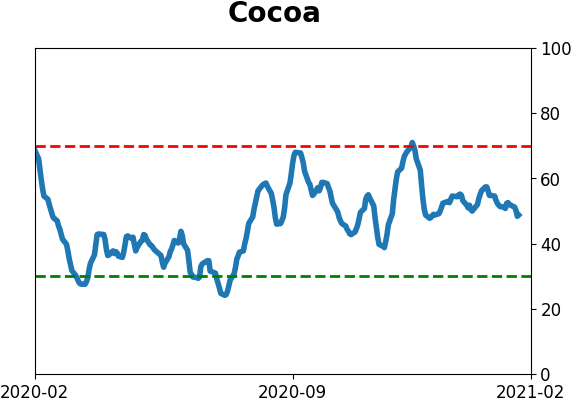
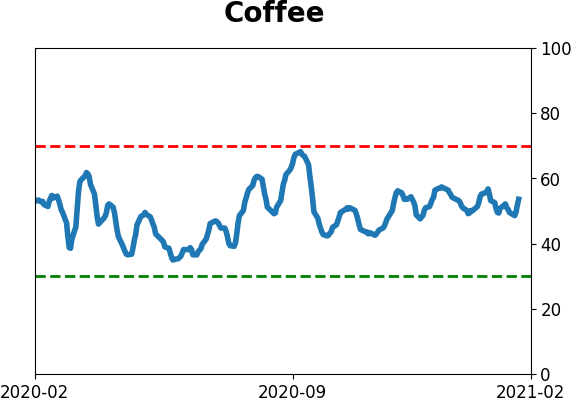
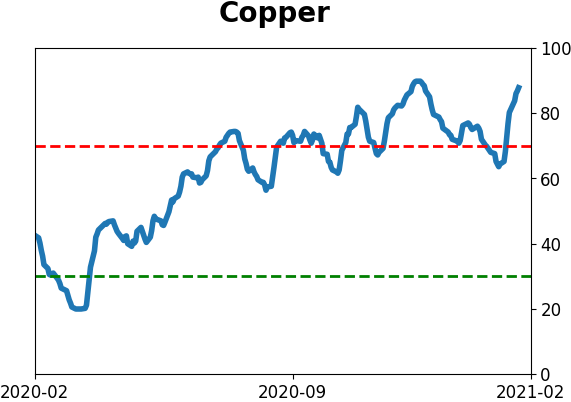
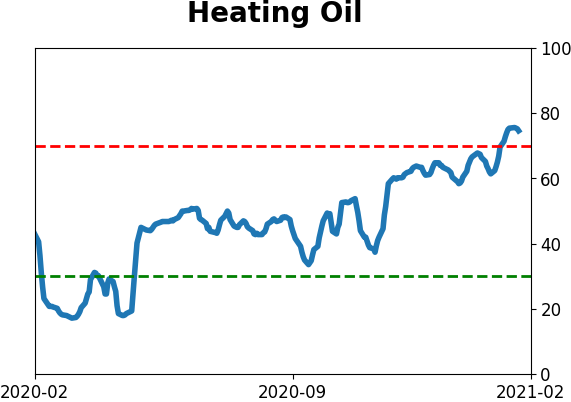
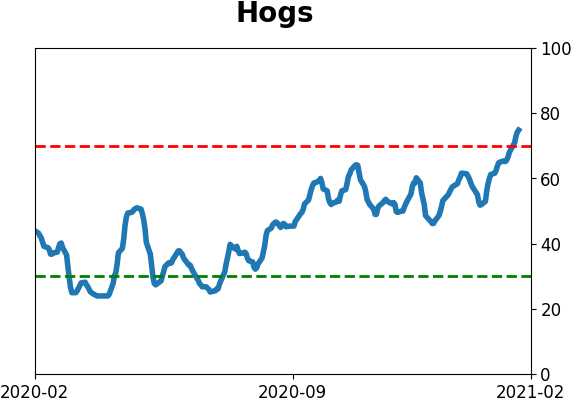
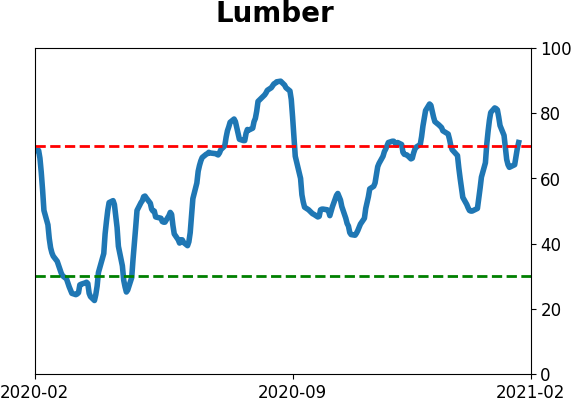
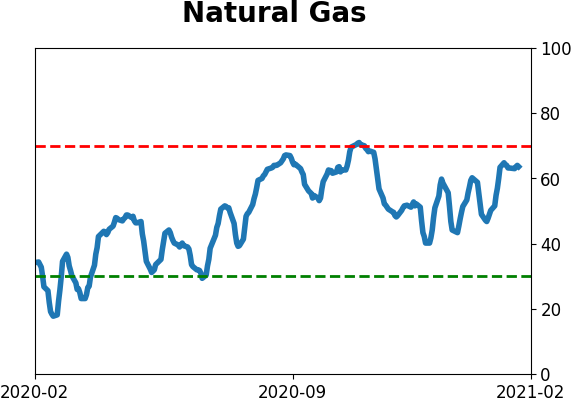
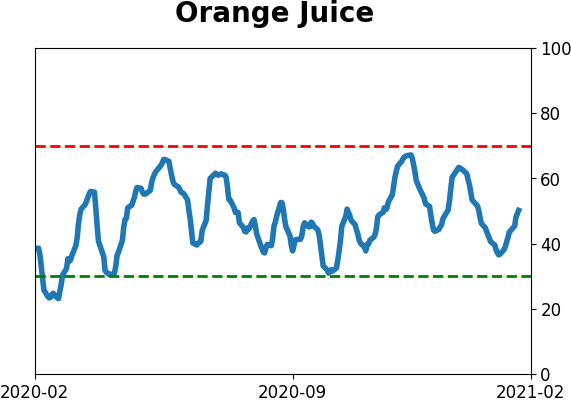
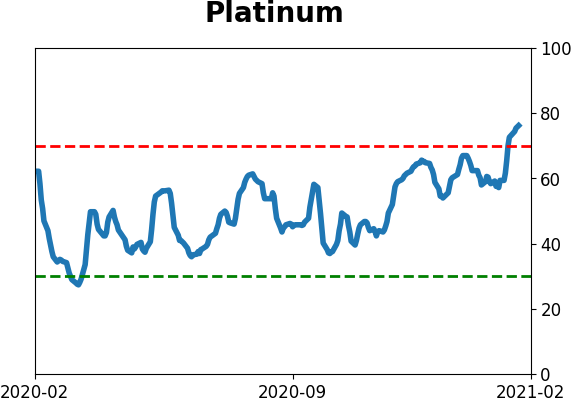
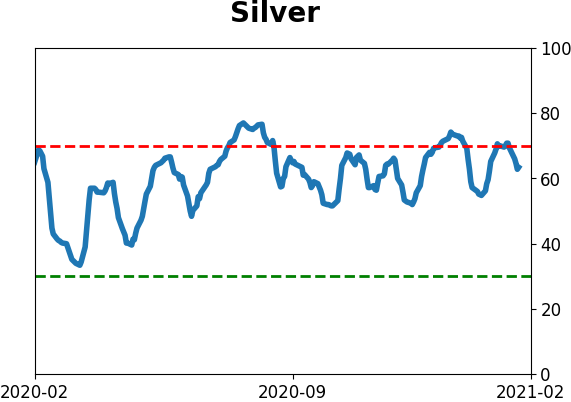
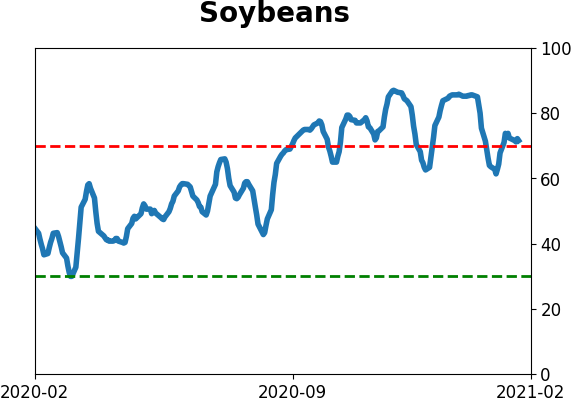
Optimism Index Thumbnails
|
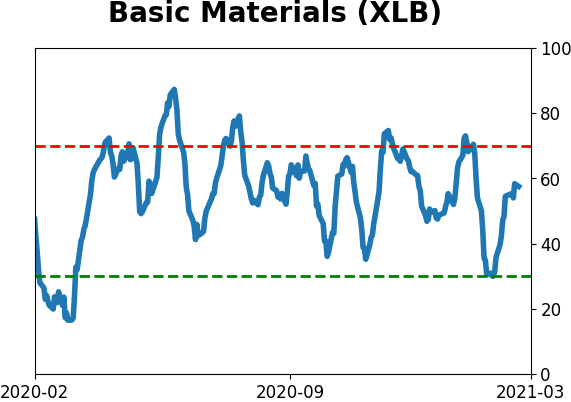
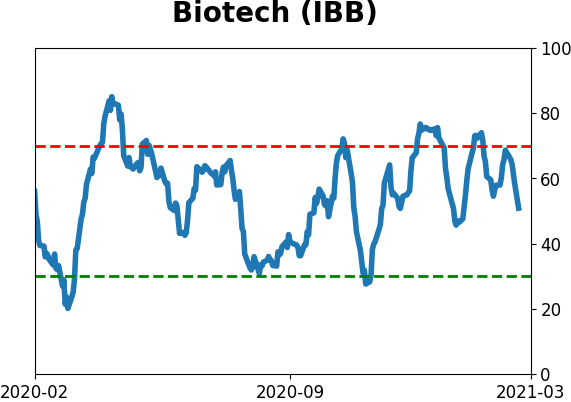
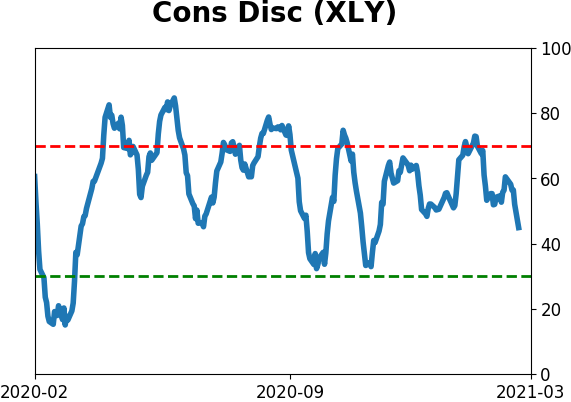
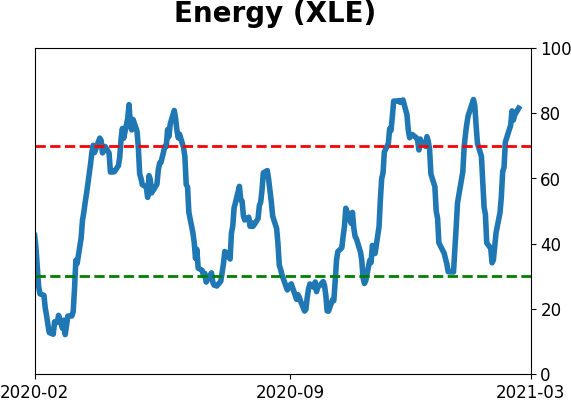
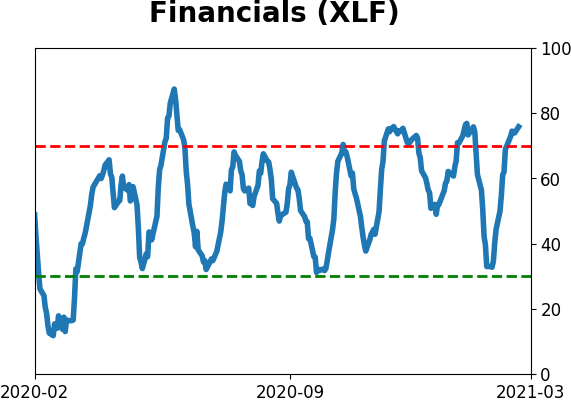
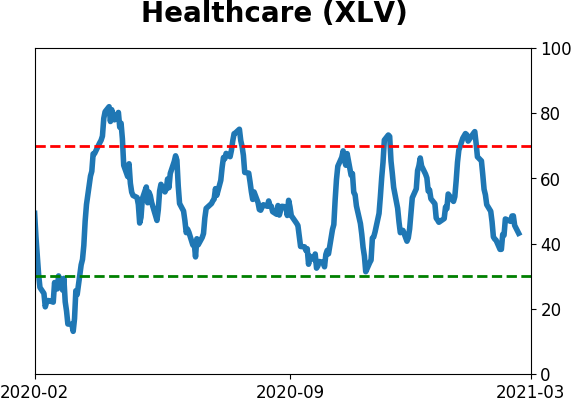
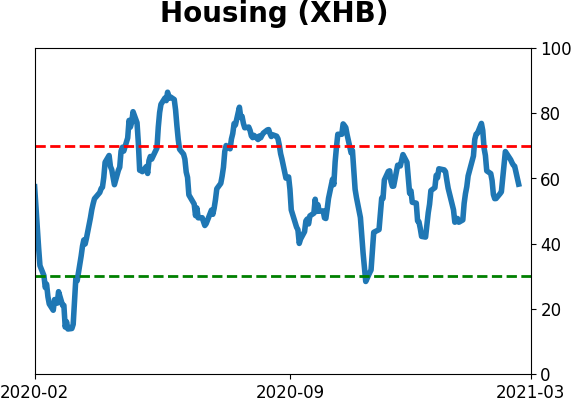
Sector ETF's - 10-Day Moving Average
|
|
|
Country ETF's - 10-Day Moving Average
|
|
|
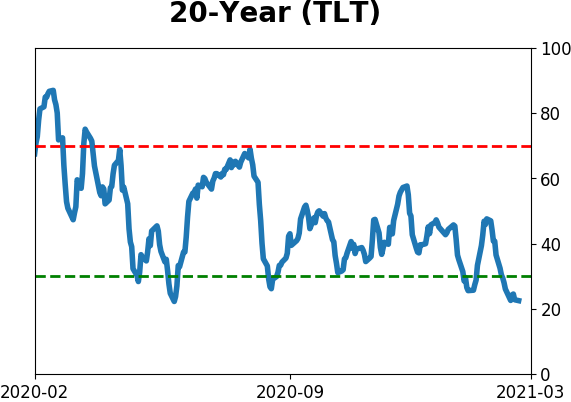
Bond ETF's - 10-Day Moving Average
|
|
|
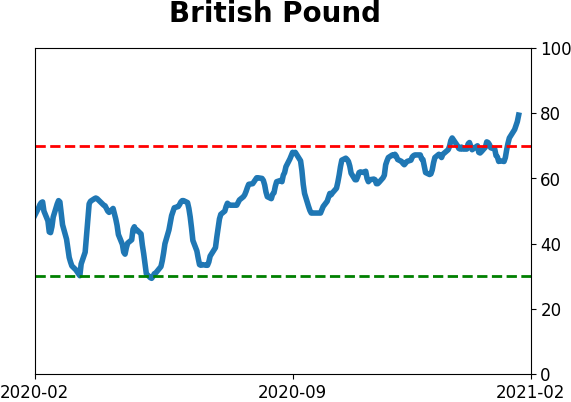
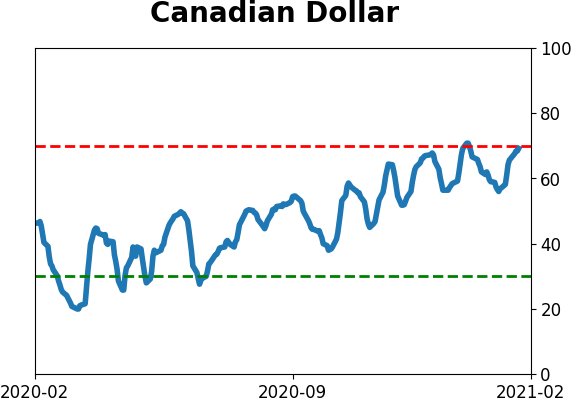
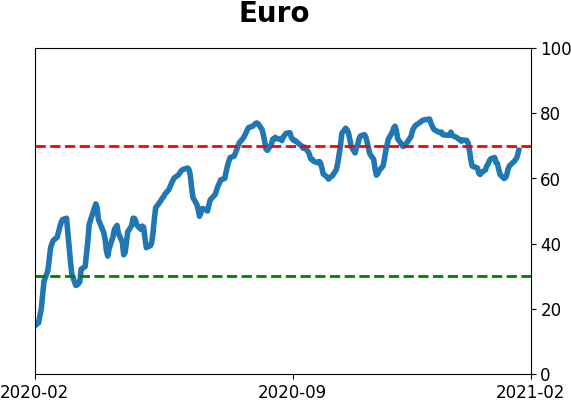
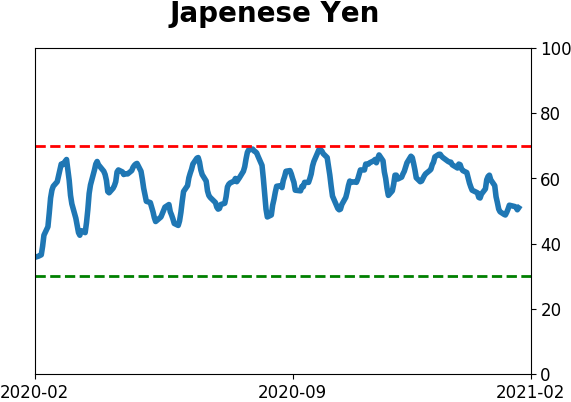
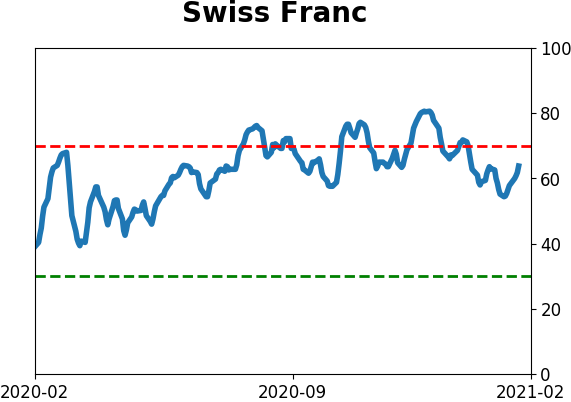
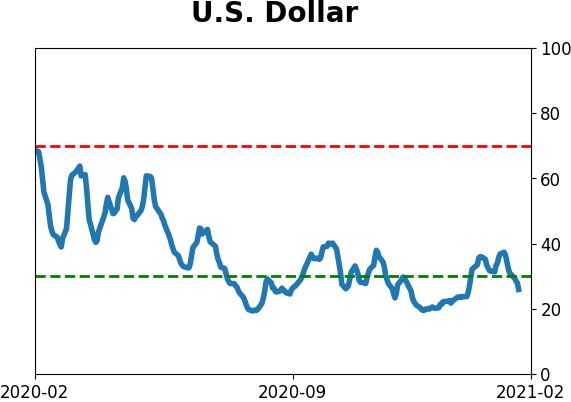
Currency ETF's - 5-Day Moving Average
|
|
|
Commodity ETF's - 5-Day Moving Average
|
|