Headlines
|
|
The Nasdaq loses a couple of its long term positive trends:
The Nasdaq Composite fell below its 200-day moving average for the first time in well over a year. It also fell into correction territory, down more than 10% from its peak, for the first time in over 200 sessions. The Composite tended to see further losses after the ends of other long positive trends.
|
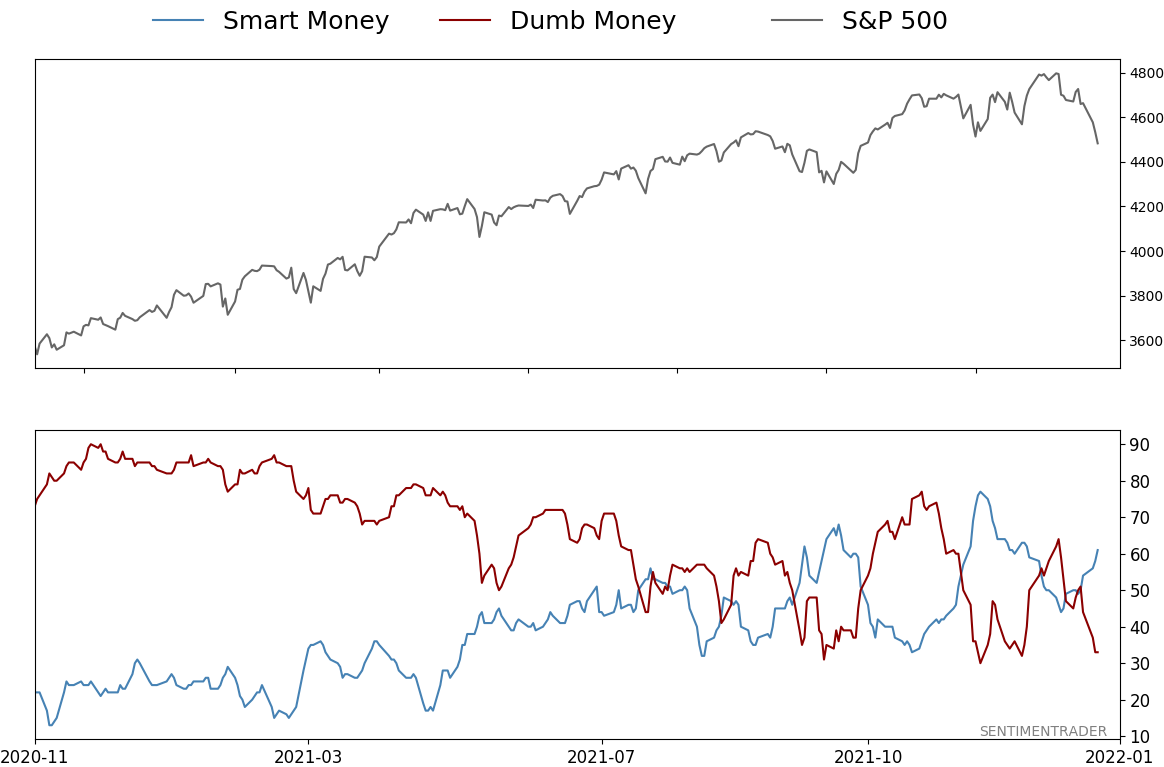
Smart / Dumb Money Confidence
|
Smart Money Confidence: 61%
Dumb Money Confidence: 33%
|
|
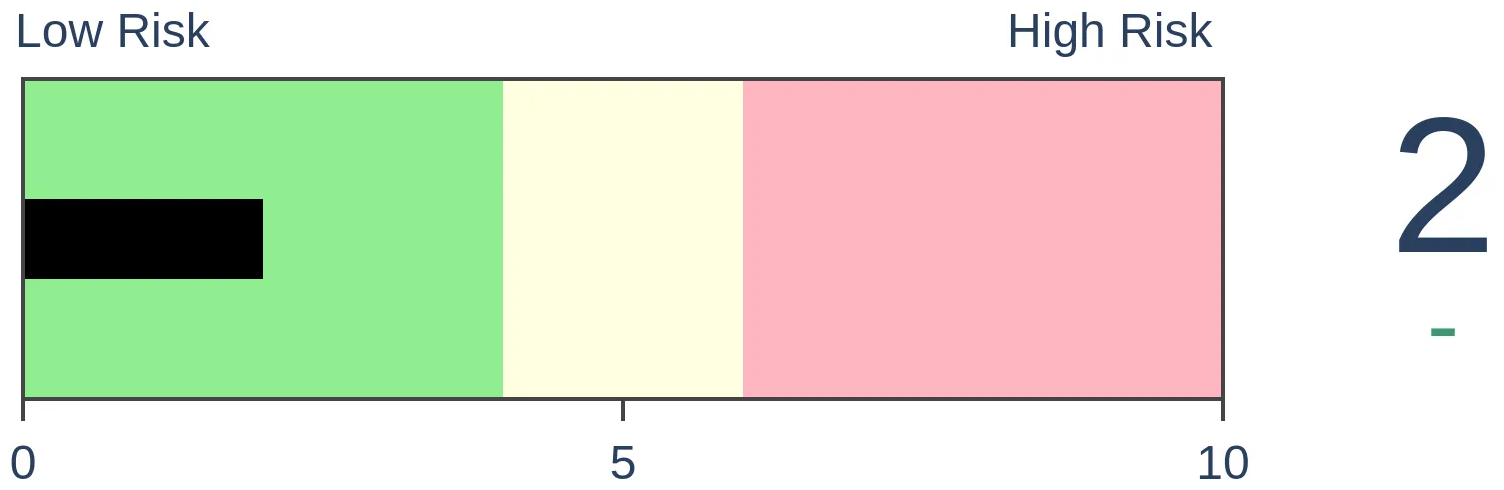
Risk Levels
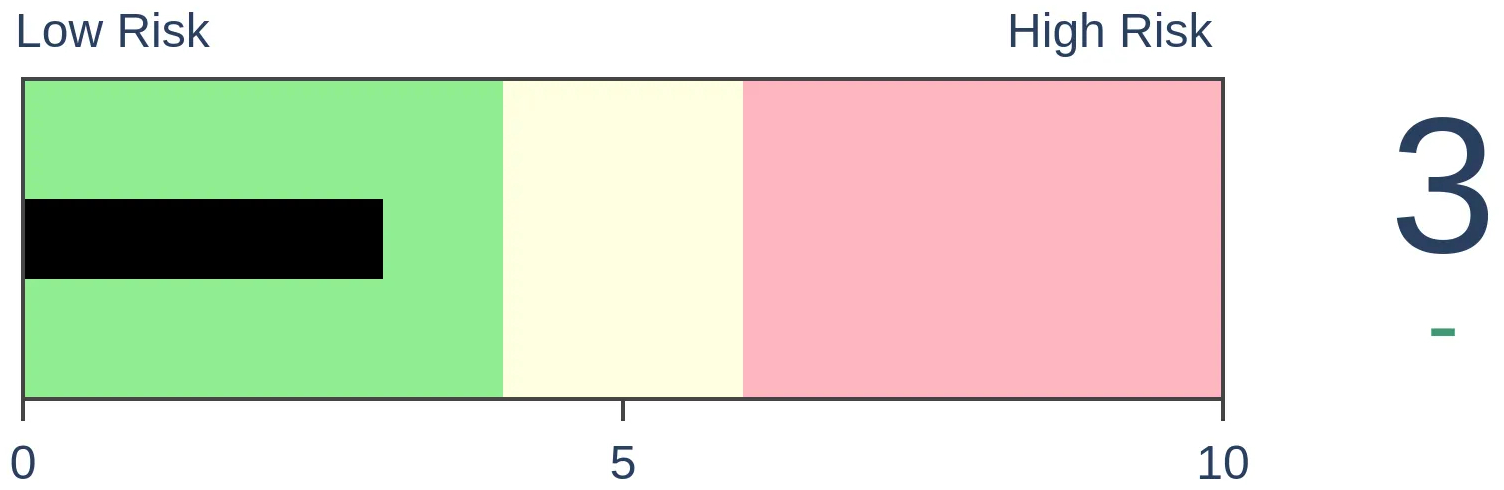
Stocks Short-Term
|
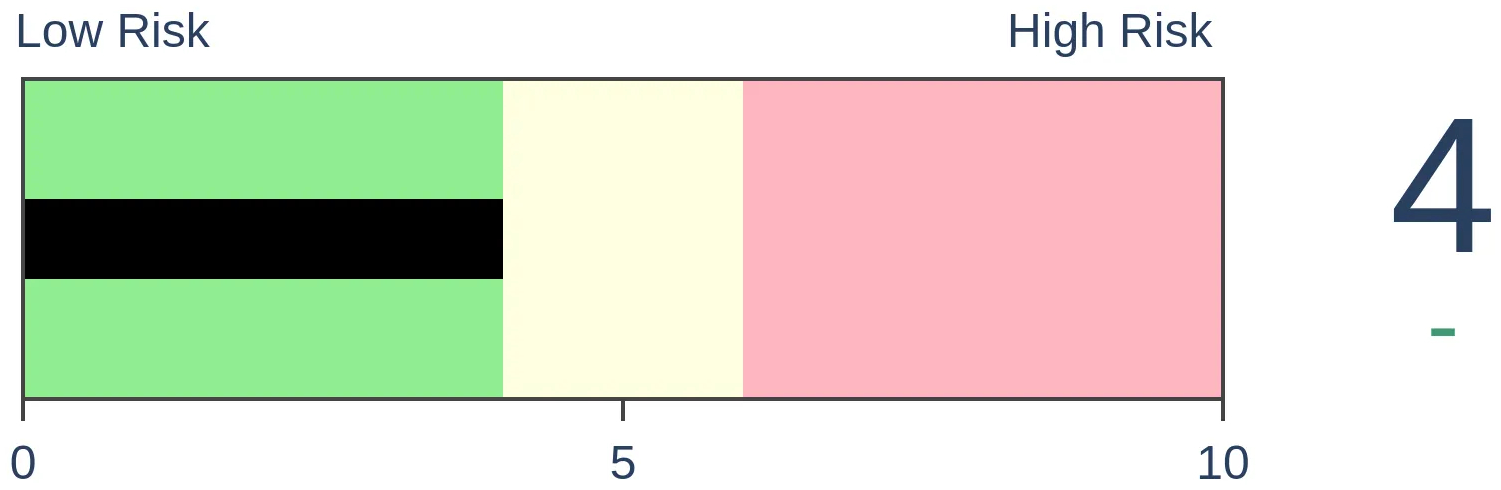
Stocks Medium-Term
|
|
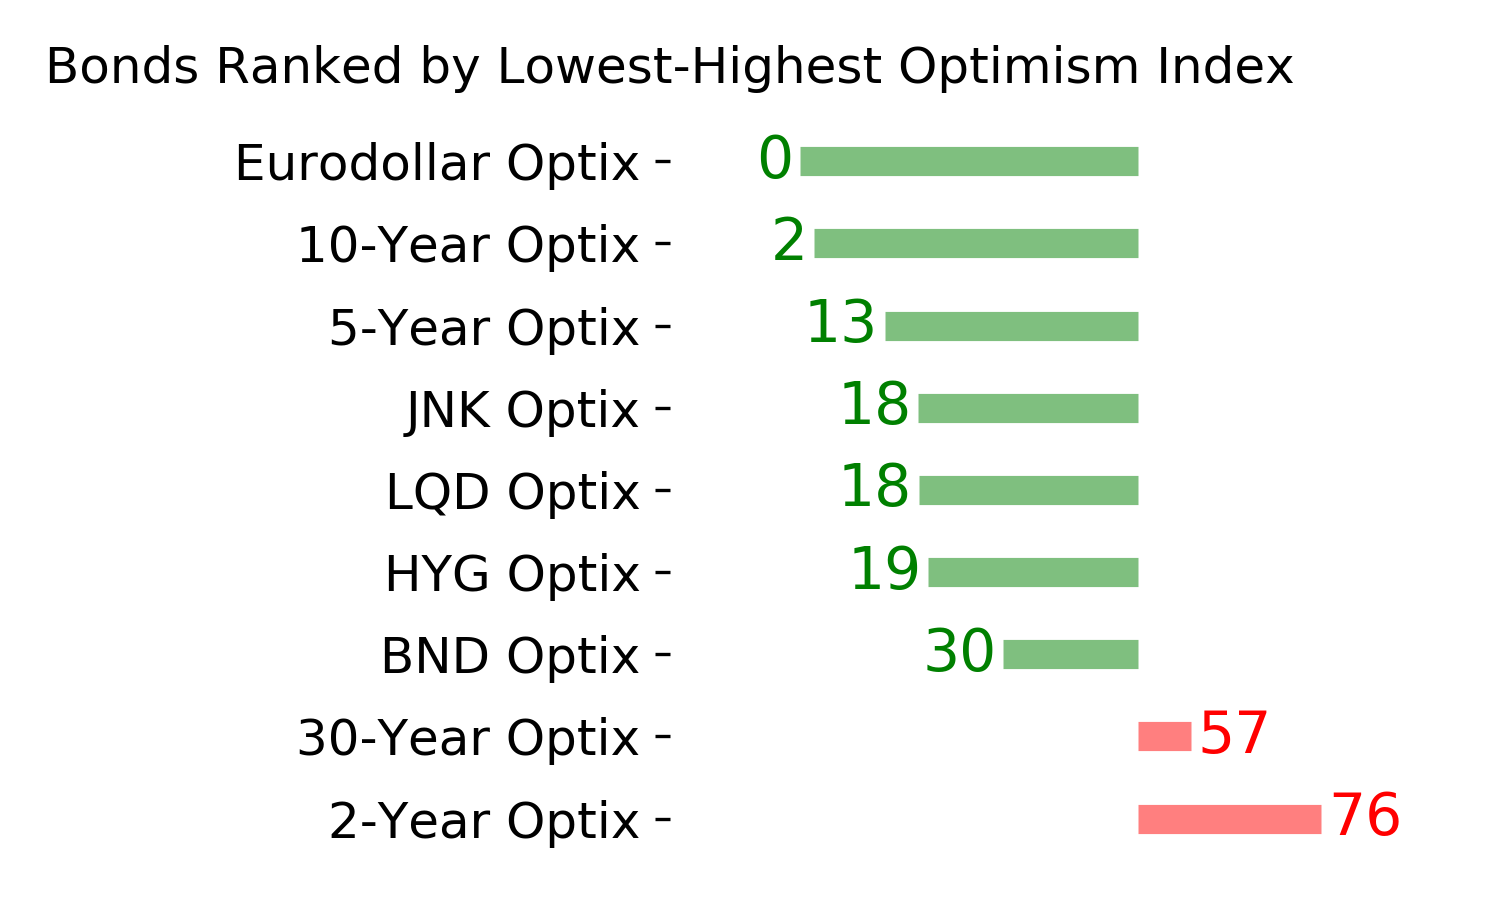
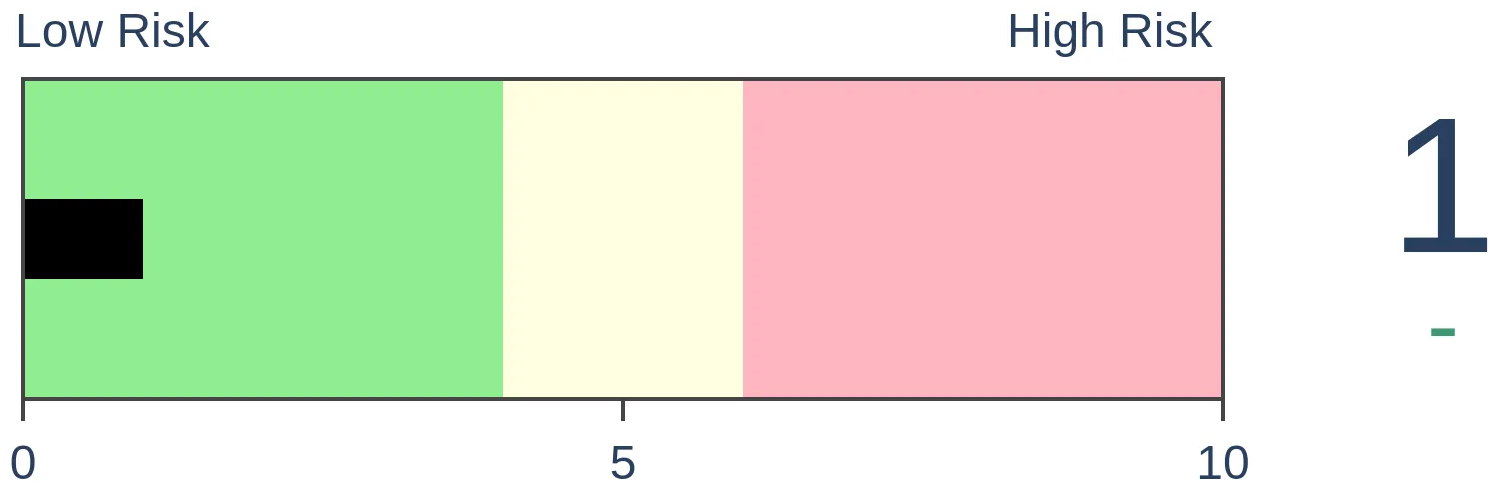
Bonds
|
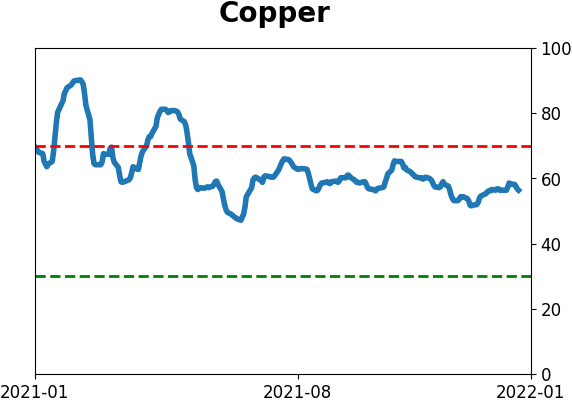
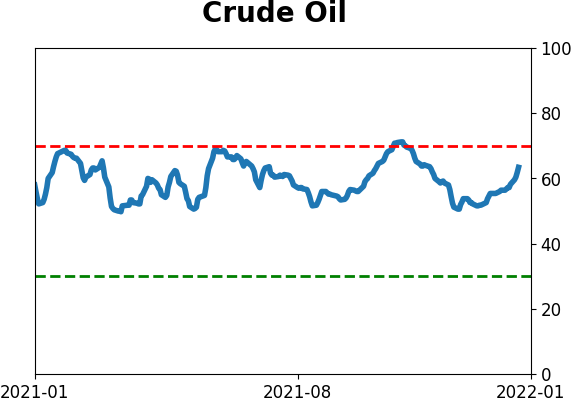
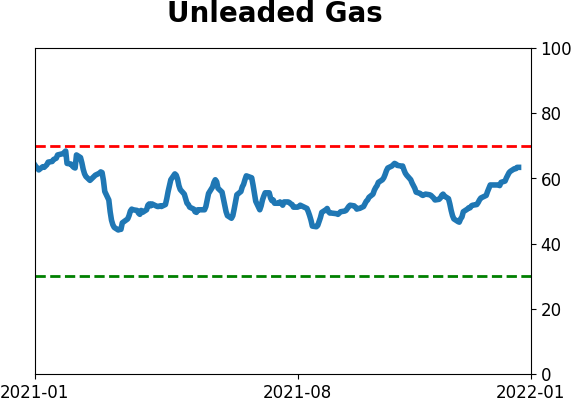
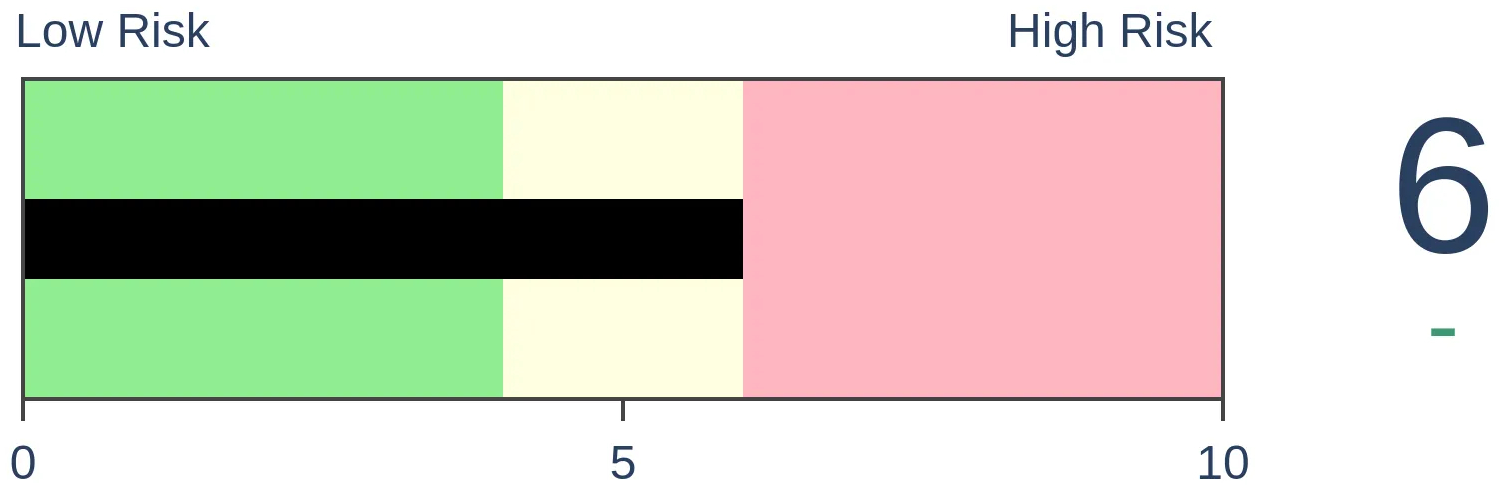
Crude Oil
|
|
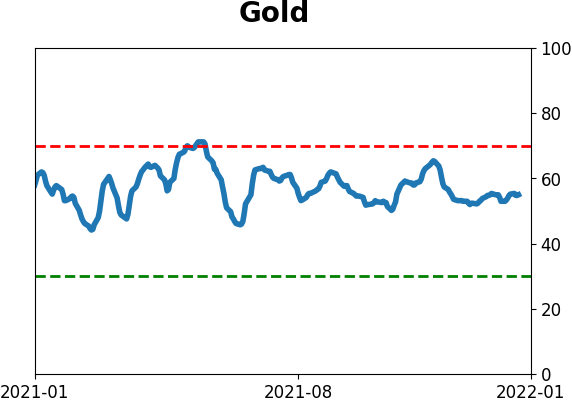
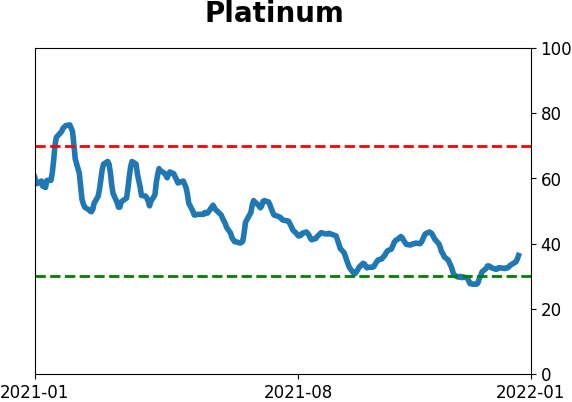
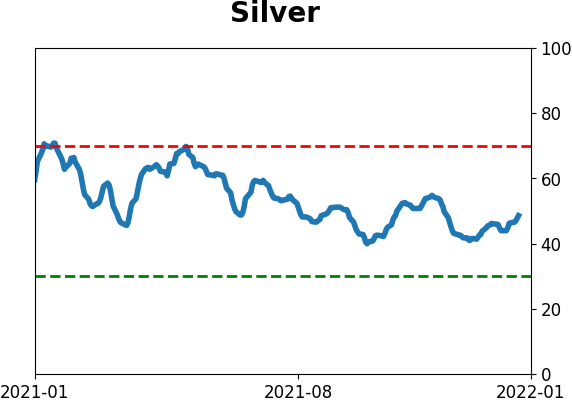
Gold
|
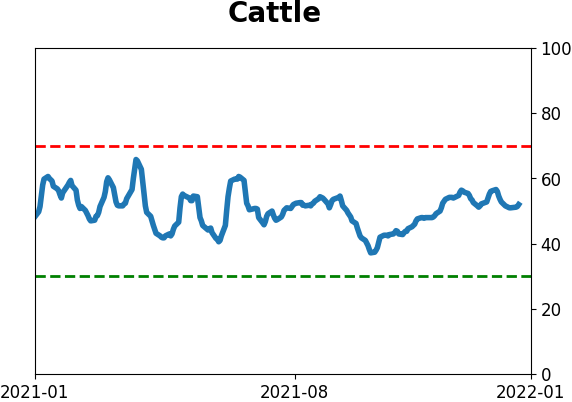
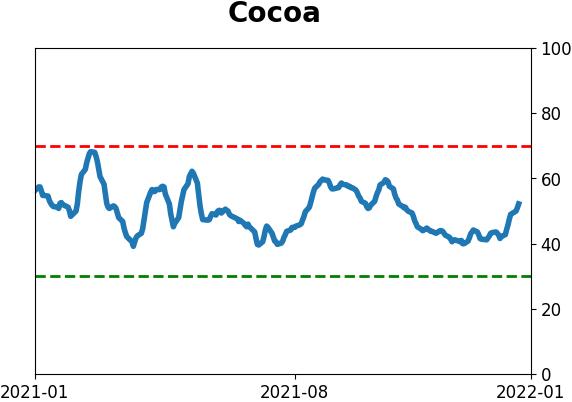
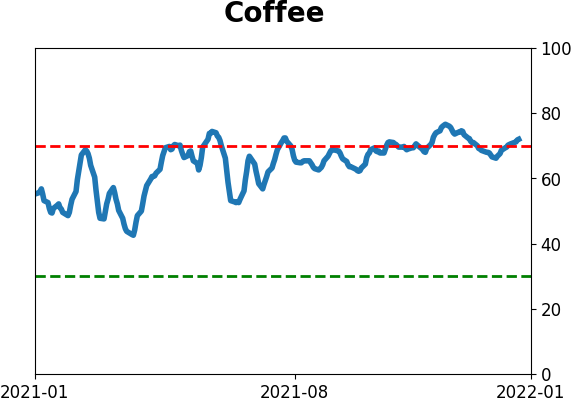
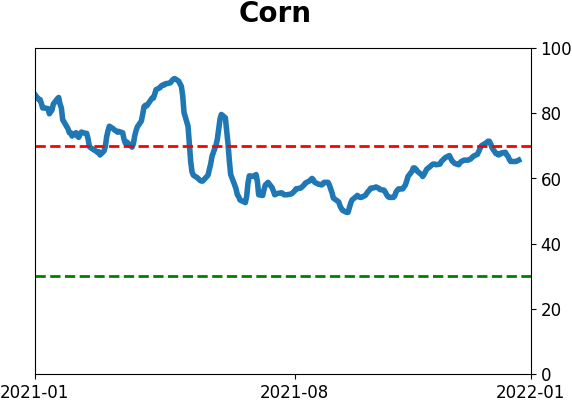
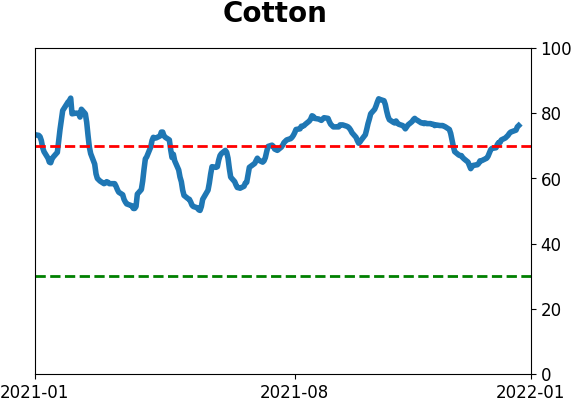
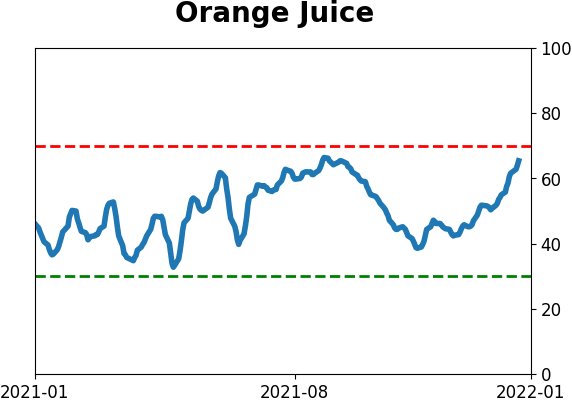
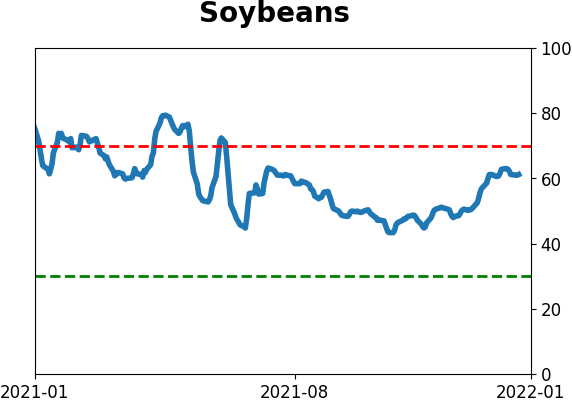
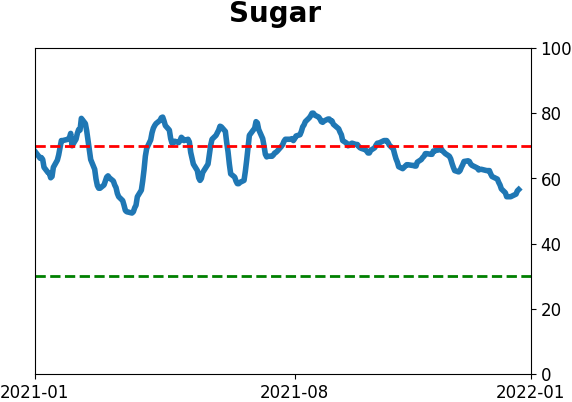
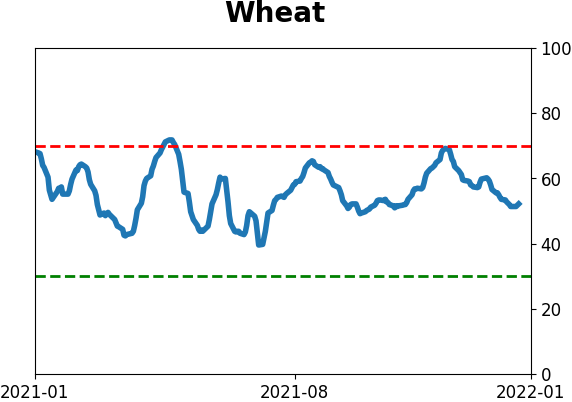
Agriculture

|
|
Research
By Jason Goepfert
BOTTOM LINE
The Nasdaq Composite fell below its 200-day moving average for the first time in well over a year. It also fell into correction territory, down more than 10% from its peak, for the first time in over 200 sessions. The Composite tended to see further losses after the ends of other long positive trends.
FORECAST / TIMEFRAME
ONEQ -- Down, Medium-Term
|
Key points:
- The Nasdaq Composite fell below its 200-day average for the 1st time in over a year
- It also fell into correction territory for the first time in over 200 days
- The losses of other long positive trends tended to see medium-term selling pressure
The Nasdaq has lost its long-term trend
A couple of weeks ago, we saw a historic number of securities on the Nasdaq had been cut in half. While similar (though less extreme) behavior wasn't necessarily a negative for an index like the Nasdaq Composite, there were some troubling precedents.
That internal deterioration has come home to roost, and the Composite has declined below its 200-day moving average for the first time in more than 400 days, ending its 3rd-longest streak above that long-term average.
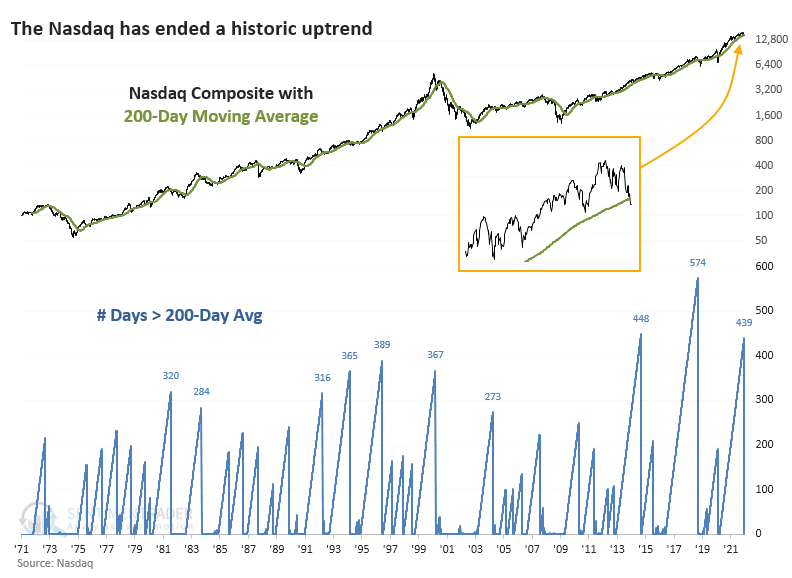
After other times the Nasdaq fell below its average for the first time in at least a year, waning momentum weighed on the index. In 1996 and 2014, the Nasdaq almost immediately reversed and charged higher. Other than those two exceptions, the index tended to struggle for months.
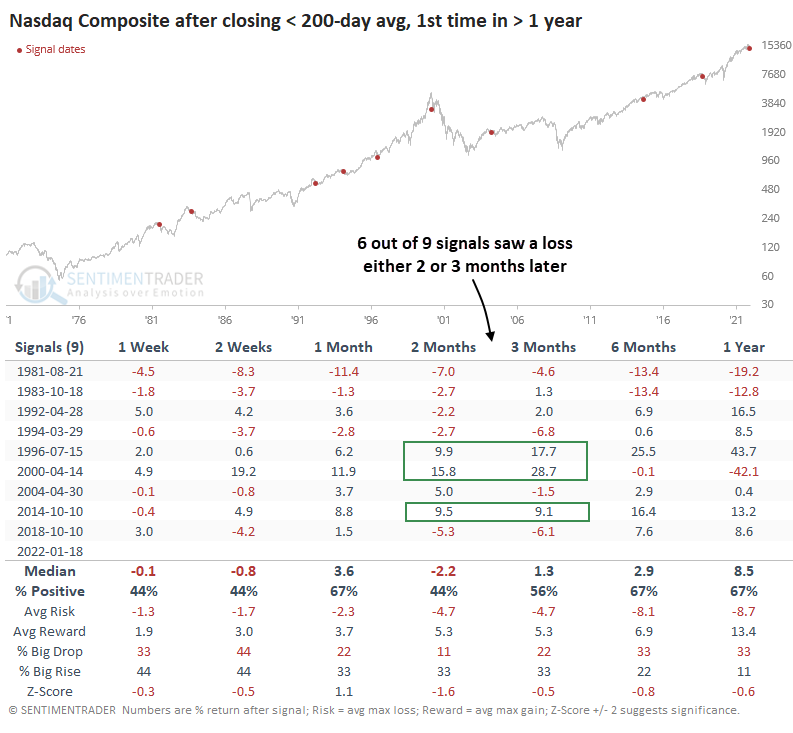
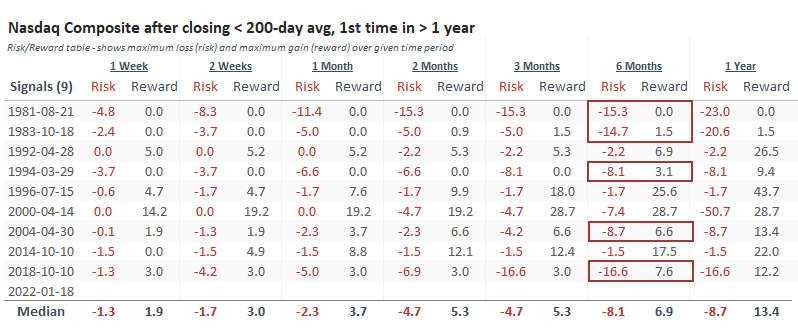
The Risk/Reward Table shows that over the next 6 months, there was more risk than reward after 5 of the 9 signals. That's not decisive, but it's relatively unusual for an index that showed such a strong tendency to move up and to the right.
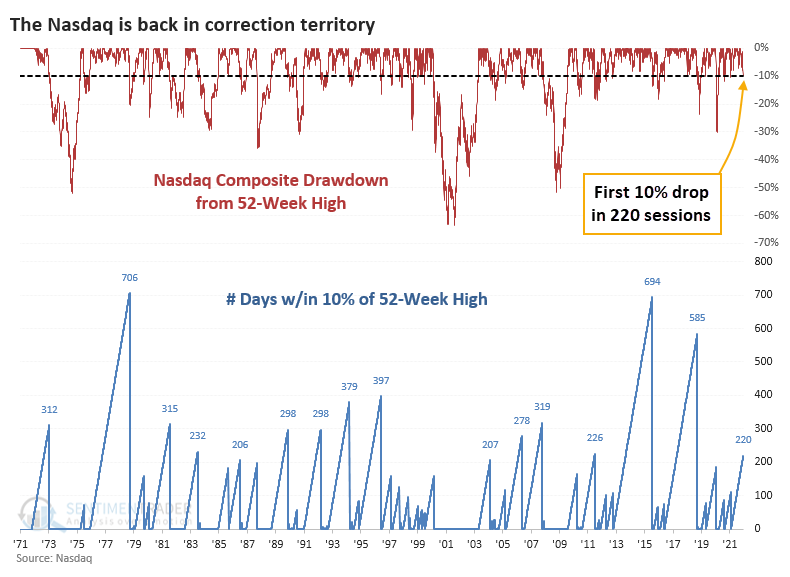
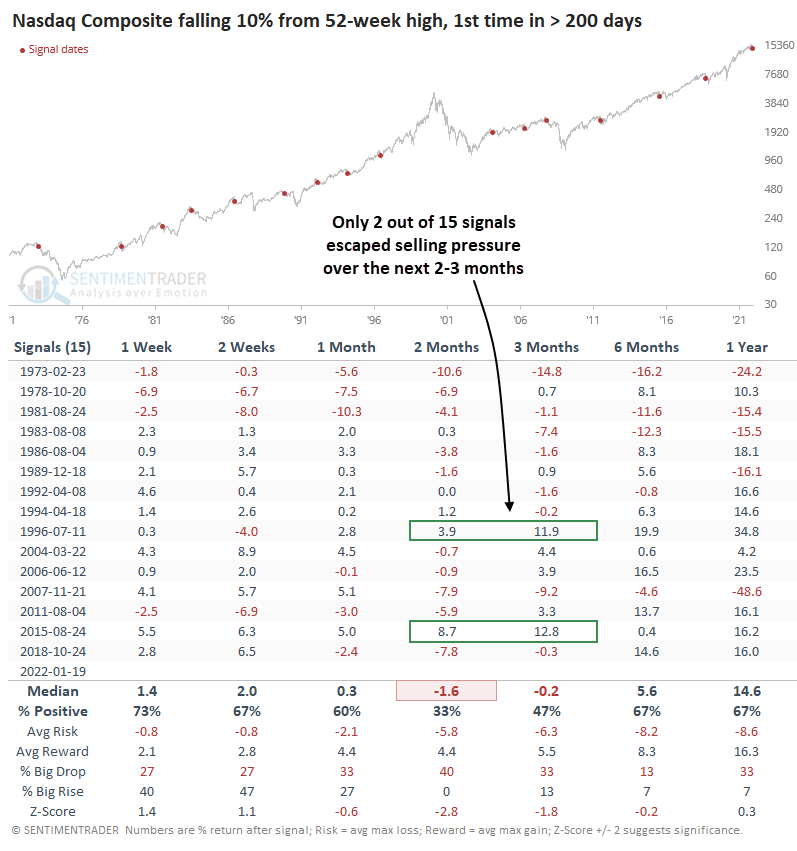
Falling into correction territory
The selling pressure in recent days has also been enough to drag the Composite into correction territory, down more than 10% from its peak. This is the first time in more than 200 sessions that the index was more than 10% below its high.
In the very short-term, bulls made a stand after these streaks ended, with the Composite rebounding during the next week after 11 out of the last 12 signals. But over the next 2 months, the Nasdaq showed a positive return only 33% of the time, and all but 2 of the signals saw a negative return either 2 or 3 months later.
What the research tells us...
There has been a large cluster of technical warning signs, and investors have shown more risk-off behavior in a market environment that is turning unhealthy. This is usually about when markets bottom and quickly reverse their losses during strong uptrends. We have our doubts about this one, and the failures of some long-term trends in leading stocks and indexes are one reason why. For the Nasdaq specifically, the Composite index is catching down to many of its securities, and that tends to lead to more selling pressure.
Active Studies
| Time Frame | Bullish | Bearish | | Short-Term | 2 | 0 | | Medium-Term | 13 | 2 | | Long-Term | 13 | 5 |
|
Indicators at Extremes
Portfolio
| Position | Description | Weight % | Added / Reduced | Date | | Stocks | RSP | 10.8 | Reduced 9.1% | 2022-01-20 | | Bonds | 32.7% BND, 7.1% SCHP | 40.1 | Added 8.3% | 2021-10-26 | | Commodities | GCC | 2.4 | Reduced 2.1%
| 2020-09-04 | | Precious Metals | GDX | 4.6 | Reduced 4.2% | 2021-05-19 | | Special Situations | 8.1% KWEB, 3.6% XLE, 1.7% PSCE | 13.4 | Reduced 3.9% | 2022-01-18 | | Cash | | 28.0 | | |
|
Updates (Changes made today are underlined)
Not impressed at all with the market action since there was a breadth thrust at the end of December, with selling pressure hitting consistently since then. The drawdown is beyond what we've typically seen after similar thrusts. More and more indicators are showing risk-off sentiment, and the market environment is sketchy. I've reduced risk because of it. Bond sentiment is trying to recover from a recent bout of pessimism, and gold stocks are doing their thing which is not much at all. They've been flat for six months. Chinese tech stocks were doing exactly what they're supposed to do, then did *not* by plunging to new lows. This is troubling on a shorter-term time frame, but this was never meant for a trade, rather a multi-year investment. Recent behavior is troubling and I will not be adding any exposure as long as that's the case. RETURN YTD: -0.1% 2021: +8.7%, 2020: +8.1%, 2019: +12.6%, 2018: +0.6%, 2017: +3.8%, 2016: +17.1%, 2015: +9.2%, 2014: +14.5%, 2013: +2.2%, 2012: +10.8%, 2011: +16.5%, 2010: +15.3%, 2009: +23.9%, 2008: +16.2%, 2007: +7.8%
|
|
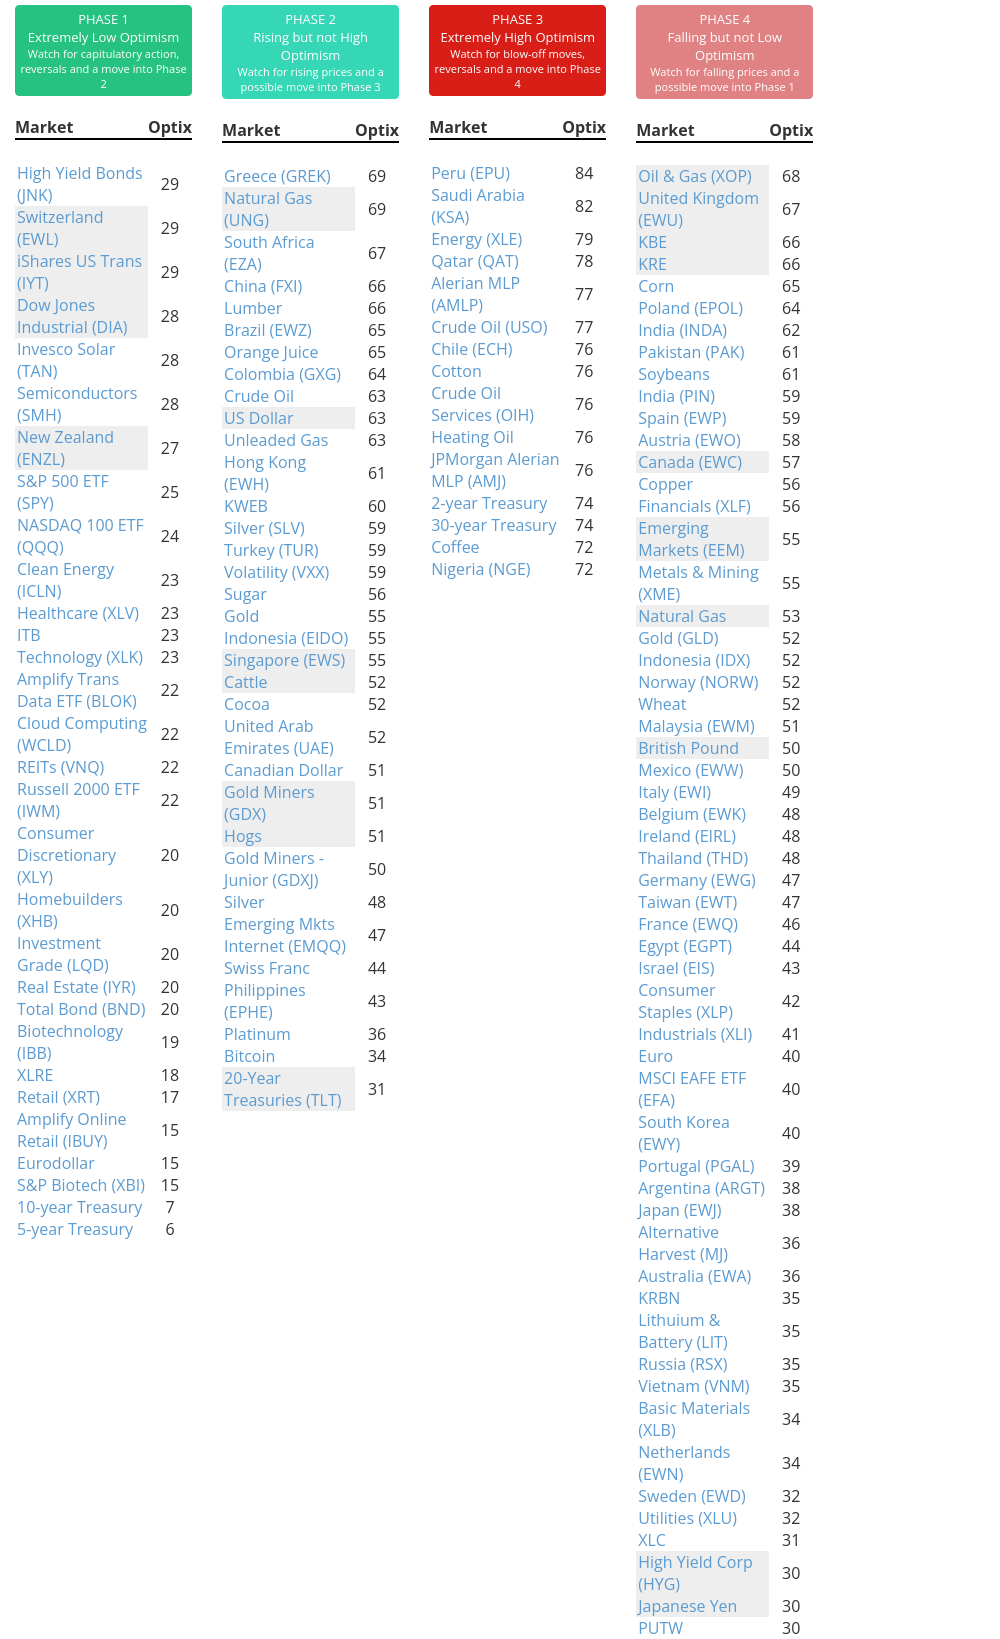
Phase Table
Ranks
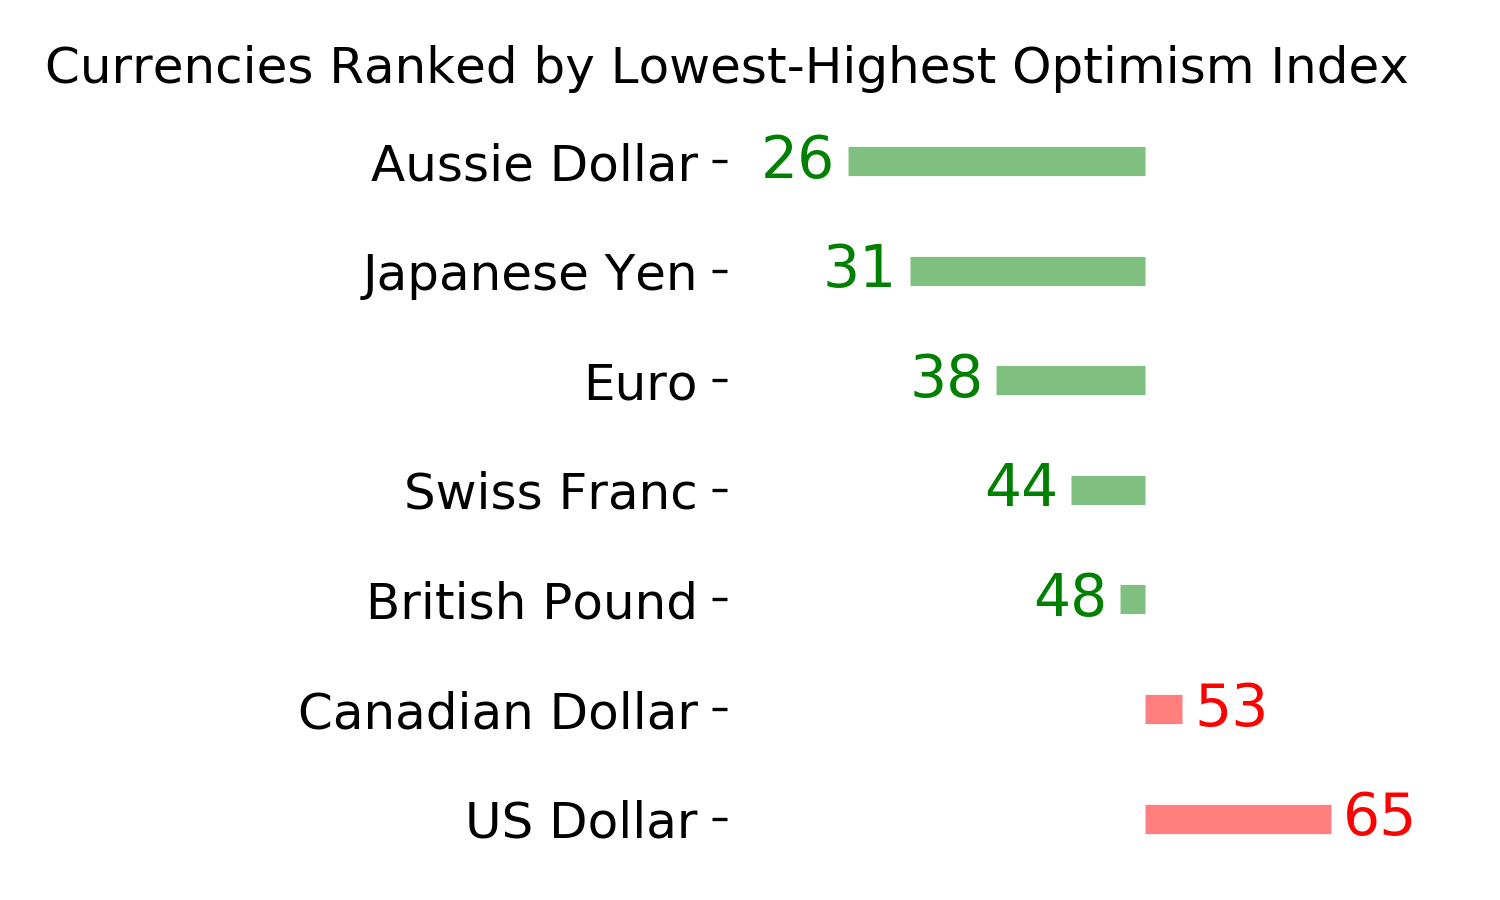
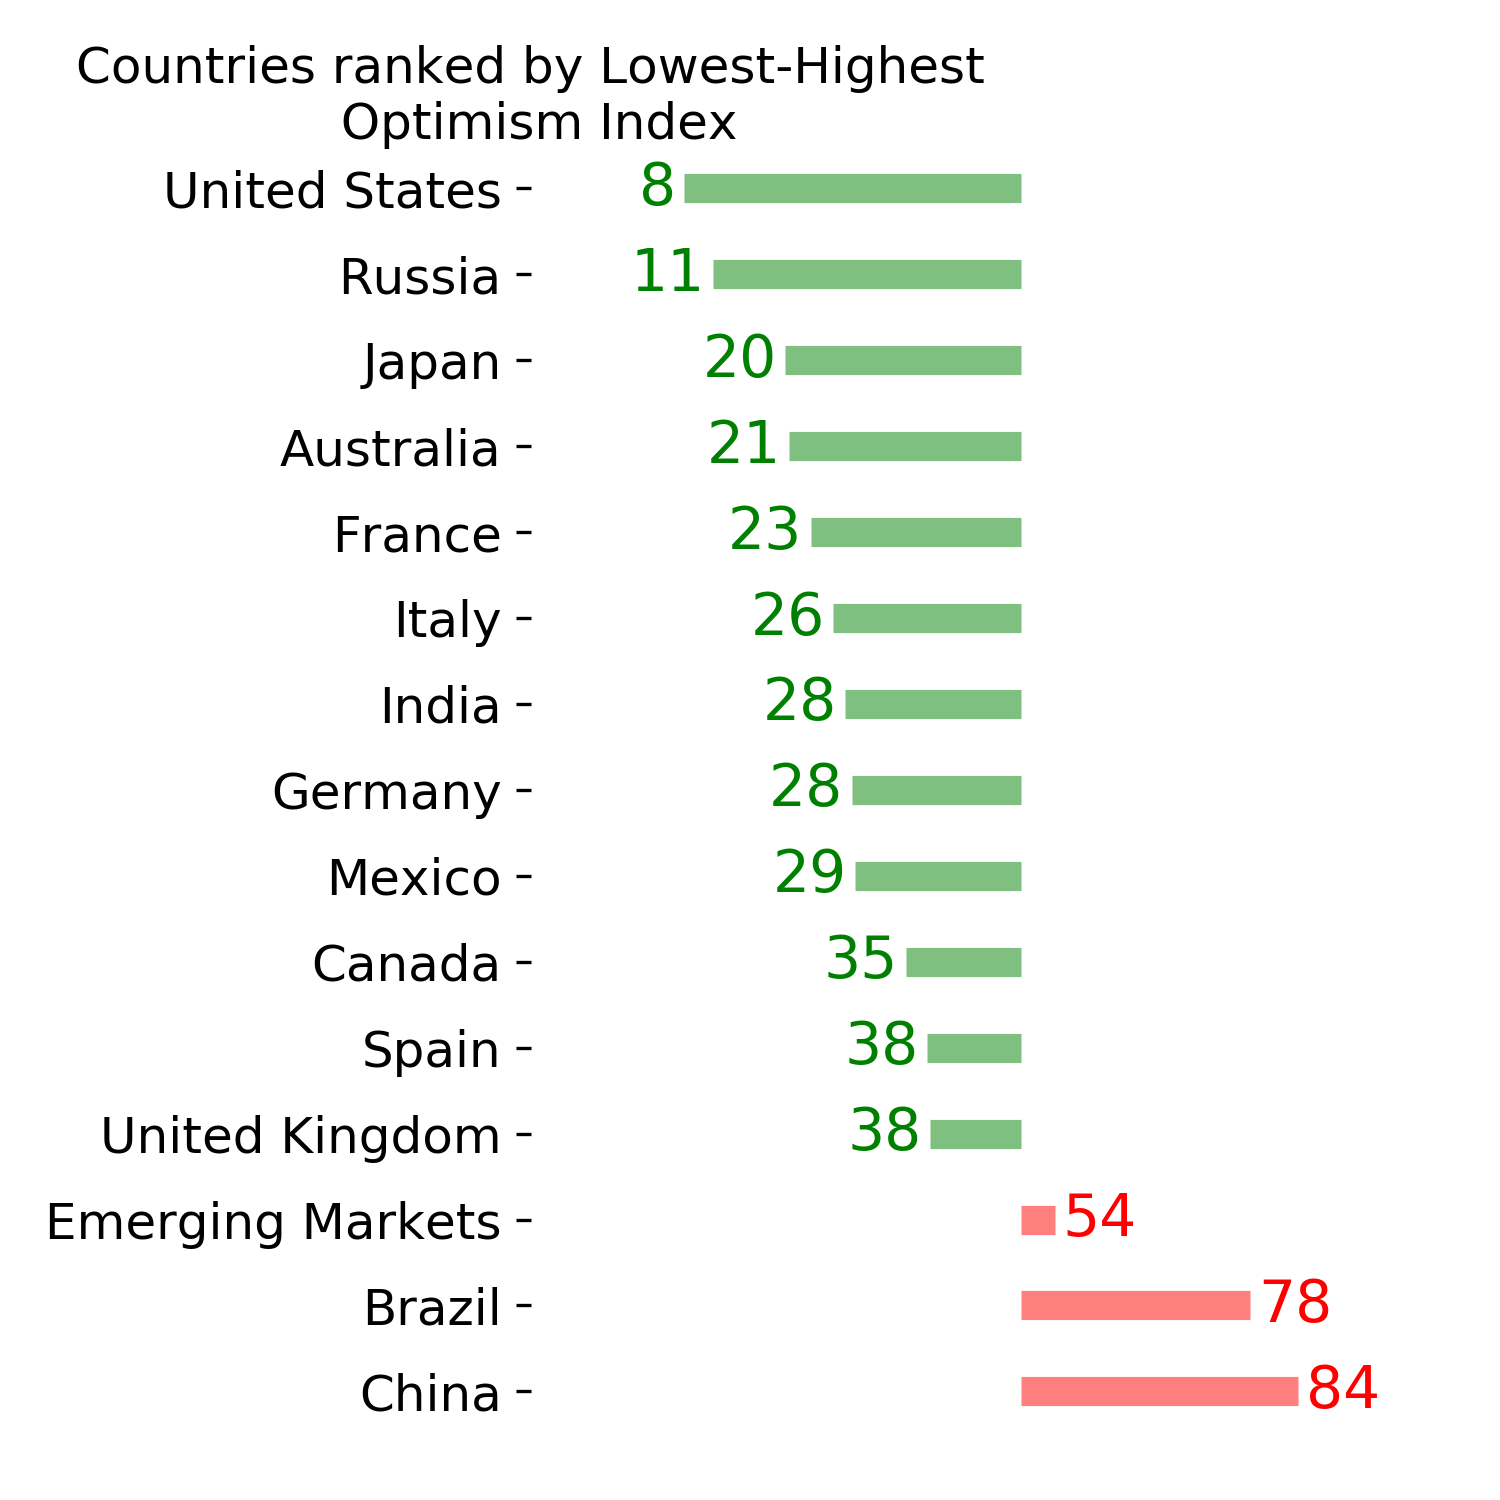
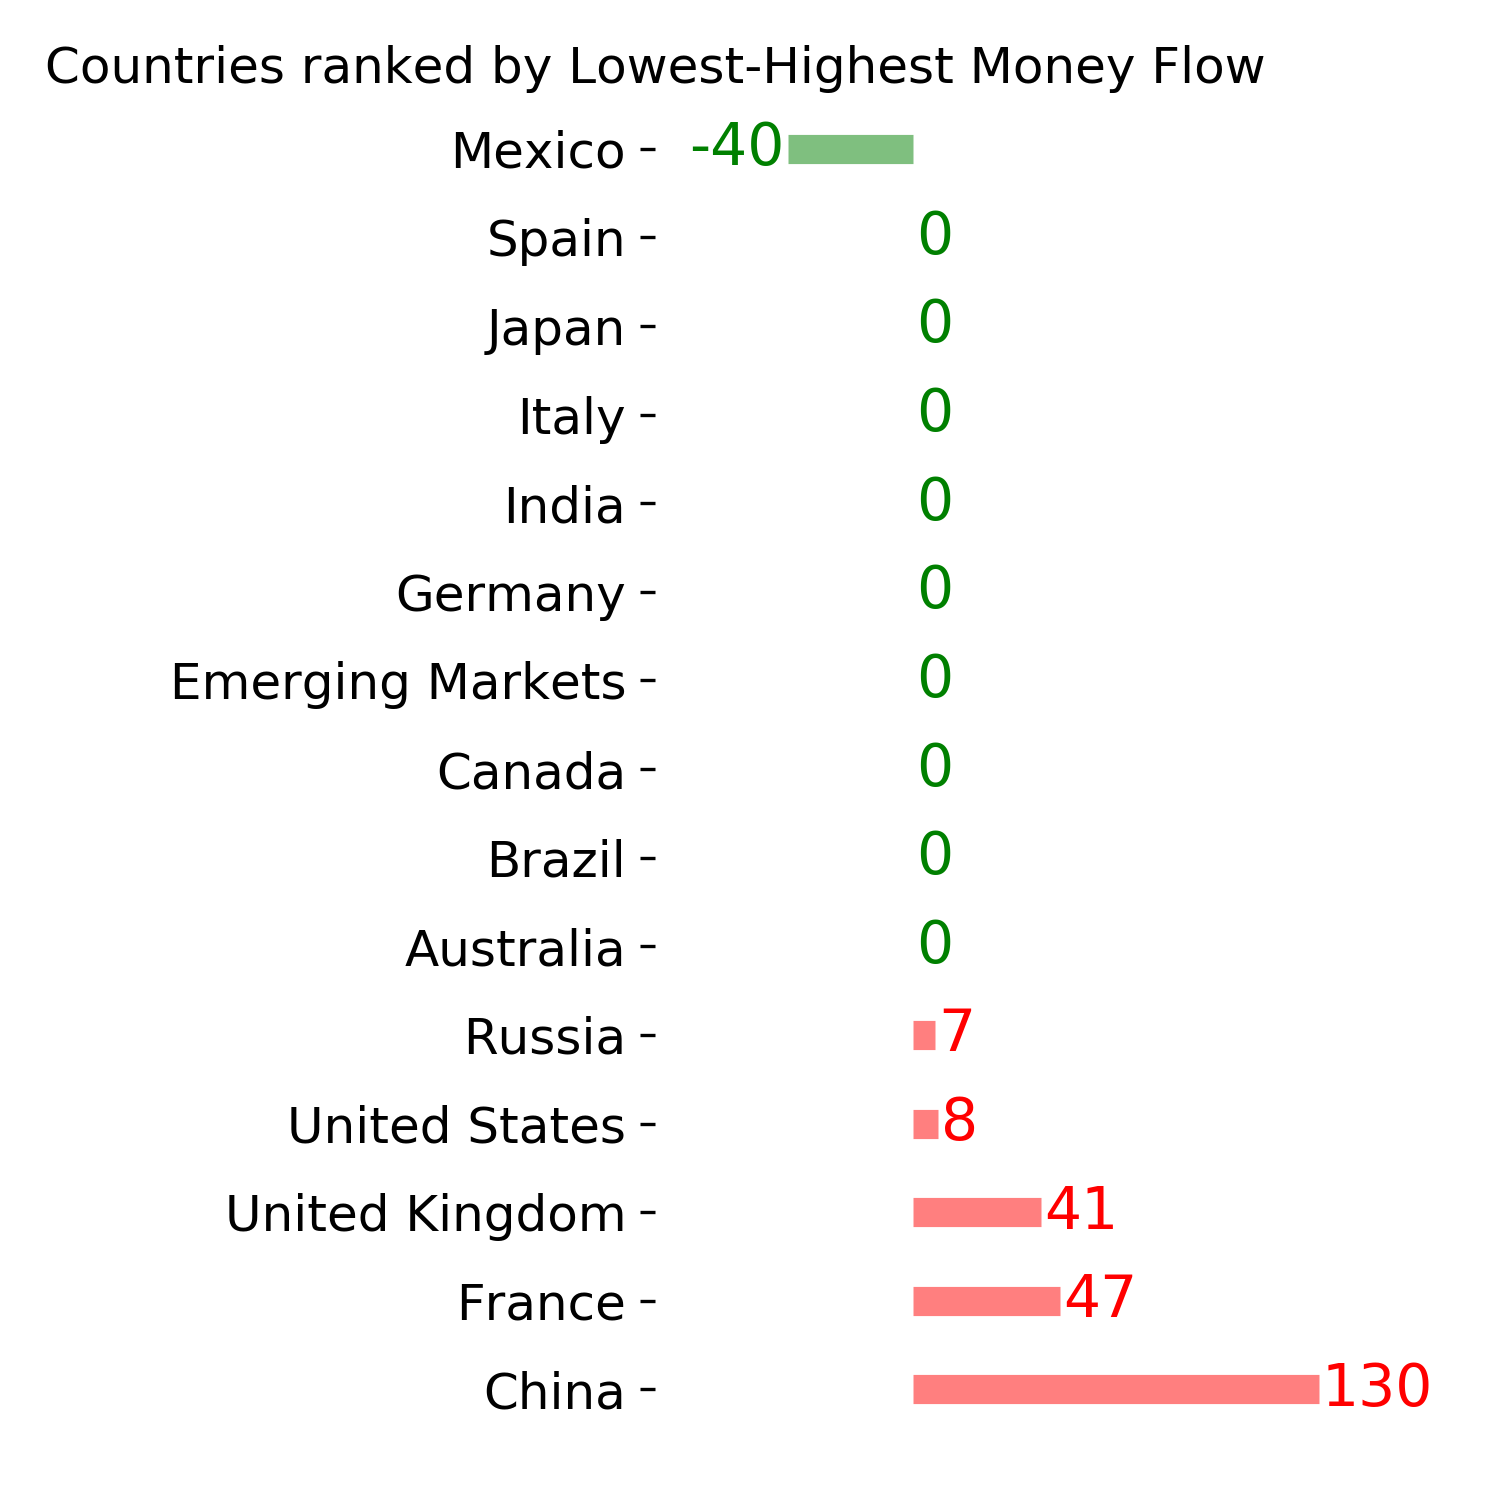
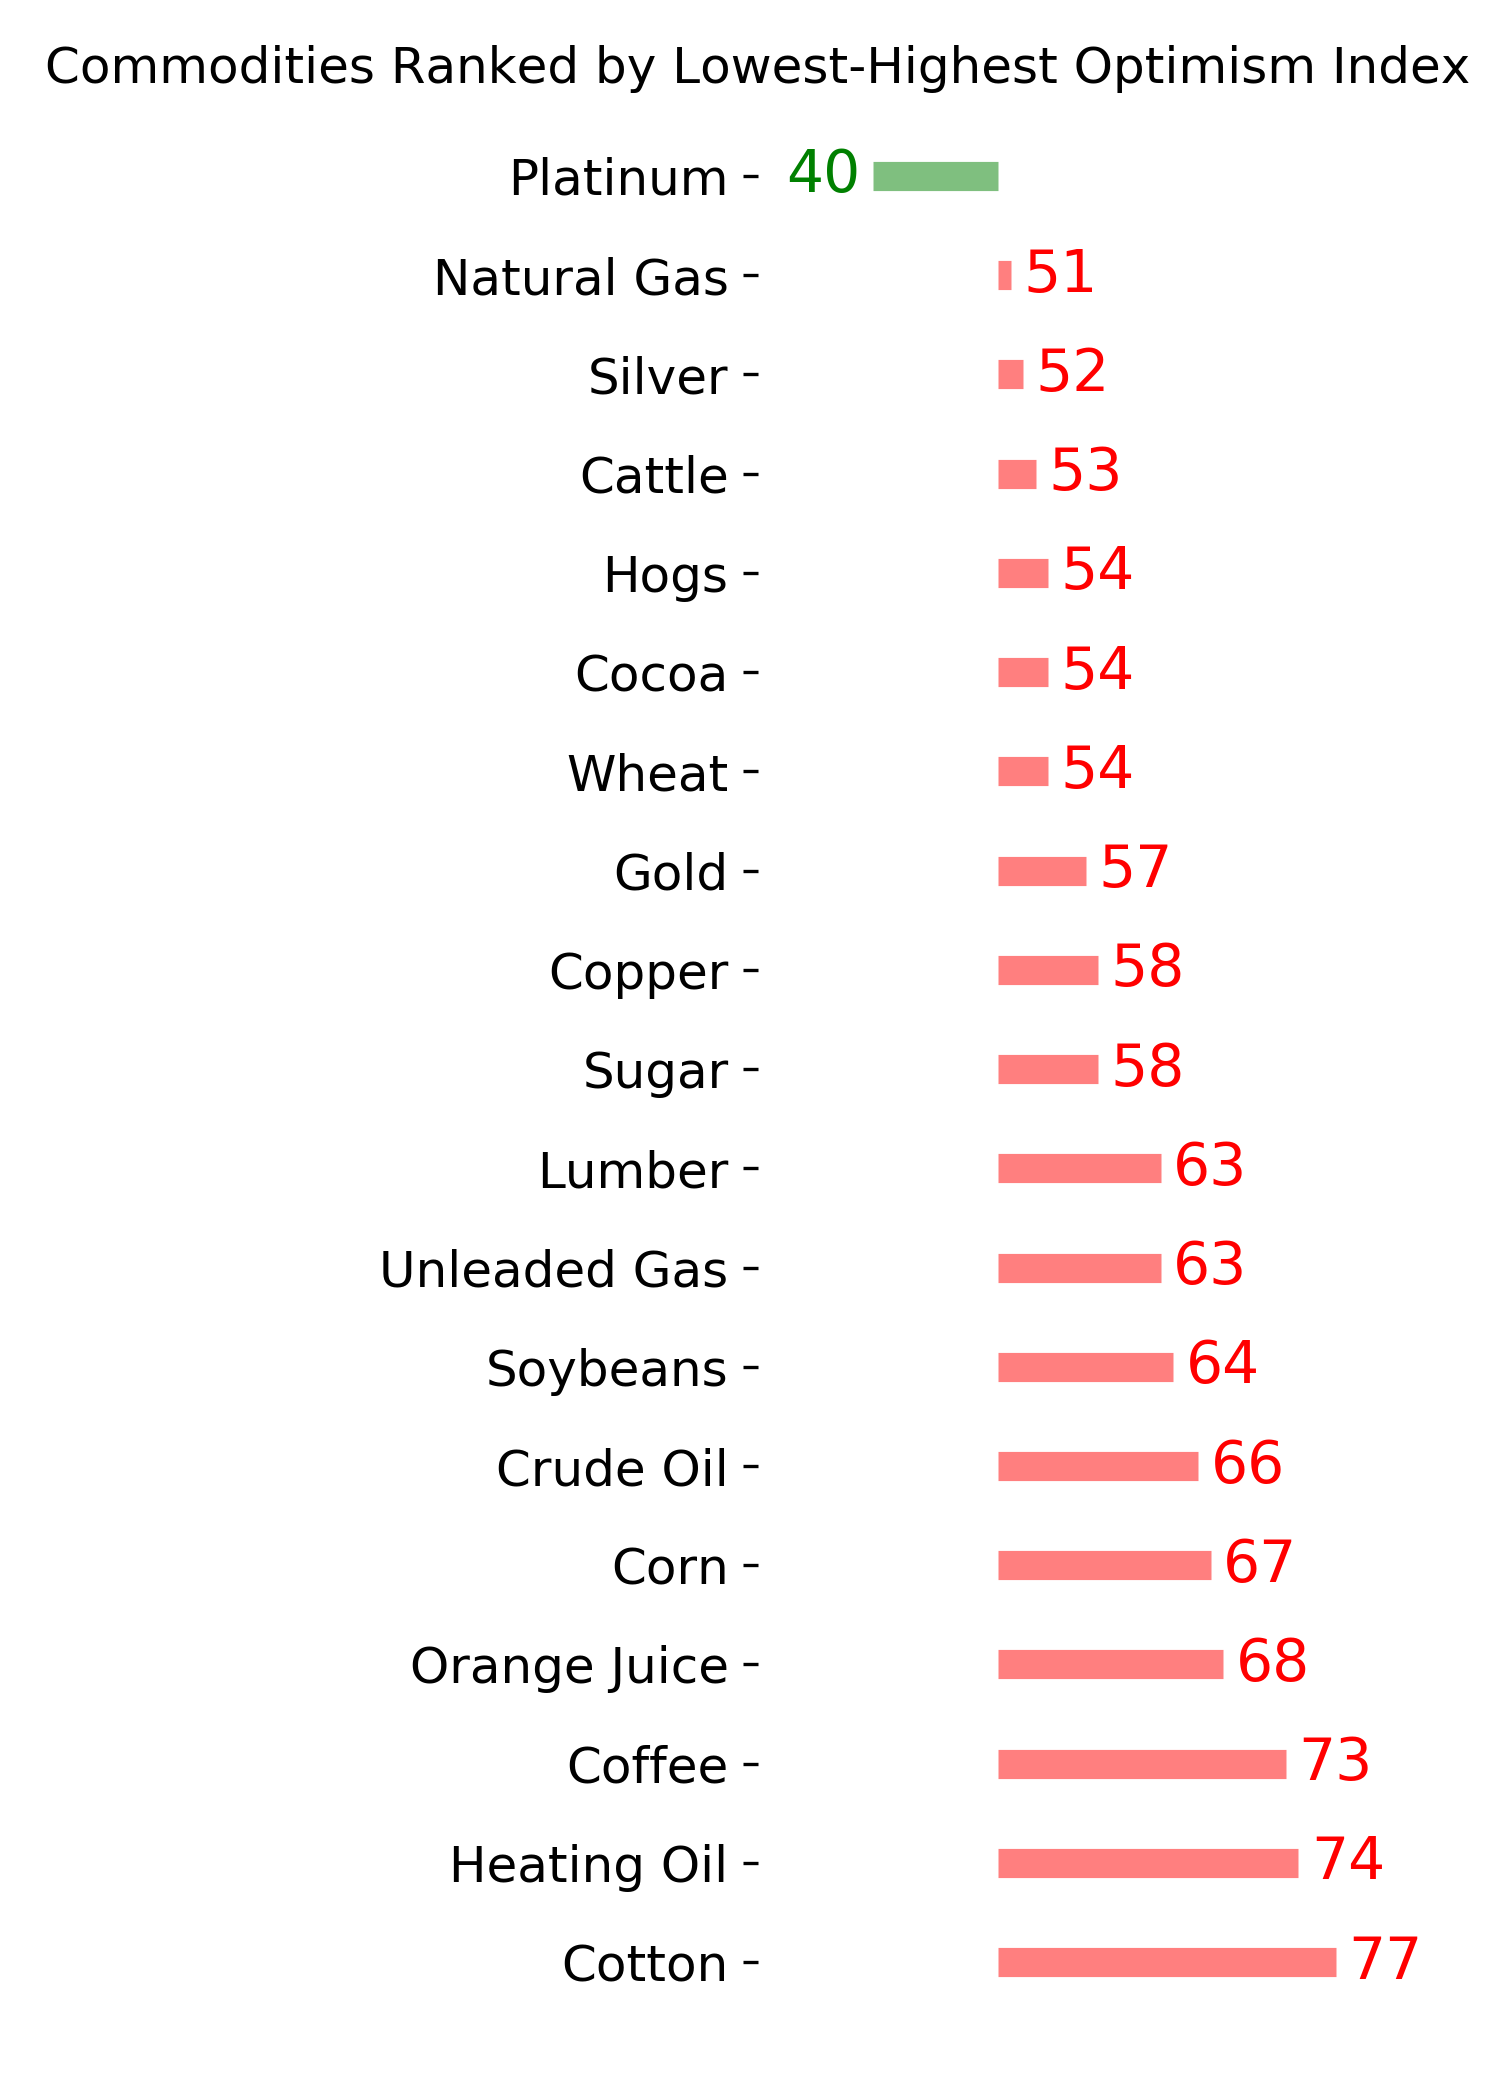
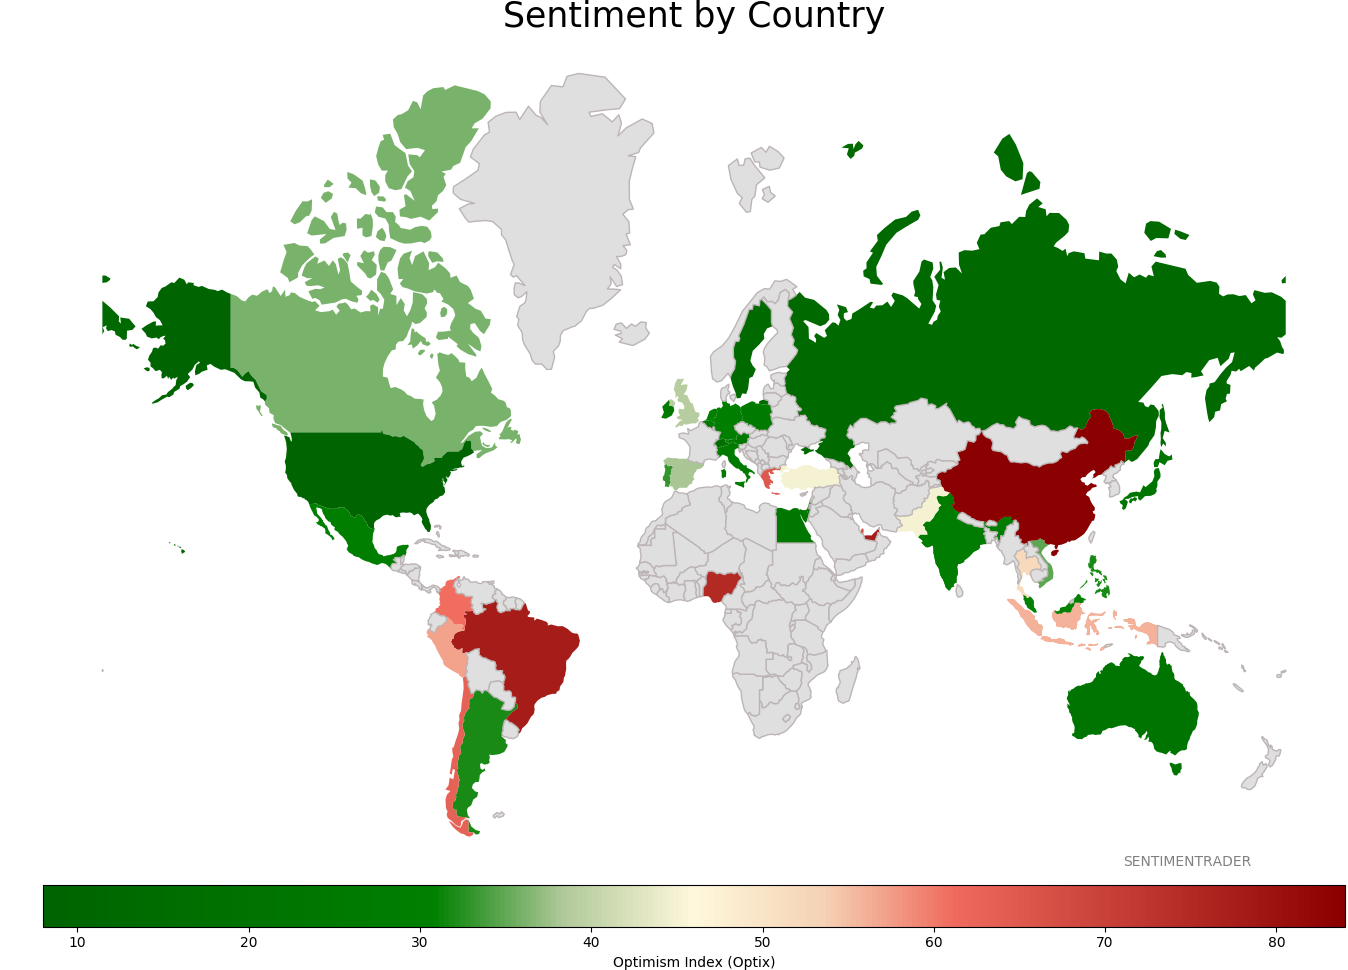
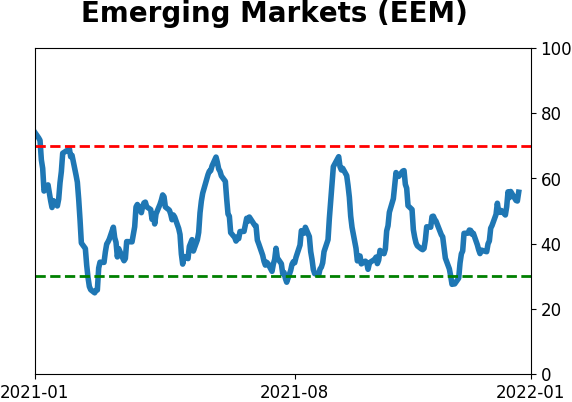
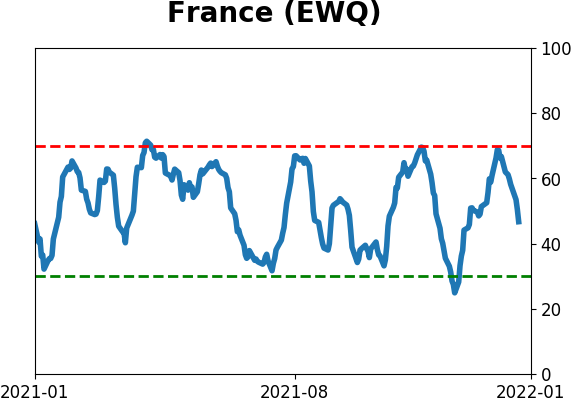
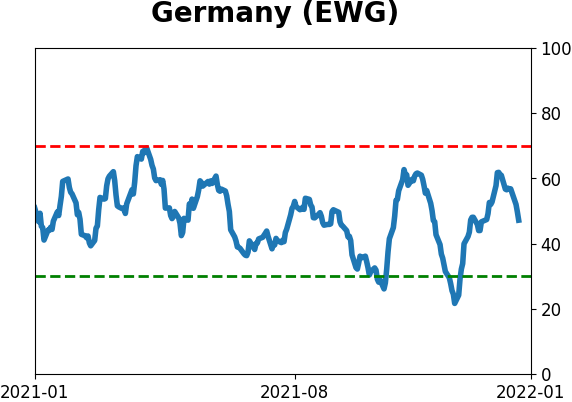
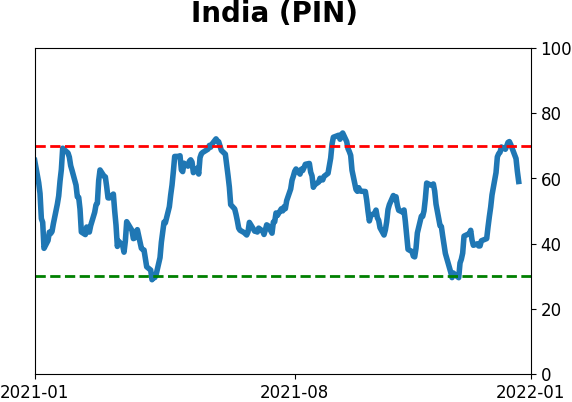
Sentiment Around The World
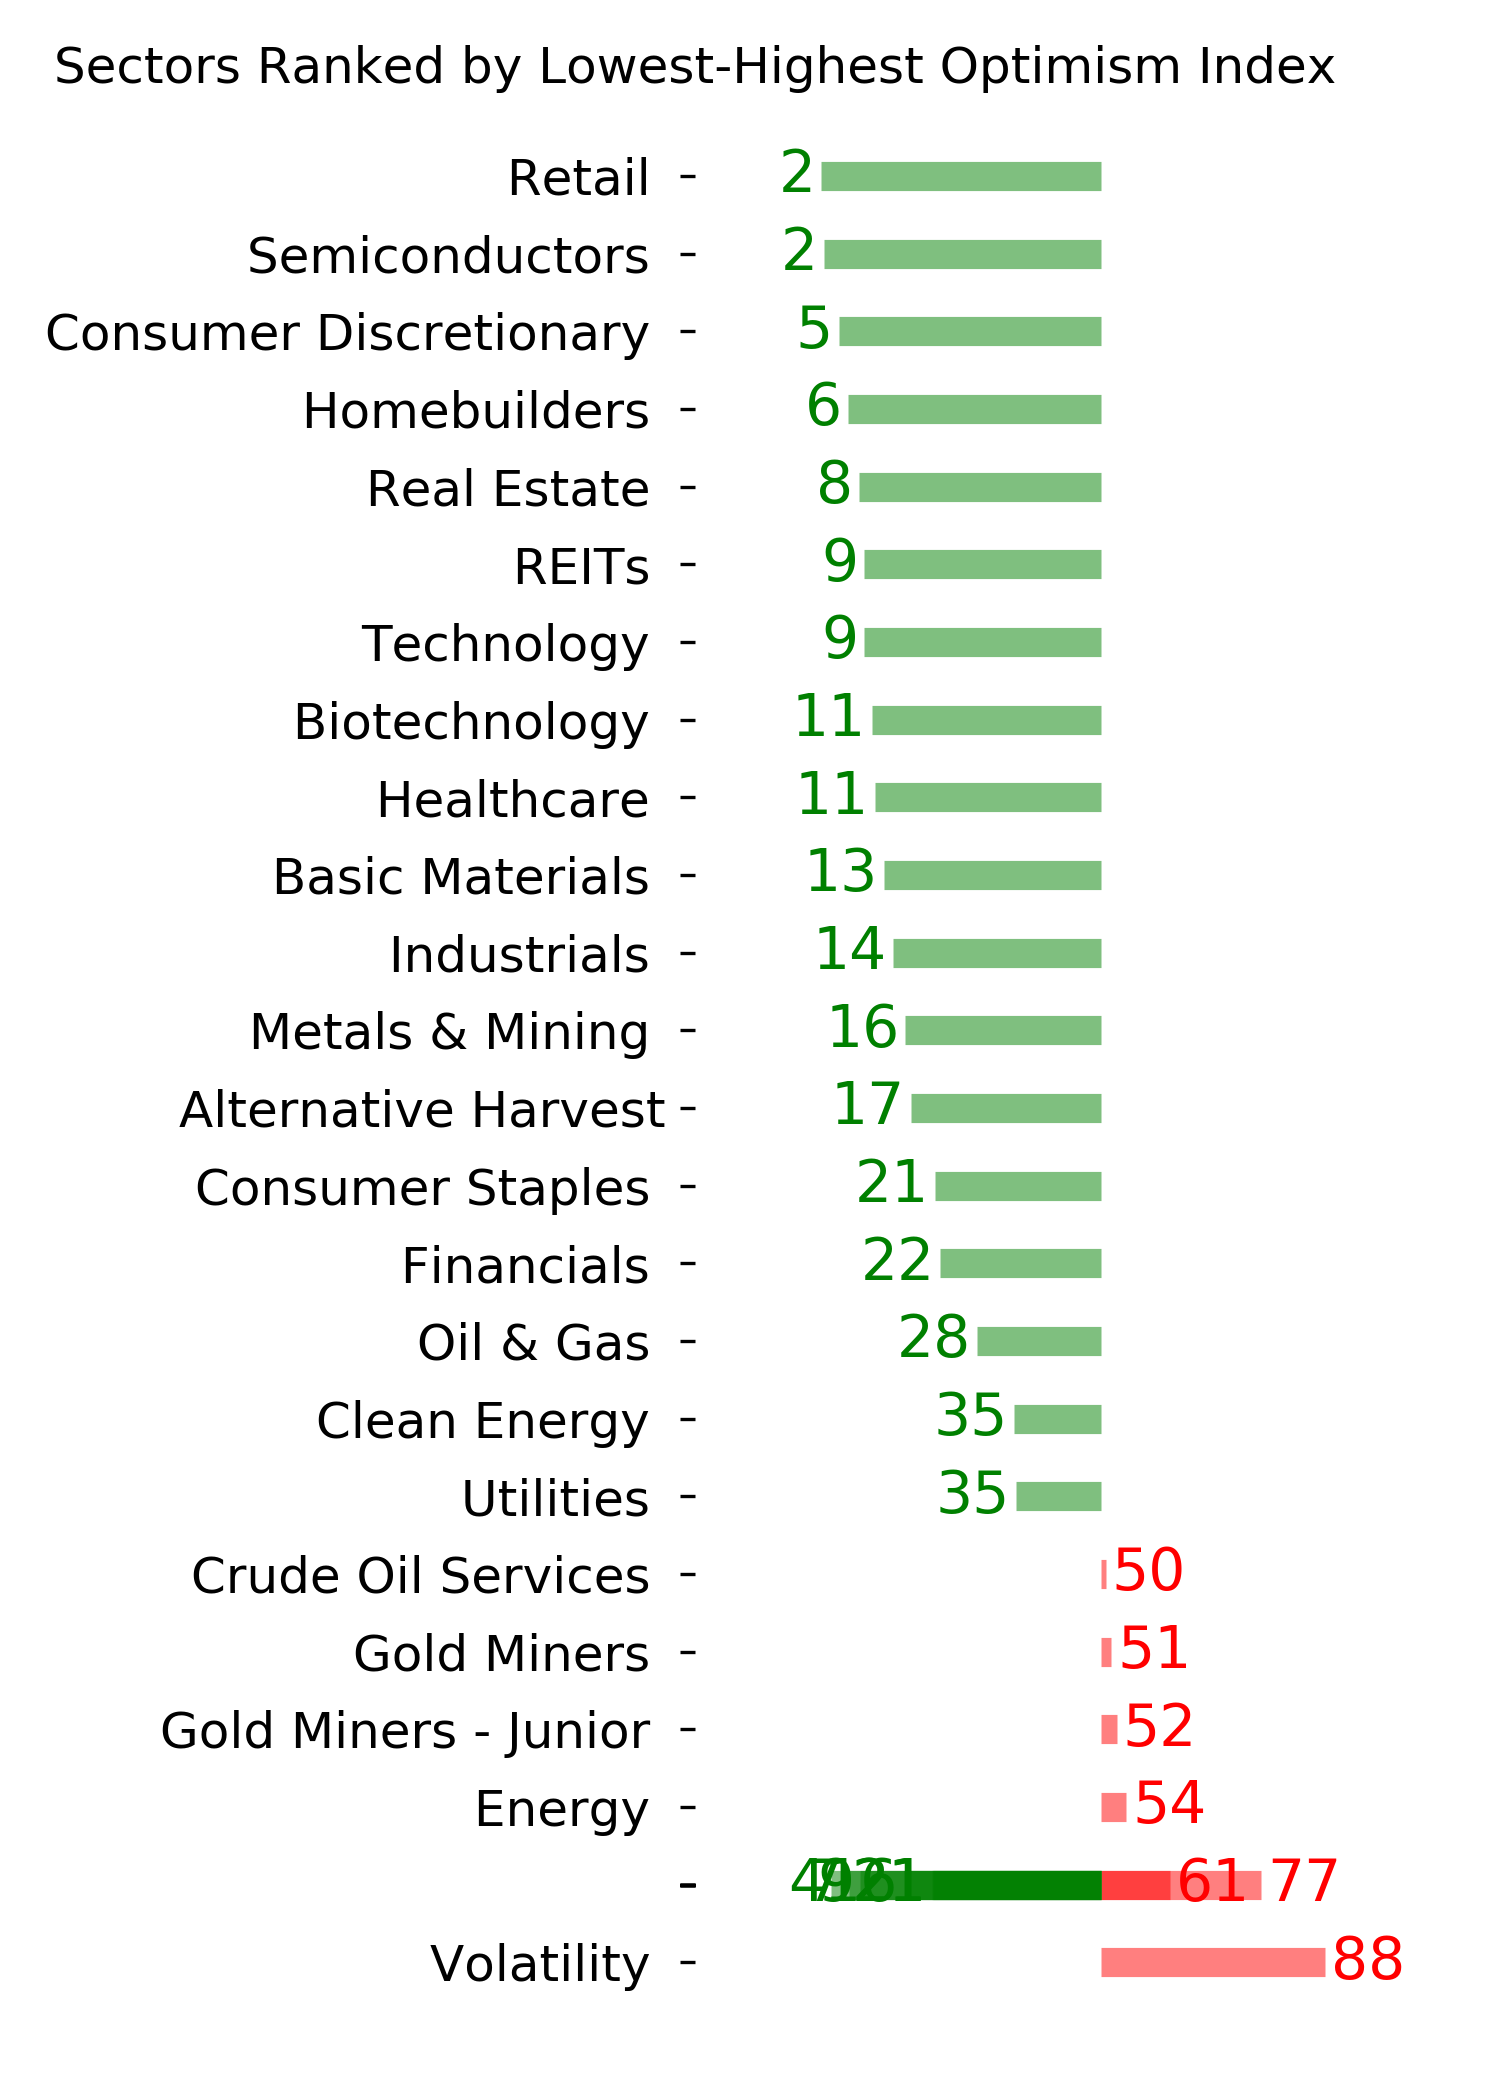
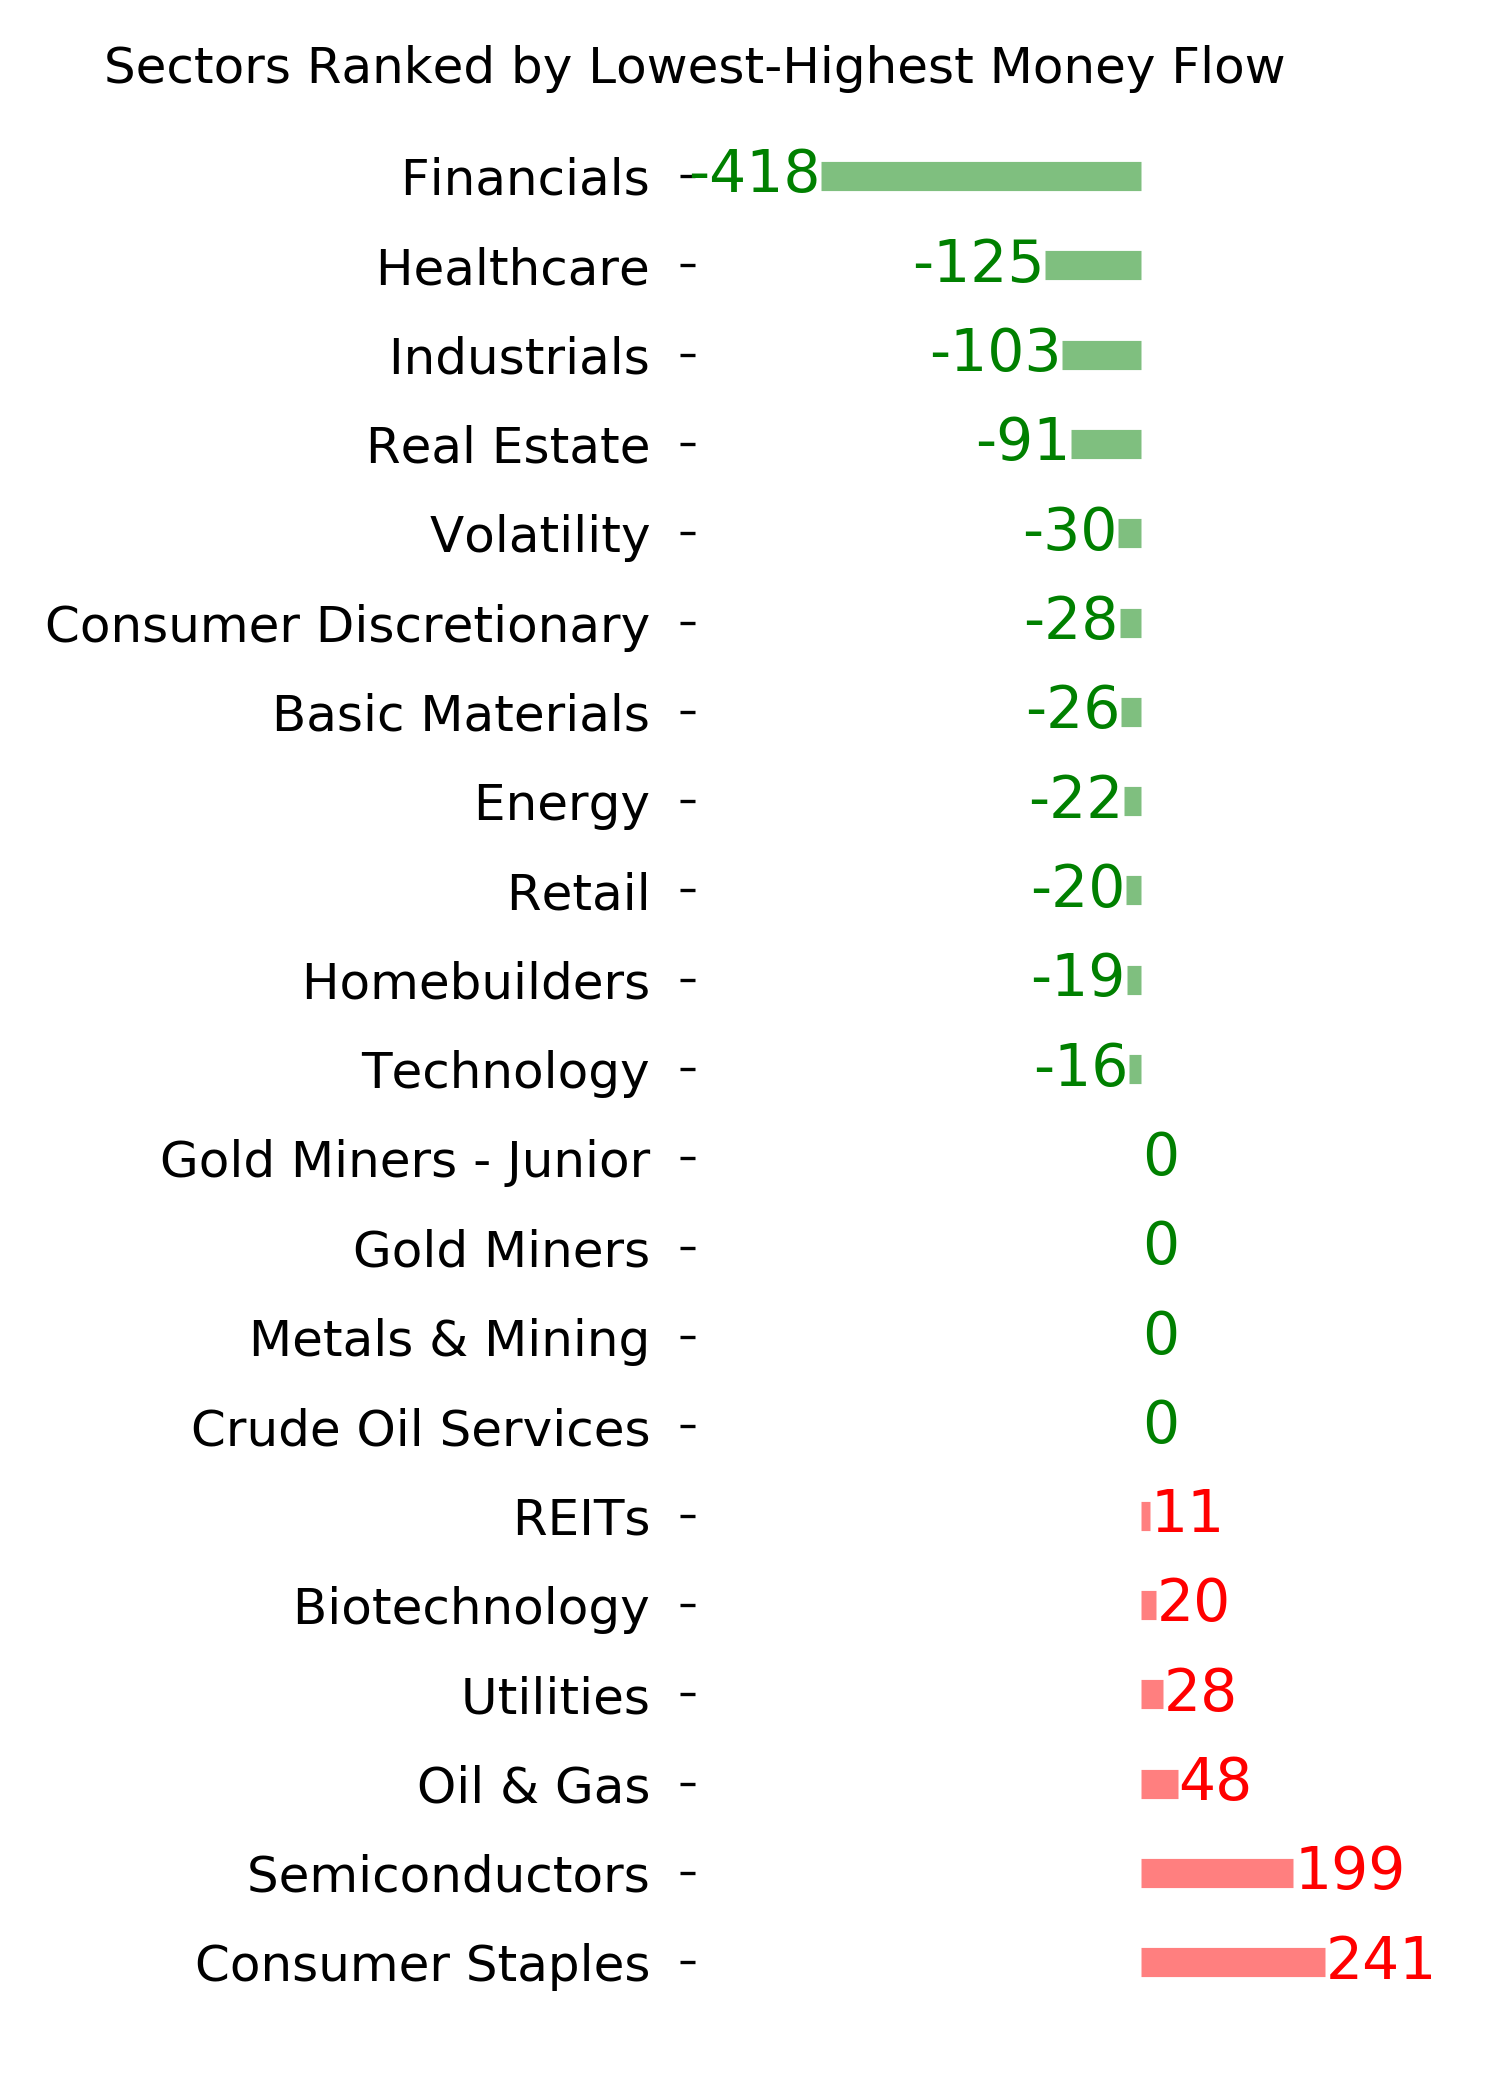
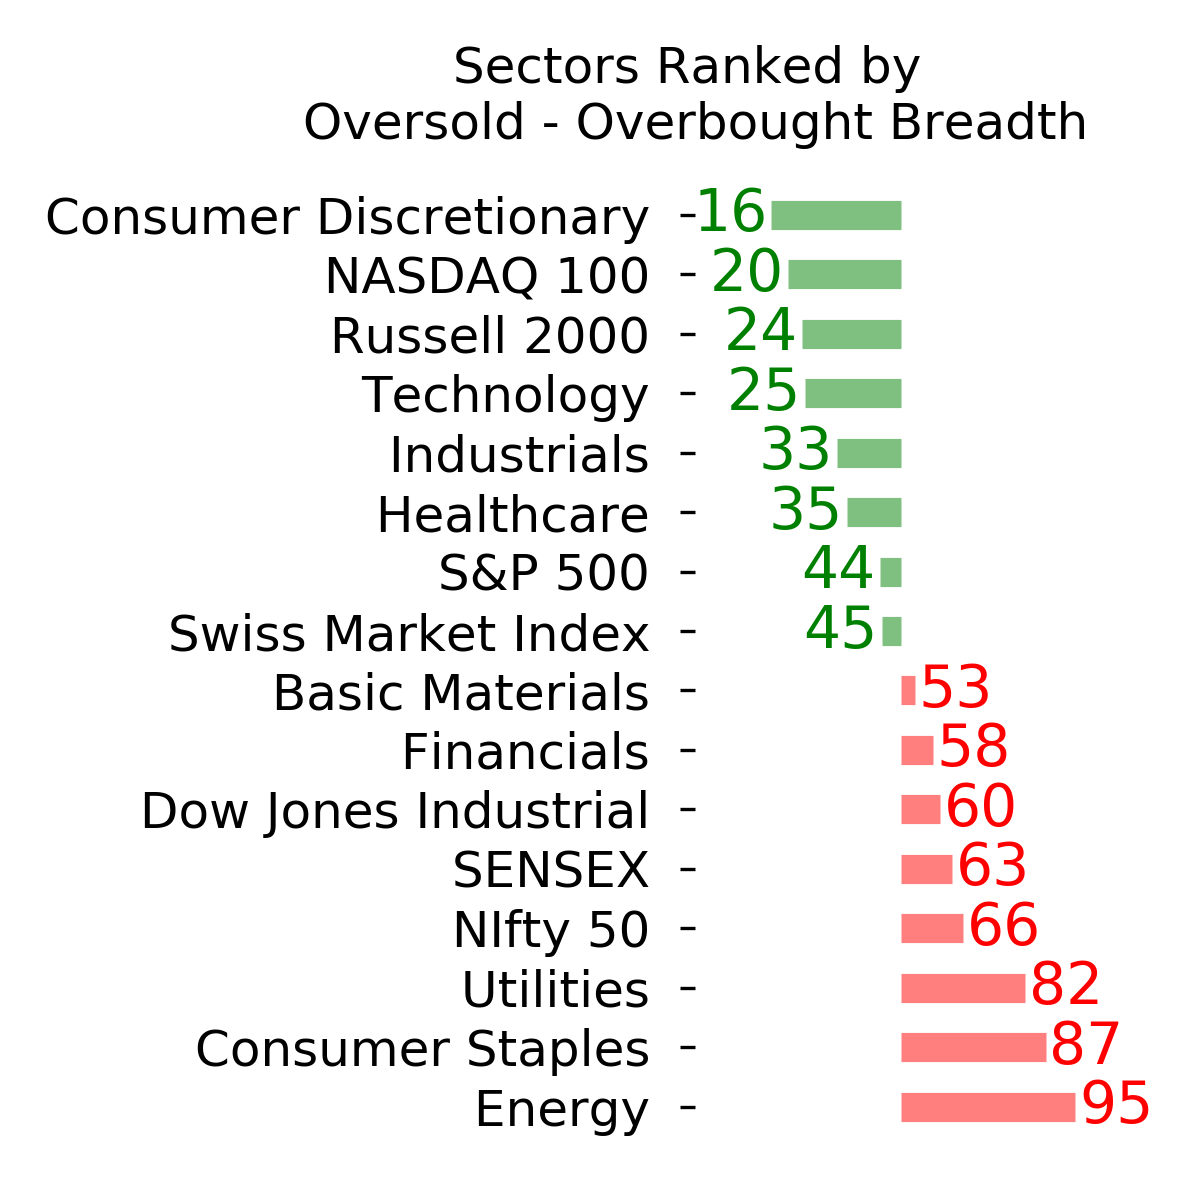
Optimism Index Thumbnails
|
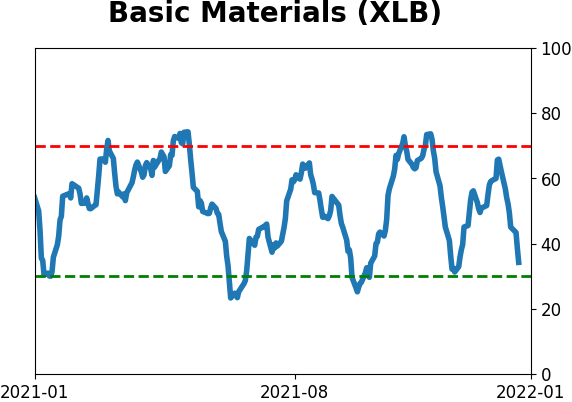
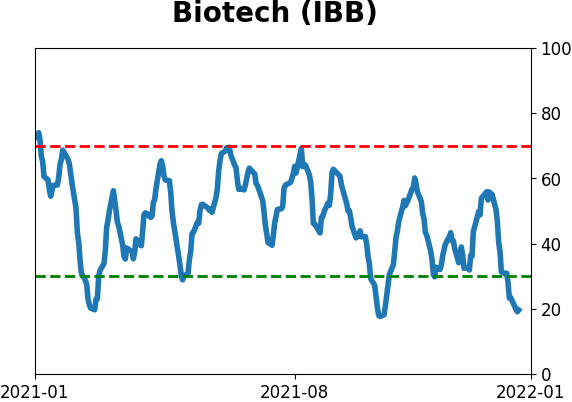
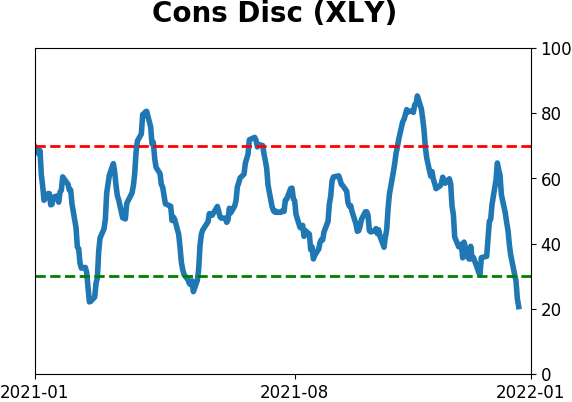
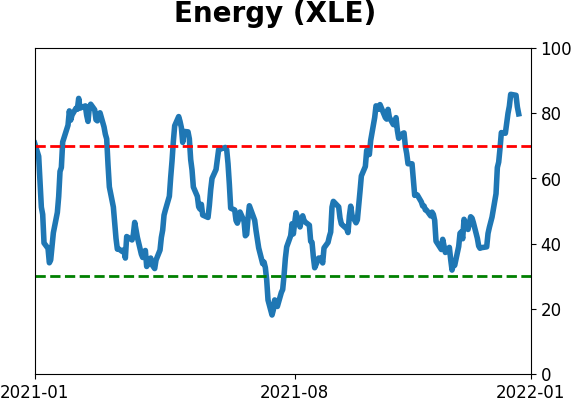
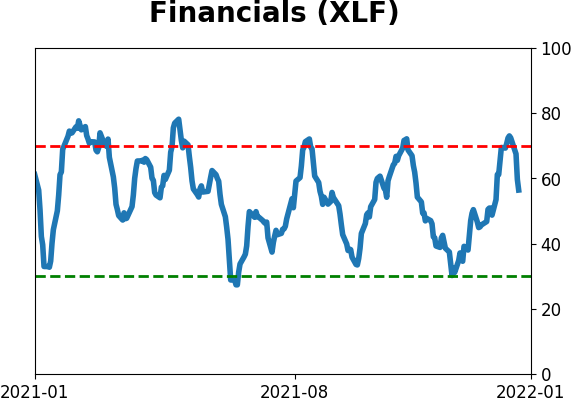
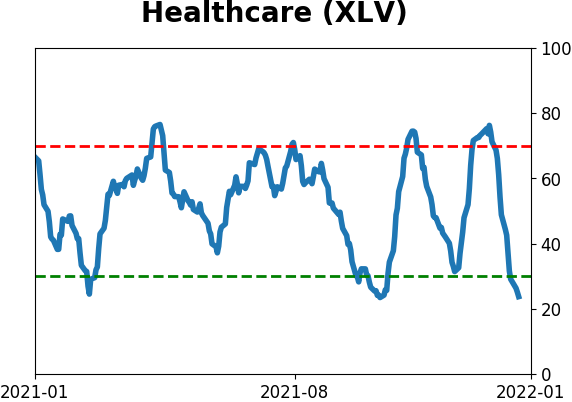
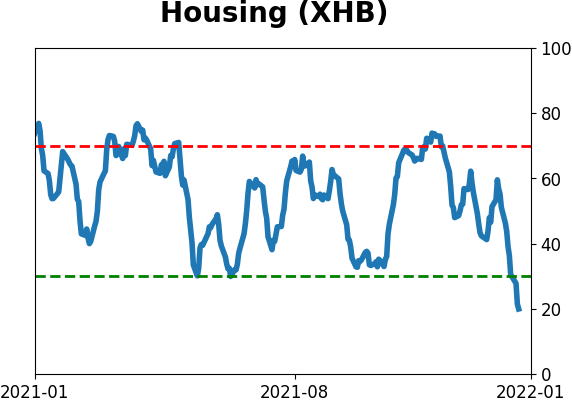
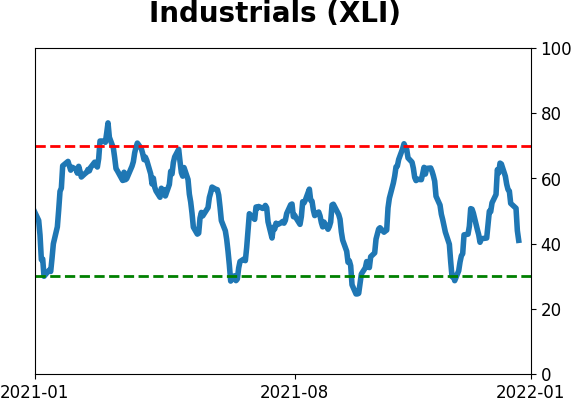
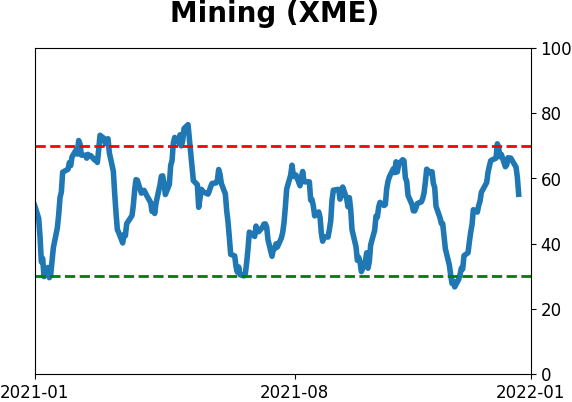
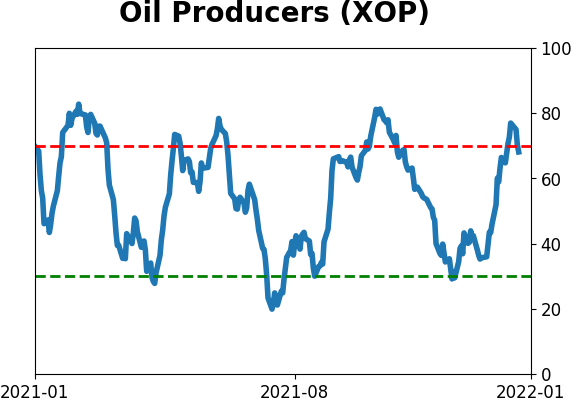
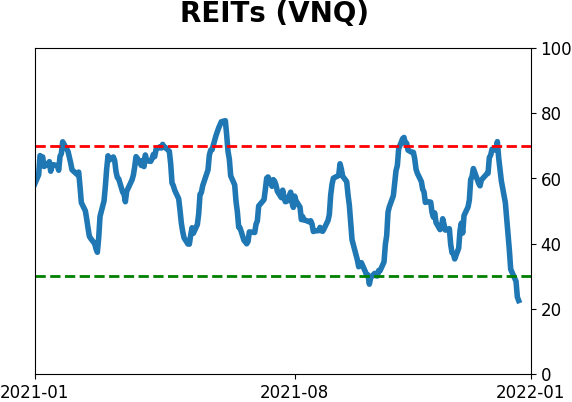
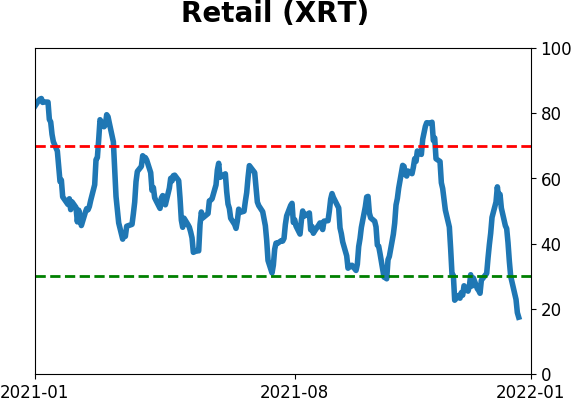
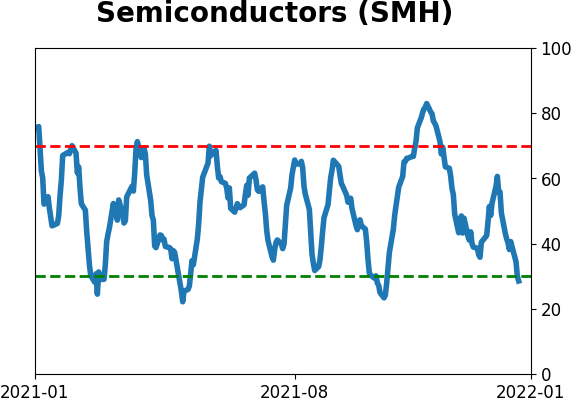
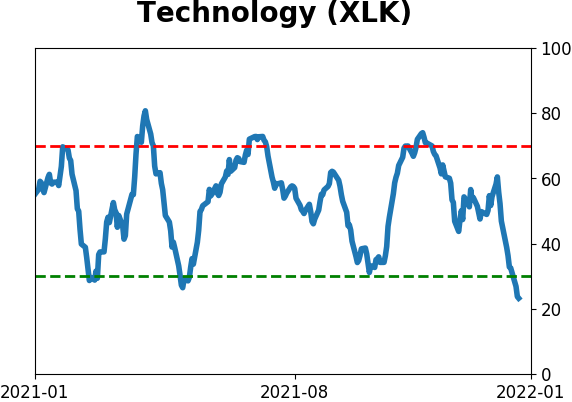
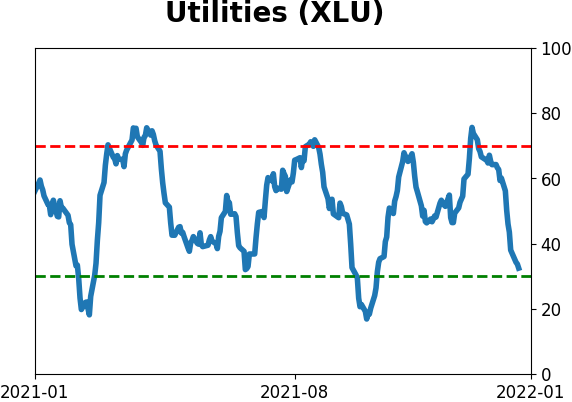
Sector ETF's - 10-Day Moving Average
|
|
|
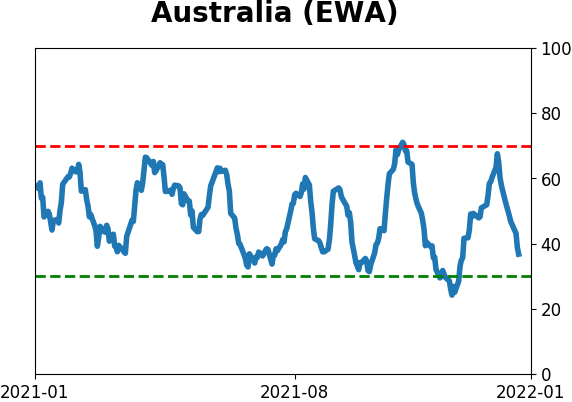
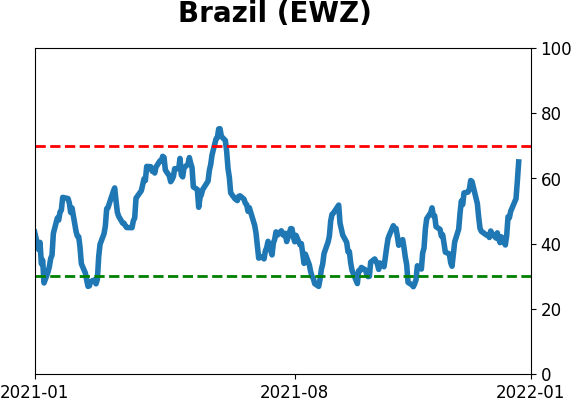
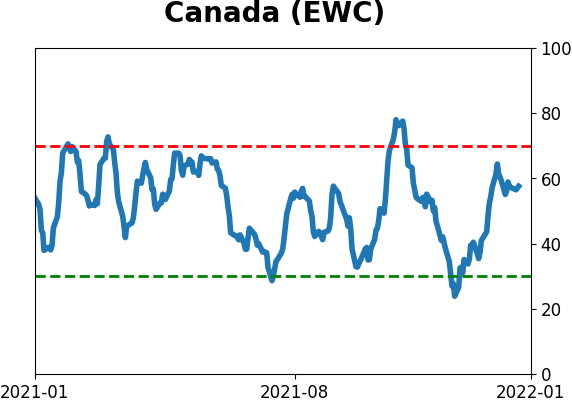
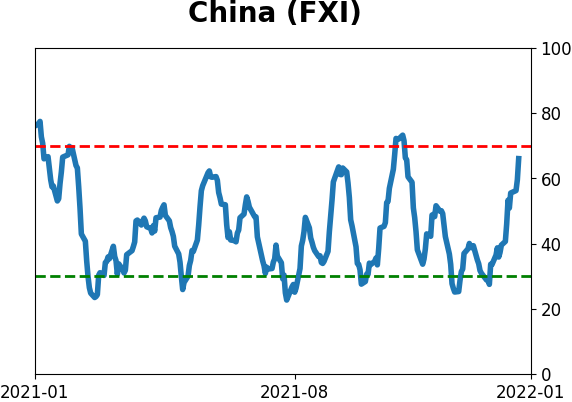
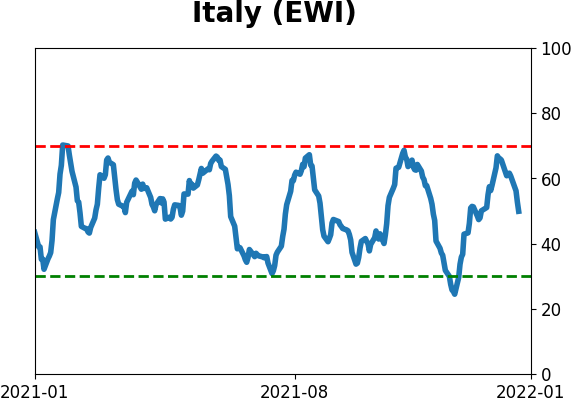
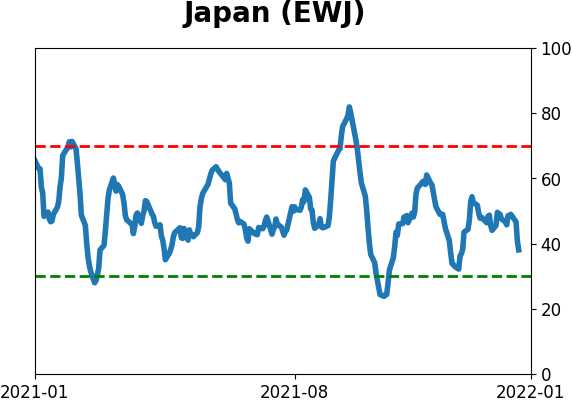
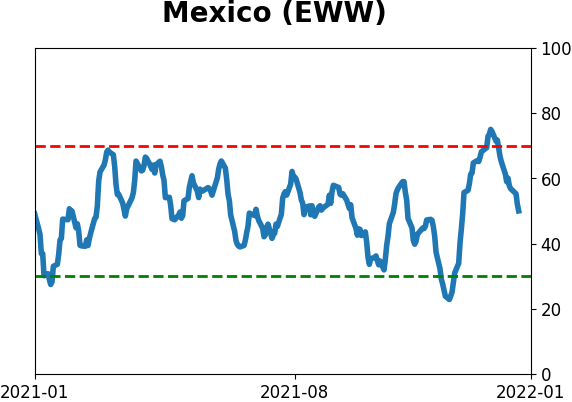
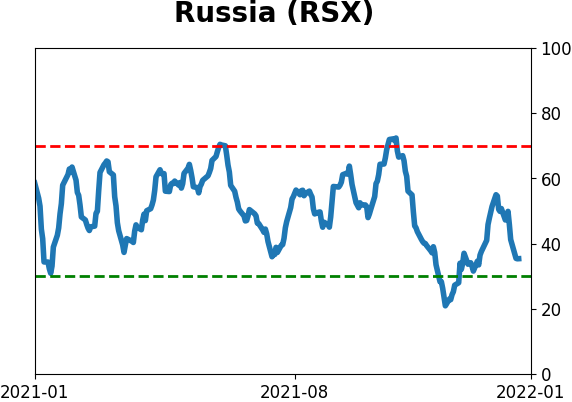
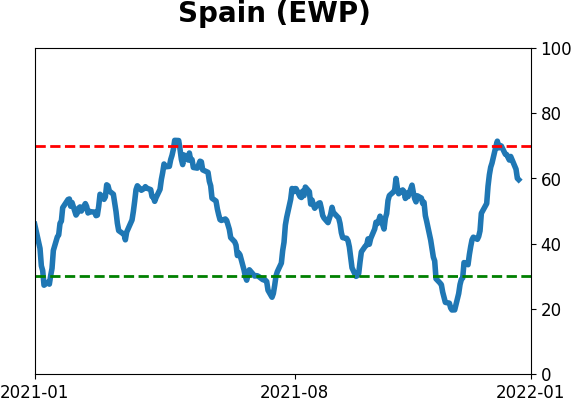
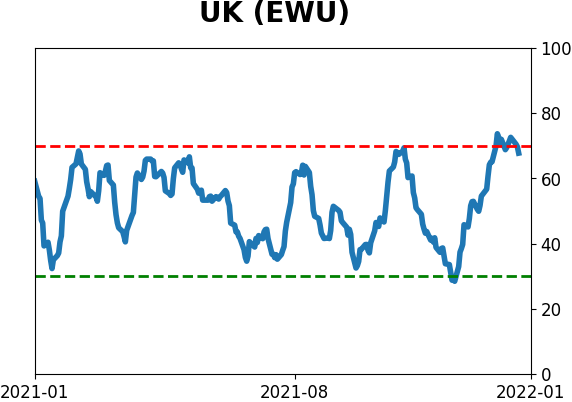
Country ETF's - 10-Day Moving Average
|
|
|
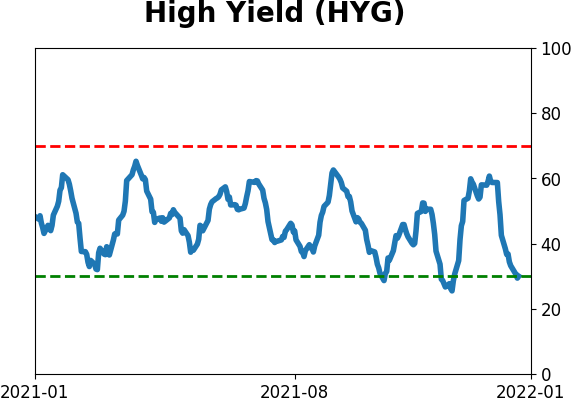
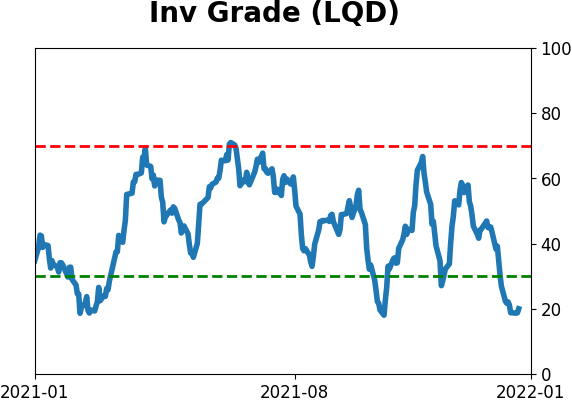
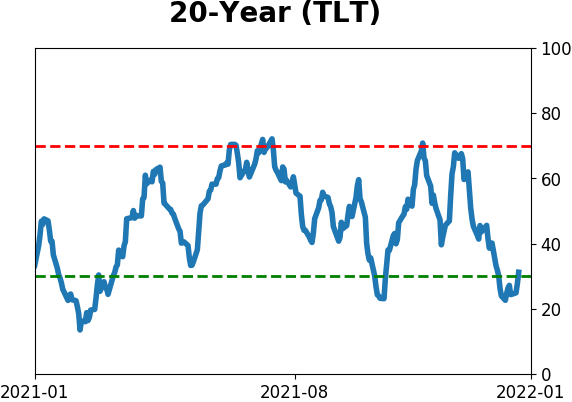
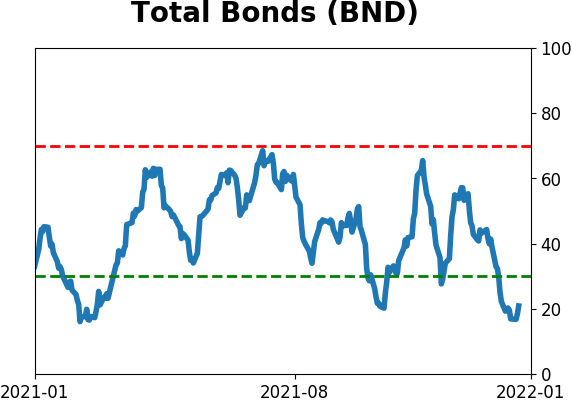
Bond ETF's - 10-Day Moving Average
|
|
|
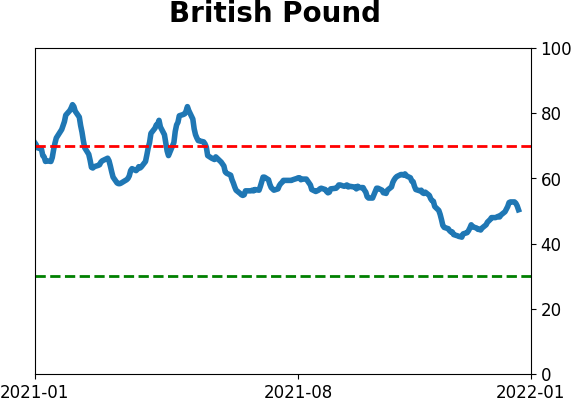
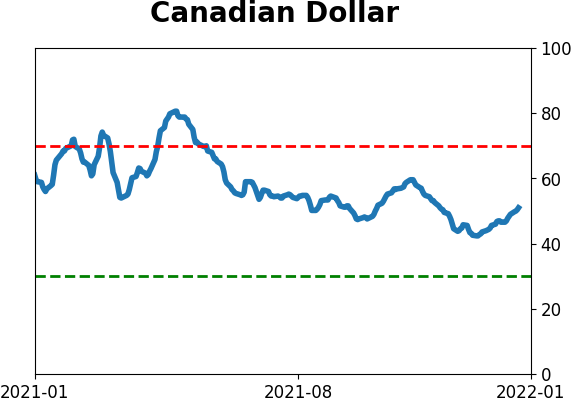
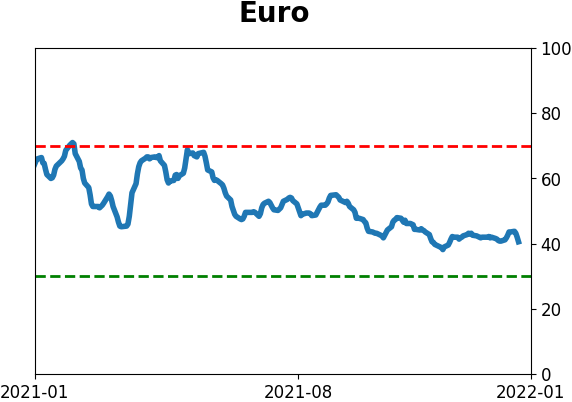
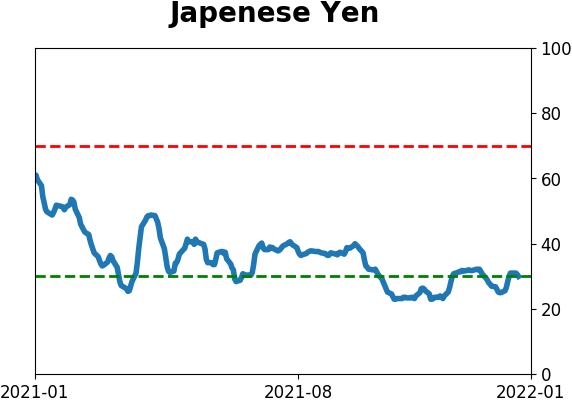
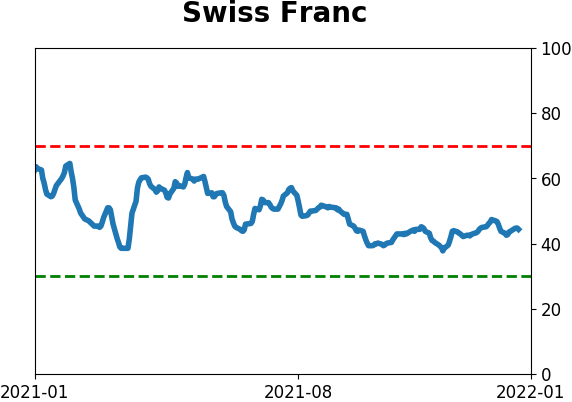
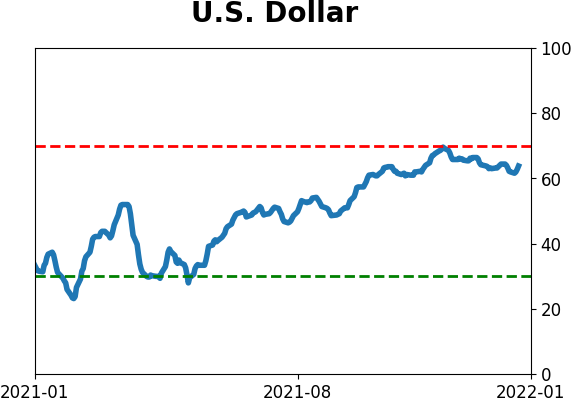
Currency ETF's - 5-Day Moving Average
|
|
|
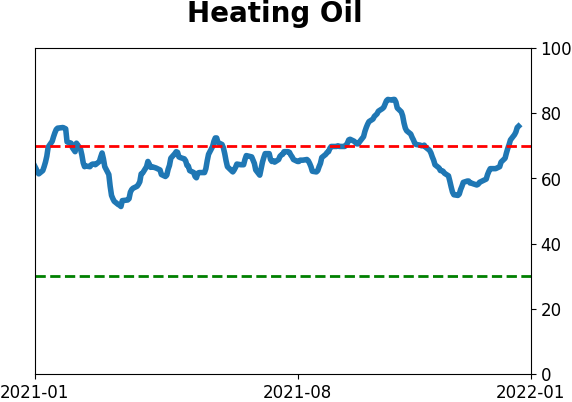
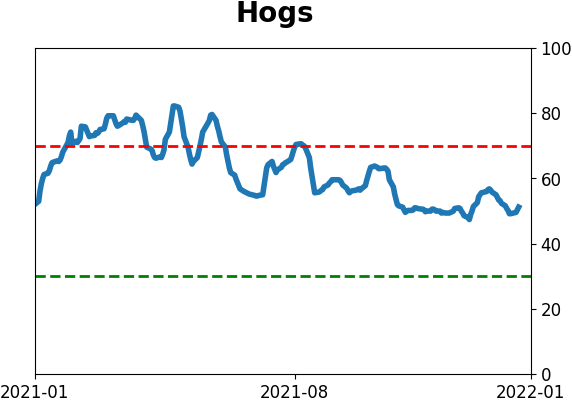
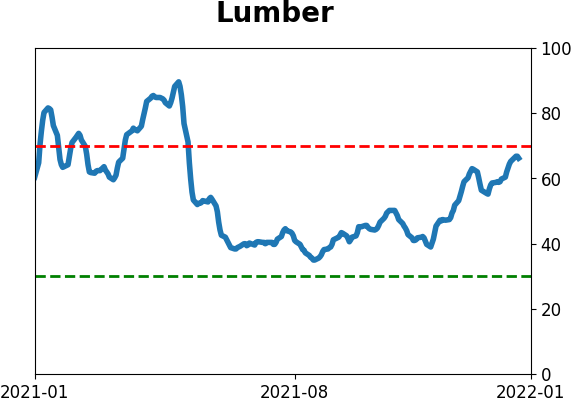
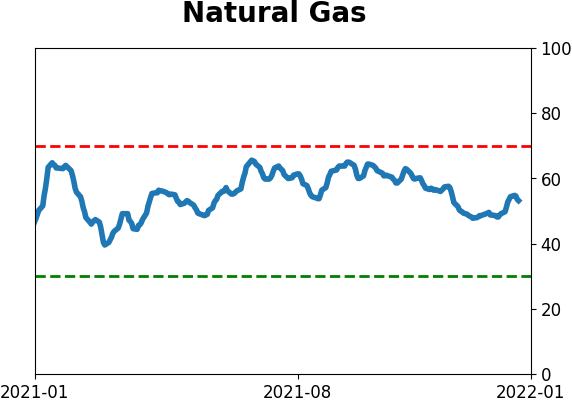
Commodity ETF's - 5-Day Moving Average
|
|